. 2023 Nov 14:14:1240642.
doi: 10.3389/fpls.2023.1240642. eCollection 2023.

Transport capacity is uncoupled with endodormancy breaking in sweet cherry buds: physiological and molecular insights

Affiliations

Transport capacity is uncoupled with endodormancy breaking in sweet cherry buds: physiological and molecular insights

Mathieu Fouché et al. Front Plant Sci. .

Abstract

Introduction: To avoid the negative impacts of winter unfavorable conditions for plant development, temperate trees enter a rest period called dormancy. Winter dormancy is a complex process that involves multiple signaling pathways and previous studies have suggested that transport capacity between cells and between the buds and the twig may regulate the progression throughout dormancy stages. However, the dynamics and molecular actors involved in this regulation are still poorly described in fruit trees.

Methods: Here, in order to validate the hypothesis that transport capacity regulates dormancy progression in fruit trees, we combined physiological, imaging and transcriptomic approaches to characterize molecular pathways and transport capacity during dormancy in sweet cherry (Prunus avium L.) flower buds.

Results: Our results show that transport capacity is reduced during dormancy and could be regulated by environmental signals. Moreover, we demonstrate that dormancy release is not synchronized with the transport capacity resumption but occurs when the bud is capable of growth under the influence of warmer temperatures. We highlight key genes involved in transport capacity during dormancy.

Discussion: Based on long-term observations conducted during six winter seasons, we propose hypotheses on the environmental and molecular regulation of transport capacity, in relation to dormancy and growth resumption in sweet cherry.

Keywords: Prunus avium L.; bud dormancy; callose; temperature; transcriptomics; transport capacity.


Conflict of interest statement

The authors declare that the research was conducted in the absence of any commercial or financial relationships that could be construed as a potential conflict of interest.

Figures

Figure 1
Figure 1
Experimental evaluation of sweet cherry flower bud dormancy status and transport capacity from 2017 to 2022. (A) Dormancy stage is monitored based on the budbreak percentage after ten days under forcing conditions (25°C, 16h light, and 8h dark). The dormancy release date (dotted lines) is estimated when 50% of the buds break after ten days in forcing conditions. Dormancy release dates were March 7th 2017, March 29th 2018, March 5th 2019, February 11th 2020, March 3rd 2021 and March 14th 2022. (B) The calcein tracer recorded in 15 flower buds for each date, estimated as the ratio between green and red fluorescence, was used to evaluate transport capacity. Dotted lines represent the estimated resumption of transport capacity.
Figure 2
Figure 2
Calcein tracer visualization and flower bud development throughout dormancy for the sweet cherry ‘Fertard’ cultivar. The observations were done on longitudinal cross-sections of flower buds. For each date, buds were captured with the bright light channel (left picture) and the green channel (right) where calcein fluorescence can be visualized. Dormancy release date was determined by forcing experiments and is indicated by the dotted line.
Figure 3
Figure 3
Calcein tracer dynamics and temperature conditions. For each sampling season, the average daily temperature (blue line) is represented along with the calcein tracer (Green to Red fluorescence ratio, green line). The cold accumulation in chill portions (CP) at the estimated resumption of transport capacity is represented by the dotted lines.
Figure 4
Figure 4
Observations of callose accumulation in sweet cherry flower buds. (A) 50 µm section of a flower bud from the late flowering cultivar ‘Fertard’, stained using toluidine blue, with two squares representing the approximate areas corresponding to the March 6th imaging (red square) and March 29th (yellow square). (B) bud break percentage after ten days under forcing conditions (black) and calcein tracer (green) during the 2016-2017 sampling campaign. The dash vertical lines represent the two sampling dates for imaging. Flower buds were cut into 50 µm sections and callose was observed with aniline blue fluorochrome on (C), (D) March 6th and (E), (F) March 29th. Arrows show aniline blue fluorescence in the vascular systems. SP: sieve plate; PPU: Pore-plasmodesmata unit.
Figure 5
Figure 5
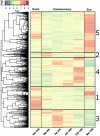
Clusters of expression patterns for differentially expressed genes during dormancy in flower buds of the sweet cherry cultivar ‘Fertard’. Heatmap representing the average z-score calculated for each gene from three trees at a given date. Each row corresponds to the expression pattern across samples for one gene. Upper panel represents the colors corresponding to the z-score values. Gene clusters are ordered based on the chronology of the expression peak (from earliest 1) dormancy onset, 2) early endodormancy, 3) mid endodormancy, 4) late endodormancy and 5) ecodormancy). Expression values were normalized and z-scores are represented here.
Figure 6
Figure 6
Expression profiles of key genes involved in transport capacity. Cluster 1 and 5 genes are down regulated during endodormancy, contrary to cluster 2, 3 and 4 which are upregulated. Genes have been chosen based on their expression profile and their functional annotation. Points represent the average TPM and error bars correspond to the data range (n=3 for each date).
Figure 7
Figure 7
Genes showing the best correlation with the calcein tracer during flower bud dormancy. (A) The calcein tracer for 2017/2018 was evaluated using green to red fluorescence ratio on longitudinal bud sections. The line corresponds to the average of 15 buds. (B) Average expression profile for the genes with the expression levels, expressed as z scores, best correlated with the calcein tracer. (C) Details for the 21 genes with a correlation of at least 0.9 with the calcein tracer.

References

    1. Afzal Z., Howton T., Sun Y., Mukhtar M. (2016). The roles of aquaporins in plant stress responses. J. Dev. Biol. 4, 9. doi: 10.3390/jdb4010009 - DOI - PMC - PubMed
    1. Alexa A., Rahnenfuhrer J. (2023). topGO: Enrichment Analysis for Gene Ontology (R package version 2.52.0). https://bioconductor.org/packages/release/bioc/html/topGO.html.
    1. Aloni R., Raviv A., Peterson C. A. (1991). The role of auxin in the removal of dormancy callose and resumption of phloem activity in Vitis vinifera. Can. J. Bot. 69 (8), 1825–1832. doi: 10.1139/b91-232 - DOI
    1. Aloni et P. (1997). Auxin promotes dormancy callose removal from the phloem ofMagnolia kobus and callose accumulation and earlywood vessel differentiation inQuercus robur. J. Oh Plant Res. doi: 10.1007/BF02506841 - DOI - PubMed
    1. Ameglio T., Bodet C., Lacointe A., Cochard H. (2002). Winter embolism, mechanisms of xylem hydraulic conductivity recovery and springtime growth patterns in walnut and peach trees. Tree Physiol. 22, 1211–1220. doi: 10.1093/treephys/22.17.1211 - DOI - PubMed