. 2024 May 1:16:1390915.
doi: 10.3389/fnagi.2024.1390915. eCollection 2024.

Testosterone deficiency worsens mitochondrial dysfunction in APP/PS1 mice

Affiliations

Testosterone deficiency worsens mitochondrial dysfunction in APP/PS1 mice

Tianyun Zhang et al. Front Aging Neurosci. .

Abstract

Background: Recent studies show testosterone (T) deficiency worsens cognitive impairment in Alzheimer's disease (AD) patients. Mitochondrial dysfunction, as an early event of AD, is becoming critical hallmark of AD pathogenesis. However, currently, whether T deficiency exacerbates mitochondrial dysfunction of men with AD remains unclear.

Objective: The purpose of this study is to explore the effects of T deficiency on mitochondrial dysfunction of male AD mouse models and its potential mechanisms.

Methods: Alzheimer's disease animal model with T deficiency was performed by castration to 3-month-old male APP/PS1 mice. Hippocampal mitochondrial function of mice was analyzed by spectrophotometry and flow cytometry. The gene expression levels related to mitochondrial biogenesis and mitochondrial dynamics were determined through quantitative real-time PCR (qPCR) and western blot analysis. SH-SY5Y cells treated with flutamide, T and/or H2O2 were processed for analyzing the potential mechanisms of T on mitochondrial dysfunction.

Results: Testosterone deficiency significantly aggravated the cognitive deficits and hippocampal pathologic damage of male APP/PS1 mice. These effects were consistent with exacerbated mitochondrial dysfunction by gonadectomy to male APP/PS1 mice, reflected by further increase in oxidative damage and decrease in mitochondrial membrane potential, complex IV activity and ATP levels. More importantly, T deficiency induced the exacerbation of compromised mitochondrial homeostasis in male APP/PS1 mice by exerting detrimental effects on mitochondrial biogenesis and mitochondrial dynamics at mRNA and protein level, leading to more defective mitochondria accumulated in the hippocampus. In vitro studies using SH-SY5Y cells validated T's protective effects on the H2O2-induced mitochondrial dysfunction, mitochondrial biogenesis impairment, and mitochondrial dynamics imbalance. Administering androgen receptor (AR) antagonist flutamide weakened the beneficial effects of T pretreatment on H2O2-treated SH-SY5Y cells, demonstrating a critical role of classical AR pathway in maintaining mitochondrial function.

Conclusion: Testosterone deficiency exacerbates hippocampal mitochondrial dysfunction of male APP/PS1 mice by accumulating more defective mitochondria. Thus, appropriate T levels in the early stage of AD might be beneficial in delaying AD pathology by improving mitochondrial biogenesis and mitochondrial dynamics.

Keywords: Alzheimer’s disease; hippocampus; mitochondrial biogenesis; mitochondrial dynamics; mitochondrial dysfunction; testosterone deficiency.


Conflict of interest statement

The authors declare that the research was conducted in the absence of any commercial or financial relationships that could be construed as a potential conflict of interest.

Figures
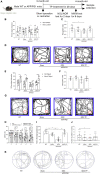
FIGURE 1
FIGURE 1
Effects of testosterone deficiency on cognitive-behavioral deficits in male APP/PS1 mice. (A) The gene modification map is shown, and the research process is illustrated, including sham operation or castration, TP treatment and behavioral tests. A novel object location (NOL) test was performed to analyze the location memory of the mice. It included a familiarization trial, 1 h retention interval and a novel location test. (B) The % time object interaction and (C) recognition index (calculated as the ratio of time spent exploring the new location to total exploration time) of each mouse were compared. (D) Representative moving traces in NOL test show the exploration to the familiar (gray square) and the novel (red square) location. A novel object recognition (NOR) test was performed to analyze the object recognition memory of the mice. It included a familiarization trial, 1 h retention interval and a novel object test. (E) The % time object interaction and (F) recognition index (calculated as the ratio of time spent exploring the novel object to total exploration time) of each mouse were compared. (G) Representative moving patterns in NOR test show the exploration to the familiar (gray square) and the novel (red circle) object. Morris water maze (MWM) test was performed to assess the learning and spatial memory of the mice. (H) Escape latency, (I) time in the target quadrant, (J) number of platform crossing, and (K) the representative path patterns were tested. WT, wild-type; TP, testosterone propionate. Data are expressed as the mean ± SD (n = 12). *P < 0.05 and **P < 0.01.
FIGURE 2
FIGURE 2
Effects of testosterone deficiency on pathological alterations in the hippocampus of male APP/PS1 mice. qPCR and Western blot were performed respectively to analyze relative (A) mRNA levels of SYP, (B) representative blots for SYP and relative protein levels of SYP, (C) relative mRNA levels of PSD-95, and (D) representative blots for PSD-95 and relative protein levels of PSD-95. The complete Western blots for each sample are provided in Supplementary Data. (E) Immunohistochemistry staining revealed the expression of Aβ1–42 in hippocampus. (F) The area of Aβ1–42 plaques. (G) The number of Aβ1–42 plaques. Data are expressed as the mean ± SD (n = 6 for qPCR, n = 5 for Western blot, n = 6 for immunohistochemistry). *P < 0.05 and **P < 0.01.
FIGURE 3
FIGURE 3
Effects of testosterone deficiency on oxidative stress in the hippocampus of male APP/PS1 mice. (A) MDA levels were analyzed by spectrophotometry. (B,C) 3-NT, a biomarker of protein nitration and oxidative stress, was detected by immunohistochemistry. Spectrophotometry was also utilized to measure (D) the ratio of GSH/GSSG and (E) Mn-SOD activity. (F) qPCR was used to assess the relative mRNA levels of Mn-SOD. (G) Western blot was performed to evaluate the relative protein levels of Mn-SOD, and representative blots for Mn-SOD was shown. The complete representative Western blots for each sample are provided in Supplementary Data. AOD, average optical density. Data are expressed as the mean ± SD (n = 6 for spectrophotometry and qPCR, n = 6 for immunohistochemistry, n = 5 for Western blot). *P < 0.05 and **P < 0.01.
FIGURE 4
FIGURE 4
Effects of testosterone deficiency on mitochondrial dysfunction in the hippocampus of male APP/PS1 mice. (A,B) Mitochondrial membrane potential was detected by flow cytometry. (C) ATP levels and (D) mitochondrial complex activities were assessed by spectrophotometry. Data are expressed as the mean ± SD (n = 6). *P < 0.05 and **P < 0.01.
FIGURE 5
FIGURE 5
Effects of testosterone deficiency on mitochondrial biogenesis in the hippocampus of male APP/PS1 mice. (A) Mitochondrial citrate synthase activity was assessed by spectrophotometry. (B) mtDNA copy number was detected by qPCR. (C) Relative mRNA levels of PGC-1α, NRF-1, and TFAM were detected by qPCR. (D) Representative blots for PGC-1α, NRF-1, and TFAM; (E) relative protein levels of PGC-1α, NRF-1, and TFAM were analyzed by Western blot. The complete Western blots for each sample are provided in Supplementary Data. Data are expressed as the mean ± SD (n = 6 for spectrophotometry; n = 5–6 for qPCR, n = 5 for Western blot). *P < 0.05 and **P < 0.01.
FIGURE 6
FIGURE 6
Effects of testosterone deficiency on mitochondrial dynamics genes and mitochondrial structure in the hippocampus of male APP/PS1 mice. (A) Relative mRNA levels of Drp1, Mfn1, and OPA1 were detected by qPCR. (B) Representative blots for Drp1, Mfn1, and OPA1; (C) relative protein levels of Drp1, Mfn1, and OPA1 were analyzed by Western blot. The complete Western blots for each sample are provided in Supplementary Data. (D) Mitochondrial ultrastructure images were examined by transmission electron microscope. (E) The abnormal mitochondria rate was calculated by the number of abnormal mitochondria/total number of mitochondria. Data are expressed as the mean ± SD (n = 6 for qPCR, n = 5 for Western blot, n = 3 for electron microscope). *P < 0.05 and **P < 0.01.
FIGURE 7
FIGURE 7
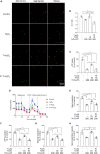
Effects of testosterone pretreatment on H2O2-induced oxidative damage and cell death in SH-SY5Y cells via androgen receptor. (A) Cell viability of SH-SY5Y cells exposed to 0–300 μM H2O2 for 24 h following 24 h pretreatment of 0–100 nM T. (B) Cell viability of SH-SY5Y cells was detected after cells being exposed to 10 μM F for 1 h, 10 nM T for 24 h or 200 μM H2O2 for 24 h. (C) The ratio of GSH/GSSG was assessed by spectrophotometry. (D) Representative blots for 3-NT and relative protein levels of 3-NT were analyzed by Western blot. The complete representative Western blots for each sample are provided in Supplementary Data. T, testosterone; F, flutamide. Data are expressed as the mean ± SD (n = 3–5 independent experiments). *P < 0.05 and **P < 0.01.
FIGURE 8
FIGURE 8
Effects of testosterone pretreatment on H2O2-induced mitochondrial dysfunction in SH-SY5Y cells via androgen receptor. (A,B) Mitochondrial membrane potential was detected by two-photon microscope. (C) ATP levels were assessed by spectrophotometry. (D) OCR was measured by XF24 Analyzer simultaneously before and after the sequential injection of oligomycin, FCCP, and rotenone/antimycin A. (E) Basal respiration, (F) ATP production, (G) maximal respiration, and (H) spare respiratory capacity were calculated sequentially. T, testosterone; F, flutamide. Data are expressed as the mean ± SD (n = 3–5 independent experiments). *P < 0.05 and **P < 0.01.
FIGURE 9
FIGURE 9
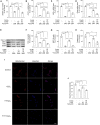
Effects of testosterone pretreatment on H2O2-damaged mitochondrial biogenesis in SH-SY5Y cells via androgen receptor. (A) mtDNA copy number, as well as (B) PGC-1α, (C) NRF-1, and (D) TFAM relative mRNA levels were detected by qPCR. (E) Representative blots of PGC-1α, NRF-1, and TFAM; relative protein levels of (F) PGC-1α, (G) NRF-1, and (H) TFAM were analyzed by Western blot. The complete Western blots for each sample are provided in Supplementary Data. (I) SH-SY5Y cells labeled with MitoTracker and Hoechst 33258 were examined by laser confocal microscopy. (J) Mitochondrial mass was expressed by the mean fluorescence intensity of mitochondria stained with MitoTracker. T, testosterone; F, flutamide. Data are expressed as the mean ± SD (n = 3 independent experiments). *P < 0.05 and **P < 0.01.
FIGURE 10
FIGURE 10
Effects of testosterone pretreatment on H2O2-damaged mitochondrial fragmentation in SH-SY5Y cells via androgen receptor. (A) Drp1, (B) Mfn1, and (C) OPA1 relative mRNA levels were detected by qPCR. Mitochondria in the SH-SY5Y cells was labeled by MitoTracker and examined by laser confocal microscopy. Punctiform mitochondria were considered fragmented mitochondria, mitochondria with clear networks were considered tubular mitochondria. (D) Representative images of mitochondrial morphology stained by MitoTracker. (E) The number of cells was counted when 80% of mitochondria in the cell are under mitochondrial fragmentation. T, testosterone; F, flutamide. Data are expressed as the mean ± SD (n = 3 independent experiments). *P < 0.05 and **P < 0.01.
FIGURE 11
FIGURE 11
Schematic image.

Similar articles

Cited by

References

    1. Ashleigh T., Swerdlow R. H., Beal M. F. (2023). The role of mitochondrial dysfunction in Alzheimer’s disease pathogenesis. Alzheimers Dement. 19 333–342. 10.1002/alz.12683 - DOI - PubMed
    1. Beal M. F. (2002). Oxidatively modified proteins in aging and disease. Free Radic. Biol. Med. 32 797–803. 10.1016/s0891-5849(02)00780-3 - DOI - PubMed
    1. Benice T. S., Raber J. (2009). Dihydrotestosterone modulates spatial working-memory performance in male mice. J. Neurochem. 110 902–911. 10.1111/j.1471-4159.2009.06183.x - DOI - PubMed
    1. Butterfield D. A., Halliwell B. (2019). Oxidative stress, dysfunctional glucose metabolism and Alzheimer disease. Nat. Rev. Neurosci. 20 148–160. 10.1038/s41583-019-0132-6 - DOI - PMC - PubMed
    1. Cacciatore I., Baldassarre L., Fornasari E., Mollica A., Pinnen F. (2012). Recent advances in the treatment of neurodegenerative diseases based on GSH delivery systems. Oxid. Med. Cell. Longev. 2012:240146. 10.1155/2012/240146 - DOI - PMC - PubMed