. 2024 Jun 24;52(11):6543-6557.
doi: 10.1093/nar/gkae403.

Two residues in the DNA binding site of Pif1 helicase are essential for nuclear functions but dispensable for mitochondrial respiratory growth

Affiliations

Two residues in the DNA binding site of Pif1 helicase are essential for nuclear functions but dispensable for mitochondrial respiratory growth

Jun Gao et al. Nucleic Acids Res. .

Abstract

Pif1 helicase functions in both the nucleus and mitochondria. Pif1 tightly couples ATP hydrolysis, single-stranded DNA translocation, and duplex DNA unwinding. We investigated two Pif1 variants (F723A and T464A) that have each lost one site of interaction of the protein with the DNA substrate. Both variants exhibit minor reductions in affinity for DNA and ATP hydrolysis but have impaired DNA unwinding activity. However, these variants translocate on single-stranded DNA faster than the wildtype enzyme and can slide on the DNA substrate in an ATP-independent manner. This suggests they have lost their grip on the DNA, interfering with coupling ATP hydrolysis to translocation and unwinding. Yeast expressing these variants have increased gross chromosomal rearrangements, increased telomere length, and can overcome the lethality of dna2Δ, similar to phenotypes of yeast lacking Pif1. However, unlike pif1Δ mutants, they are viable on glycerol containing media and maintain similar mitochondrial DNA copy numbers as Pif1 wildtype. Overall, our data indicate that a tight grip of the trailing edge of the Pif1 enzyme on the DNA couples ATP hydrolysis to DNA translocation and DNA unwinding. This tight grip appears to be essential for the Pif1 nuclear functions tested but is dispensable for mitochondrial respiratory growth.


Figures

Graphical Abstract
Graphical Abstract
Figure 1.
Figure 1.
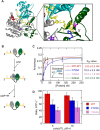
F723A and T464A substitutions reduce the DNA binding affinity and ATPase activity of Pif1. (A) Ribbon representation of ScPif1 (237–780aa) with ssDNA from the X-ray crystal structure (Protein Data Bank ID: 5O6B) (14). The Phenylalanine 723 residue (F723, blue) and Threonine 464 residue (T464, pink) interact with ssDNA (yellow) to form a ‘sandwich’ pocket. (B) The chemical step size model: upon the binding of ATP, domain 2A (the rear domain) moves forward from 5′ to 3′ by one nucleotide to close the cleft between the two RecA-like domains. Discharging the ADP and Pi causes domain 1A (the leading domain) to move forward by one nucleotide to open the cleft (2). (C) Fluorescence anisotropy of 1 nM 5′-10T-ssDNA-tailed 16 bp duplex DNA, with increasing concentrations of Pif1 wildtype (red circles), F723A (blue squares), T464A (pink diamonds), and the ATPase-deficient mutant K264A (green triangles). Data were fit to the quadratic equation to determine the dissociation constant (Kd) using the KaleidaGraph program. Error bars represent the standard deviation of three independent experiments. (D) ATP hydrolysis by Pif1 proteins was measured in the presence of 5 μM or 10 μM poly-dT ssDNA. Error bars represent the standard deviation of three independent experiments. The ‘one-way ANOVA’ test was used to calculate P-value compared to that of Pif1-WT. ‘**’ indicates P-value <0.01.
Figure 2.
Figure 2.
The F723A and T464A variants of Pif1 translocate more rapidly on ssDNA. (A) Translocation was determined by measuring the rate of dissociation of Pif1 from various length ssDNA oligonucleotides. (B) Translocation rates were determined by using the Kintek Explorer program to globally fit the data for each Pif1 variant to a scheme describing n-step sequential translocation with the possibility of dissociation at each step. Dissociated Pif1 was trapped by the addition of heparin with a final concentration of 2 mg/ml. (C–E) The change in tryptophan fluorescence upon dissociation from ssDNA of varying lengths was measured for: (C) Pif1-WT, (D) Pif1-F723A, and (E) Pif1-T464A.
Figure 3.
Figure 3.
The Phe723 and Thr464 of Pif1 are required for DNA unwinding. (A) Diagram of DNA substrate (41). The substrate contains a fluorescein labeled forked 14 bp duplex (blue) named parental duplex (PD), and a Cy5 labeled 14 bp duplex on the 3′ arm of the fork (red) termed the leading duplex (LD) with a 3T overhang. (B) The substrate (S), intermediates (ILD with the leading duplex unwound and IPD with the parental duplex unwound), and products (PPD, the trapped product of parental duplex unwinding and PLD, the trapped product of leading duplex unwinding) can be resolved and quantified by native PAGE. (C) Representative unwinding assay with Pif1 wildtype and mutants F723A, T464A. (D) Quantification of the products formed from leading/parental duplex region in single-turnover unwinding assays. Values are the average and standard deviation of three independent experiments. The ‘one-way ANOVA’ test was used to calculate p-value compared to that of Pif1-WT. ‘**’ indicates P-value <0.01.
Figure 4.
Figure 4.
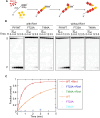
The F723A and T464A variants of Pif1 slide along DNA. (A) Diagram of the experiment. The 14 bp duplex DNA with a 3′-ssDNA tail was incubated with Pif1 (wildtype or variants) without ATP to measure the ATP-independent spontaneous melting under conditions including a DNA-trapping strand. (B) Representative gel images of the substrates (S) and the products (P) from ATP-independent DNA melting experiments. (C) Quantification of the melted DNA products. Values are the average and standard deviation of three independent experiments.
Figure 5.
Figure 5.
Phe723 and Thr464 are required for Pif1 to suppress gross chromosomal rearrangements in vivo. (A) Diagram of the gross chromosomal rearrangement (GCR) assay (47,48). The hxt13::URA3 cassette is located 7.5 kb away from CAN1 on the left arm of the chromosome V. Simultaneous loss of CAN1 and URA3 markers indicates GCR in Chr V-L. (B) Rates of GCR. Data are median and 95% confidence intervals. At least 16 individual cultures were used for each GCR rate determination.
Figure 6.
Figure 6.
Phe723 and Thr464 of Pif1 are required to maintain proper telomere length. Genomic DNA was purified from strains with the indicated genotypes. The DNA was digested with Xho I, separated on 1% agarose gel, transferred to a positively charged nylon membrane, and then subjected to Southern-hybridization by using 32P-labelled scTel-Y-26C probe. Blots show results from three independent cultures per genotype, except pif1-T464A, which is results from two independent cultures. Mode of telomere lengths in replicates of each strain is highlighted (white lines).
Figure 7.
Figure 7.
Pif1-F723A and Pif1-T464A are able to suppress the lethality of dna2Δ. (A) Diagram of the assay. 1 μg of plasmid encoding PIF1 allele (WT or mutant) was transformed into pif1Δ dna2Δ haploid cells. Transformants were selected on SD-Trp plates. Pif1-wildtype is unable to suppress the lethality of dna2Δ, and results in no growth on the selective plates. In contrast, viable colonies growth on the selective plates indicate loss of Pif1 function. (B) Images of selective plates following the transformation with each Pif1 allele.
Figure 8.
Figure 8.
The Pif1-F723A and Pif1-T464A variants are capable of maintaining mitochondrial respiratory growth. (A) Mitochondrial respiratory growth assays. Serial dilutions of cells were plated onto SD-Trp agar plates containing 2% glucose, and SG-Trp agar plates containing 3% glycerol. Plates were then incubated at 28°C for 3 or 5 days. (B) Mitochondrial DNA (mtDNA) copy numbers determined by qPCR. Values are the average and standard deviations from at least three biological replications. The ‘one-way ANOVA’ test was used to calculate P-value compared to that of Pif1-WT. ‘**’ indicates P-value <0.01.
Figure 9.
Figure 9.
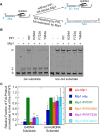
Rim1 does not restore unwinding activity of Pif1-F723A and Pif1-T464A. (A) Diagram of experimental procedures. A 5′-ssDNA tailed 30 bp duplex DNA (substrate, S) was pre-incubated with (or without) Rim1 and Pif1 (wildtype or mutant) proteins. The unwinding reactions were initiated by the addition of ATP. Reactions were conducted under multi-turnover conditions. Substrates (S) and products (P) were separated by native PAGE gel electrophoresis. The asterisk (*) indicates the position of 32P label. (B) Gel images from the unwinding experiments. (C) Quantification of the unwinding products from the multi-turnover unwinding assays. Values are the average and standard deviation of three independent experiments.
Figure 10.
Figure 10.
Pif1 activity assists Mip1 DNA polymerase to synthesize DNA through a G4DNA template. (A) Diagram of the experiment. A 5′-FAM labelled 25 nt primer was annealed to the 3′-ssDNA-tailed G4 DNA template to form the substrate. The substrate was pre-incubated with ATP and dNTPs. The polymerase extension reaction was initiated by the addition of Mip1 in the presence (or absence) of Pif1 (wildtype or mutant) proteins. Reaction products were separated by denaturing polyacrylamide gel electrophoresis with 7M urea. In the absence of Pif1, the Mip1 stalled at the G4DNA site, resulting in only a 4–6 nt extension product. In the presence of Pif1, the G4DNA is resolved, and Mip1 is able to fully extend the primer to the end of the template, resulting in a 72 nt full extension product. (B) Gel images of the polymerase primer-extension reactions. ‘S’ indicates the position of the substrate. Dashed arrows indicate 4–6 nucleotides incorporated into the substrate by Mip1. ‘P’ indicates the 72 nt full extension product. (C) Relative-quantification of the full 72-mer products from the primer-extension assays. Data were normalized to the Pif1 wildtype. Values are the average and standard deviation of three independent experiments. The ‘one-way ANOVA’ test was used to calculate P-value compared to that of Pif1-WT. ‘*’ indicates P-value <0.05, and ‘**’ indicates P-value <0.01.

Similar articles

Cited by

References

    1. Bochman M.L., Sabouri N., Zakian V.A. Unwinding the functions of the Pif1 family helicases. DNA Repair (Amst.). 2010; 9:237–249. - PMC - PubMed
    1. Byrd A.K., Raney K.D. Structure and function of Pif1 helicase. Biochem. Soc. Trans. 2017; 45:1159–1171. - PMC - PubMed
    1. Foury F., Kolodynski J. pif mutation blocks recombination between mitochondrial rho+ and rho- genomes having tandemly arrayed repeat units in Saccharomyces cerevisiae. Proc. Natl. Acad. Sci. U.S.A. 1983; 80:5345–5349. - PMC - PubMed
    1. Schulz V.P., Zakian V.A. The Saccharomyces PIF1 DNA helicase inhibits telomere elongation and de novo telomere formation. Cell. 1994; 76:145–155. - PubMed
    1. Boulé J.B., Vega L.R., Zakian V.A. The yeast Pif1p helicase removes telomerase from telomeric DNA. Nature. 2005; 438:57–61. - PubMed

MeSH terms