. 2024 May;30(5):e14755.
doi: 10.1111/cns.14755.

Transcutaneous vagus nerve stimulation modulates depression-like phenotype induced by high-fat diet via P2X7R/NLRP3/IL-1β in the prefrontal cortex

Affiliations

Transcutaneous vagus nerve stimulation modulates depression-like phenotype induced by high-fat diet via P2X7R/NLRP3/IL-1β in the prefrontal cortex

Shaoyuan Li et al. CNS Neurosci Ther. 2024 May.

Abstract

Background: Depression is a common psychiatric disorder in diabetic patients. Depressive mood associated with obesity/metabolic disorders is related to the inflammatory response caused by long-term consumption of high-fat diets, but its molecular mechanism is unclear. In this study, we investigated whether the antidepressant effect of transcutaneous auricular vagus nerve stimulation (taVNS) in high-fat diet rats works through the P2X7R/NLRP3/IL-1β pathway.

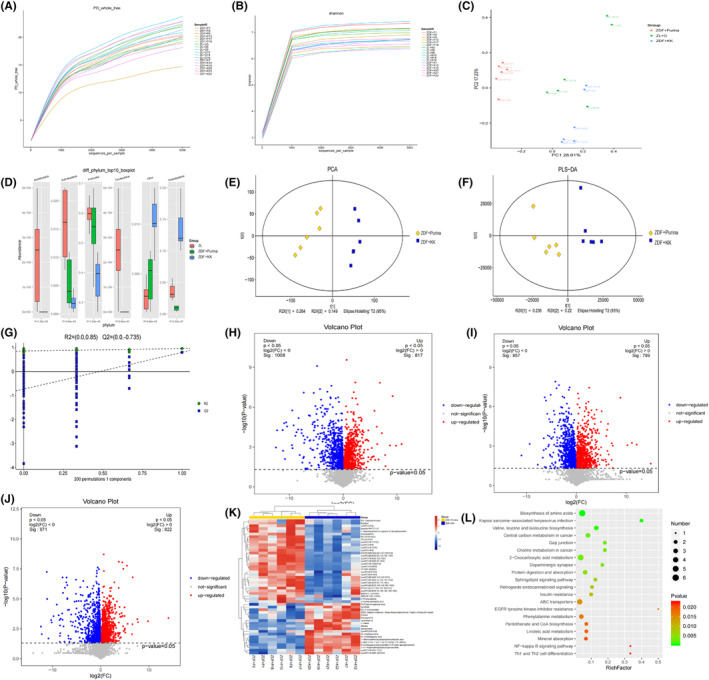
Methods: We first used 16S rRNA gene sequencing analysis and LC-MS metabolomics assays in Zucker diabetic fatty (ZDF) rats with long-term high-fat diet (Purina #5008) induced significant depression-like behaviors. Next, the forced swimming test (FST) and open field test (OFT) were measured to evaluate the antidepressive effect of taVNS. Immunofluorescence and western blotting (WB) were used to measure the microglia state and the expression of P2X7R, NLRP3, and IL-1β in PFC.

Results: Purina#5008 diet induced significant depression-like behaviors in ZDF rats and was closely related to purine and inflammatory metabolites. Consecutive taVNS increased plasma insulin concentration, reduced glycated hemoglobin and glucagon content in ZDF rats, significantly improved the depressive-like phenotype in ZDF rats through reducing the microglia activity, and increased the expression of P2X7R, NLRP3, and IL-1β in the prefrontal cortex (PFC).

Conclusion: The P2X7R/NLRP3/IL-1β signaling pathway may play an important role in the antidepressant-like behavior of taVNS, which provides a promising mechanism for taVNS clinical treatment of diabetes combined with depression.

Keywords: P2X7R/NLRP3/IL‐1β signaling pathway; depression‐like phenotype; high‐fat diet; microglia; transcutaneous auricular vagus nerve stimulation.


Conflict of interest statement

The authors declare that they have no conflicts of interest.

Figures

FIGURE 1
FIGURE 1
Comparison of depressive‐like behaviors in different diet groups. (A) Experimental procedure. ZDF, Zucker diabetes rat. (B and C) Different diets influence the change in body weight and the level of fasting blood glucose in ZDF rats. (D–F) Different diets influence depressive‐like behaviors in different groups. The values are presented as the mean ± SD. One‐way ANOVA with Tukey's post–hoc test was performed for statistical analysis. N = 6 rats for each group. *p < 0.05, **p < 0.01 vs. ZL group, ▲▲ p < 0.01 vs ZDF + Purina group. Statistical analysis of one‐way ANOVA: (B) 0 w, p = 0.4134; 1 w, p = 0.0697; 2 w, p = 0.0371; 3 w, p = 0.0017; 4 w, p = 0.0045; 5 w, p = 0.0006; 6 w, p = 0.0006; 7 w, p = 0.0004; 8 w, p = 0.0003; 9 w, p = 0.0002; 10 w, p = 0.0002; 11 w, p = 0.0002; 12 w, p = 0.0002; 13 w, p = 0.0001. (C) 0 w, p = 0.9432; 1 w, p = 0.0004; 2 w, p = 0.0014; 3 w, p < 0.0001; 4 w, p < 0.0001; 5 w, p < 0.0001; 6 w, p < 0.0001;7 w, p < 0.0001; 8 w, p < 0.0001; 9 w, p < 0.0001; 10 w, p < 0.0001; 11 w, p = 0.0002; 12 w, p < 0.0001; 13 w, p < 0.0001. (D) 0 w, p = 0.9137; 1 w, p = 0.8889; 2 w, p = 0.6117; 3 w, p = 0.4426; 4 w, p = 0.2123; 5 w, p = 0.1904; 6 w, p = 0.0296; 7 w, p = 0.0015; 8 w, p = 0.0014; 9 w, p = 0.0078; 10 w, p = 0.0078; 11 w, p < 0.0001; 12 w, p = 0.0002; 13 w, p < 0.0001. (E) 0 w, p = 0.8283; 1 w, p = 0.1872; 2 w, p = 0.1595; 3 w, p = 0.0149; 4 w, p = 0.0010; 5 w, p < 0.0001; 6 w, p = 0.0079; 7 w, p = 0.2134; 8 w, p = 0.0015; 9 w, p < 0.0001; 10 w, p < 0.0001; 11 w, p < 0.0001; 12 w, p < 0.0001; 13 w, p < 0.0001. (F) 0 w, p = 0.5853; 1 w, p = 0.3982; 2 w, p = 0.4163; 3 w, p = 0.2177; 4 w, p = 0.6605; 5 w, p = 0.0037; 6 w, p = 0.0297; 7 w, p = 0.0015; 8 w, p = 0.0401; 9 w, p = 0.0118; 10 w, p = 0.0029; 11 w, p = 0.0004; 12 w, p < 0.0001; 13 w, p < 0.0001.
FIGURE 2
FIGURE 2
The effect of taVNS on the behavioral experiments and blood glucose‐related indexes of rats at different time points. (A) Experimental procedure. ZDF, Zucker diabetes rat. FBG, fasting blood glucose. taVNS, transcutaneous auricular vagus nerve stimulation. From 0 w to 14 w, FBG, OFT, and FST were measured every 2 weeks. taVNS or sham‐taVNS intervention was carried out every day during 8 w and 14 w; (B) Intervention of taVNS and sham‐taVNS. The skin receptive area of taVNS is in the auricular concha with auricular branch of vagus nerve distribution; (C) Effect of taVNS on the body weight at different time points; (D) Comparison of immobility time of rats at different time points; (E, F) Comparison of horizontal movement and vertical movement scores of rats in open field test at different time points; (G) Effect of taVNS on the fasting blood glucose at different time points; (H–J). Effect of taVNS on the concentration of plasma HbA1c, insulin, and glucagon. The values are presented as the mean ± SD. One‐way ANOVA with Tukey's post hoc test was performed for statistical analysis. N = 6 rats for each group. ## p < 0.01 vs. ZL group, **p < 0.01 vs. ZDF group, ▲▲ p < 0.01 vs. ZDF + taVNS group.
FIGURE 3
FIGURE 3
Correlation analyses between body weight and FST at weeks 6–13 for the ZDF + Purina group and ZDF + KK group.
FIGURE 4
FIGURE 4
Differential metabolites and intestinal microbial population in different groups. (A, B) OTU rarefaction curve and Shannon index curve of samples; (C) PCA of rat intestinal flora; (D) Histogram of species structure analysis at the rat intestinal microflora level. Compared with the ZL group, the relative abundance of the phylum Proteobacteria in ZDF + Purina group increased by 12.48% (p < 0.01), and in the ZDF + KK group decreased by 10.03% (p < 0.01) compared with the ZDF + Purina group. The relative abundance of the Firmicutes phylum in the ZDF + Purina group decreased by 16.59% (p < 0.05) compared with that in the ZL group and in the ZDF + KK group increased by 21.93% (p < 0.01) compared with that in the ZDF + Purina group. The relative abundance of the Bacteroidetes phylum was increased by 4% (p < 0.05) in the ZDF + Purina group compared to the ZL group and decreased by 12.58% (p > 0.05) in the ZDF + KK group compared to ZDF + Purina group; (E) PCA analysis; (F) PLS‐DA analysis; (G) OPLS‐DA analysis; (H–J) Volcanic maps; (K) Hierarchical clustering results of significantly different metabolites; (L) Enrichment analysis diagram of differential metabolite KEGG pathways. N = 6 rats for each group.
FIGURE 5
FIGURE 5
The effect of taVNS on the expression of P2X7R, NLRP3, and IL‐1β in the PFC. The values are presented as the mean ± SD. One‐way ANOVA with Tukey's post hoc test was performed for statistical analysis. N = 6 rats for each group. ## p < 0.01 vs. ZL group, **p < 0.01 vs. ZDF group, ▲▲ p < 0.01 vs. ZDF + taVNS group.
FIGURE 6
FIGURE 6
The effect of taVNS on the expression of P2X7R, NLRP3, and IL‐1β and the number of activated or resting state microglia in the PFC. (A–C) Immunofluorescence staining of PFC sections in each group of rats (P2X7R, NLRP3, and IL‐1β). Compared with the ZL group and ZDF + taVNS group, representative confocal images of the PFC show increased expression of P2X7R, NLRP3, and IL‐1β (green) in the ZDF group and ZDF + sham+taVNS group. The microglia transformed from a ramified morphology (ZL group) to an ameboid form (ZDF group) to a ramified state (ZDF + taVNS group) and the ZDF + sham+taVNS group showed no obvious change compared with the ZDF group. Compared with the ZL group and ZDF + taVNS group, the coexpression between P2X7R, NLRP3, IL‐1β (green), and microglia (red) increased in ZDF group, while the result was reversed in the ZDF + taVNS group, but not in the ZDF + sham + taVNS group. P2X7R (green), Iba‐1 (red), DAPI (blue), Merge (yellow), 40× objective lens, scale bar: 100 μm and 20 μm magnification. The values are presented as the mean ± SD. One‐way ANOVA with Tukey's post hoc test was performed for statistical analysis. ## p < 0.01 vs. ZL group, **p < 0.01 vs. ZDF group, ▲▲ p < 0.01 vs. ZDF + taVNS group. (D) Number of activated or resting state microglia in the PFC. N = 3 rats for each group. # p < 0.05, ## p < 0.01, ### p < 0.001 vs. ZL group, *p < 0.05, ***p < 0.001 vs. ZDF group.

References

    1. Snoek FJ, Bremmer MA, Hermanns N. Constructs of depression and distress in diabetes: time for an appraisal. Lancet Diabetes Endocrinol. 2015;3(6):450‐460. doi:10.1016/S2213-8587(15)00135-7 - DOI - PubMed
    1. Tsai SF, Wu HT, Chen PC, Chen YW, Yu M, Tzeng SF. Stress aggravates high‐fat‐diet‐induced insulin resistance via a mechanism that involves the amygdala and is associated with changes in neuroplasticity. Neuroendocrinology. 2018;107(2):147‐157. doi:10.1159/000491018 - DOI - PubMed
    1. Vagena E, Ryu JK, Baeza‐Raja B, Walsh NM, Syme C, Day JP. A high‐fat diet promotes depression‐like behavior in mice by suppressing hypothalamic PKA signaling. Transl Psychiatry. 2019;9(1):141. doi:10.1038/s41398-019-0470-1 - DOI - PMC - PubMed
    1. Li HQ, Chi S, Dong Q, Yu JT. Pharmacotherapeutic strategies for managing comorbid depression and diabetes. Expert Opin Pharmacother. 2019;20(13):1589‐1599. doi:10.1080/14656566.2019.1622090 - DOI - PubMed
    1. Gill H, Gill B, El‐Halabi S, Chen‐Li D, Lipsitz O, Rosenblat JD. Antidepressant medications and weight change: a narrative review. Obesity (Silver Spring). 2020;28(11):2064‐2072. doi:10.1002/oby.22969 - DOI - PubMed

Publication types

Substances