

Leveraging Serial Low-Dose CT Scans in Radiomics-based Reinforcement Learning to Improve Early Diagnosis of Lung Cancer at Baseline Screening
- PMID: 38752718
- PMCID: PMC11211947
- DOI: 10.1148/ryct.230196
Leveraging Serial Low-Dose CT Scans in Radiomics-based Reinforcement Learning to Improve Early Diagnosis of Lung Cancer at Baseline Screening
Abstract
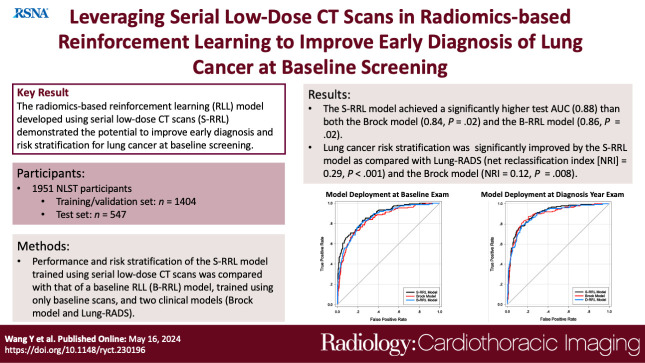
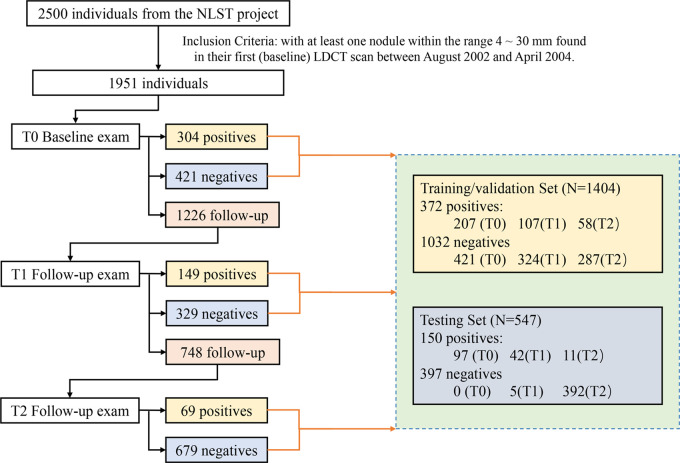
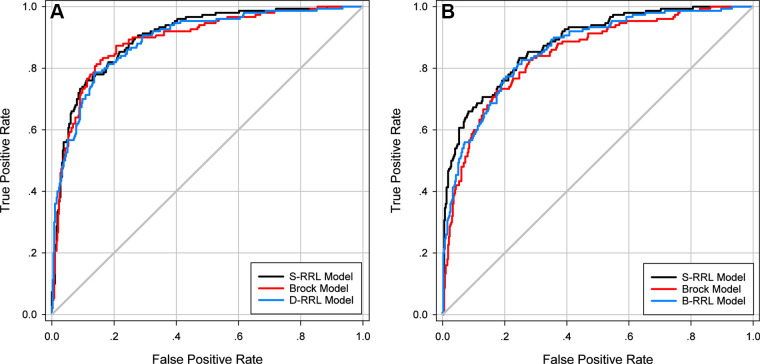
Purpose To evaluate the feasibility of leveraging serial low-dose CT (LDCT) scans to develop a radiomics-based reinforcement learning (RRL) model for improving early diagnosis of lung cancer at baseline screening. Materials and Methods In this retrospective study, 1951 participants (female patients, 822; median age, 61 years [range, 55-74 years]) (male patients, 1129; median age, 62 years [range, 55-74 years]) were randomly selected from the National Lung Screening Trial between August 2002 and April 2004. An RRL model using serial LDCT scans (S-RRL) was trained and validated using data from 1404 participants (372 with lung cancer) containing 2525 available serial LDCT scans up to 3 years. A baseline RRL (B-RRL) model was trained with only LDCT scans acquired at baseline screening for comparison. The 547 held-out individuals (150 with lung cancer) were used as an independent test set for performance evaluation. The area under the receiver operating characteristic curve (AUC) and the net reclassification index (NRI) were used to assess the performances of the models in the classification of screen-detected nodules. Results Deployment to the held-out baseline scans showed that the S-RRL model achieved a significantly higher test AUC (0.88 [95% CI: 0.85, 0.91]) than both the Brock model (AUC, 0.84 [95% CI: 0.81, 0.88]; P = .02) and the B-RRL model (AUC, 0.86 [95% CI: 0.83, 0.90]; P = .02). Lung cancer risk stratification was significantly improved by the S-RRL model as compared with Lung CT Screening Reporting and Data System (NRI, 0.29; P < .001) and the Brock model (NRI, 0.12; P = .008). Conclusion The S-RRL model demonstrated the potential to improve early diagnosis and risk stratification for lung cancer at baseline screening as compared with the B-RRL model and clinical models. Keywords: Radiomics-based Reinforcement Learning, Lung Cancer Screening, Low-Dose CT, Machine Learning © RSNA, 2024 Supplemental material is available for this article.
Keywords: Low-Dose CT; Lung Cancer Screening; Machine Learning; Radiomics-based Reinforcement Learning.
Conflict of interest statement
Figures

Similar articles
-
Lung nodule classification using radiomics model trained on degraded SDCT images.Comput Methods Programs Biomed. 2024 Dec;257:108474. doi: 10.1016/j.cmpb.2024.108474. Epub 2024 Oct 23. Comput Methods Programs Biomed. 2024. PMID: 39481281
-
Predicting Malignant Nodules from Screening CT Scans.J Thorac Oncol. 2016 Dec;11(12):2120-2128. doi: 10.1016/j.jtho.2016.07.002. Epub 2016 Jul 13. J Thorac Oncol. 2016. PMID: 27422797 Free PMC article.
-
Radiomics for Improved Detection of Chronic Obstructive Pulmonary Disease in Low-Dose and Standard-Dose Chest CT Scans.Radiology. 2023 Jun;307(5):e222998. doi: 10.1148/radiol.222998. Radiology. 2023. PMID: 37338355 Free PMC article.
-
Lung cancer screening with low-dose CT in Europe: strength and weakness of diverse independent screening trials.Clin Radiol. 2017 May;72(5):389-400. doi: 10.1016/j.crad.2016.12.021. Epub 2017 Feb 4. Clin Radiol. 2017. PMID: 28168954 Review.
-
The Pivotal Role of Baseline LDCT for Lung Cancer Screening in the Era of Artificial Intelligence.Arch Bronconeumol. 2025 Jun;61(6):359-367. doi: 10.1016/j.arbres.2024.11.001. Epub 2024 Nov 22. Arch Bronconeumol. 2025. PMID: 39643515 Review. English, Spanish.
Cited by
-
Enhancing Early Lung Cancer Diagnosis: Predicting Lung Nodule Progression in Follow-Up Low-Dose CT Scan with Deep Generative Model.Cancers (Basel). 2024 Jun 15;16(12):2229. doi: 10.3390/cancers16122229. Cancers (Basel). 2024. PMID: 38927934 Free PMC article.
-
Integration of Nuclear, Clinical, and Genetic Features for Lung Cancer Subtype Classification and Survival Prediction Based on Machine- and Deep-Learning Models.Diagnostics (Basel). 2025 Mar 28;15(7):872. doi: 10.3390/diagnostics15070872. Diagnostics (Basel). 2025. PMID: 40218222 Free PMC article.
-
Radiology: Cardiothoracic Imaging Highlights 2024.Radiol Cardiothorac Imaging. 2025 Jun;7(3):e250064. doi: 10.1148/ryct.250064. Radiol Cardiothorac Imaging. 2025. PMID: 40471074 Review.
-
Precision Medicine in Lung Cancer Screening: A Paradigm Shift in Early Detection-Precision Screening for Lung Cancer.Diagnostics (Basel). 2025 Jun 19;15(12):1562. doi: 10.3390/diagnostics15121562. Diagnostics (Basel). 2025. PMID: 40564882 Free PMC article. Review.
References
-
- Cancer Stat Facts: Lung and Bronchus Cancer . National Cancer Institute . https://seer.cancer.gov/statfacts/html/lungb.html. Accessed September 2022.
-
- De Koning H , Van Der Aalst C , Ten Haaf K , Oudkerk M . PL02.05 effects of volume CT lung cancer screening: mortality results of the NELSON randomised-controlled population based trial . J Thorac Oncol 2018. ; 13 ( 10 ): S185 .
-
- Venkadesh KV , Setio AAA , Schreuder A , et al. . Deep Learning for Malignancy Risk Estimation of Pulmonary Nodules Detected at Low-Dose Screening CT . Radiology 2021. ; 300 ( 2 ): 438 – 447 . - PubMed
MeSH terms
Grants and funding
LinkOut - more resources
Full Text Sources
Medical
Miscellaneous
