. 2024 Jul;65(7):2165-2178.
doi: 10.1111/epi.17983. Epub 2024 May 16.

Cellular resolution contributions to ictal population signals

Affiliations

Cellular resolution contributions to ictal population signals

Lauren A Lau et al. Epilepsia. 2024 Jul.

Abstract

Objective: The increased amplitude of ictal activity is a common feature of epileptic seizures, but the determinants of this amplitude have not been identified. Clinically, ictal amplitudes are measured electrographically (using, e.g., electroencephalography, electrocorticography, and depth electrodes), but these methods do not enable the assessment of the activity of individual neurons. Population signal may increase from three potential sources: (1) increased synchrony (i.e., more coactive neurons); (2) altered active state, from bursts of action potentials and/or paroxysmal depolarizing shifts in membrane potential; and (3) altered subthreshold state, which includes all lower levels of activity. Here, we quantify the fraction of ictal signal from each source.

Methods: To identify the cellular determinants of the ictal signal, we measured single cell and population electrical activity and neuronal calcium levels via optical imaging of the genetically encoded calcium indicator (GECI) GCaMP. Spontaneous seizure activity was assessed with microendoscopy in an APP/PS1 mouse with focal cortical injury and via widefield imaging in the organotypic hippocampal slice cultures (OHSCs) model of posttraumatic epilepsy. Single cell calcium signals were linked to a range of electrical activities by performing simultaneous GECI-based calcium imaging and whole-cell patch-clamp recordings in spontaneously seizing OHSCs. Neuronal resolution calcium imaging of spontaneous seizures was then used to quantify the cellular contributions to population-level ictal signal.

Results: The seizure onset signal was primarily driven by increased subthreshold activity, consistent with either barrages of excitatory postsynaptic potentials or sustained membrane depolarization. Unsurprisingly, more neurons entered the active state as seizure activity progressed. However, the increasing fraction of active cells was primarily driven by synchronous reactivation and not from continued recruitment of new populations of neurons into the seizure.

Significance: This work provides a critical link between single neuron activity and population measures of seizure activity.

Keywords: calcium imaging; epilepsy; recruitment; seizure onset; subthreshold.


Conflict of interest statement

Conflict of interest disclosure

None of the authors has any conflict of interest to disclose.

Figures

Fig. 1.
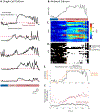
Fig. 1.. Paired calcium imaging and whole-cell patch clamp in vitro.
(A) Left: Image of GCaMP+ neuron and patch pipette in OHSC. Right: Paired current-clamp recording and soma-GCaMP8m calcium signal (Δf/f) during spontaneous seizure. GCaMP signal obtained with 30 Hz, 2-photon imaging. (B) Box and whisker plot of calcium Δf/f amplitudes during different types of electrical activity, normalized to active state detection threshold per cell. (n = 12 neurons, 6 pyramidal cells (filled circles) and 6 interneurons (open circles), from 12 OHSCs. Note: some neurons did not demonstrate all the types of electrical activity). Inset shows amplitude during inter-ictal activity compared to EPSP barrage. Amplitudes vary significantly compared to inter-ictal activity for all activity types (ANOVA p = 0.003, post-hoc paired t test with holm-Bonferroni at α = 0.05). (C) Zoom-in to each category of electrical activity, as noted in A. 1: Inter-ictal activity is defined as period between seizures where EPSPs frequency is below 1 Hz; 2: EPSP barrage, typically seen at seizure onset, with EPSP frequency >1 Hz; 3: Single Action Potential (AP), defined as only AP in a 150 ms window. 4: AP Cluster, defined as multiple (10+) action potentials with <150 ms interval between spikes; 5: Paroxysmal depolarizing shift (PDS), characterized by action potentials on top of a depolarized plateau of 20-50 mV, lasting tens-hundreds of ms.
Fig. 2.
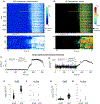
Fig. 2.. Paired calcium imaging and local field potential in vivo and in vitro.
(A) Left: schematic of in vivo imaging. In vivo GCaMP signal obtained with 20 Hz, single photon endoscopy. Right: Representative image of standard deviation projection during syn-GCaMP6f calcium imaging. Scale bar = 100 μm. (B) Left: Schematic of in vitro imaging. In vitro GCaMP signal obtained with 35 Hz, widefield single photon imaging. Right: Representative image of standard deviation projection during syn-GCaMP7f calcium imaging. Scale bar = 100 μm. (C) Raster plot of GCaMP6f Δf/f of individual neurons during in vivo seizure (D) Raster plot of GCaMP7f Δf/f of individual neurons during in vitro seizure (E) Paired mean GCaMP6f Δf/f trace and 3 channels of local field potential (LFP), in vivo. (F) Paired mean GCaMP7f Δf/f trace and LFP, in vitro. (G) Plot of normalized local field potential activity that has been high-pass filtered at 300 Hz for multiunit activity (MUA), rectified and down-sampled to rate of imaging (black) and normalized mean Δf/f calcium (purple), simultaneously recorded during in vivo seizure (H) Correlation in signal between the two modalities, color indicates phase of seizure (blue = baseline inter-ictal; light pink = seizure onset; dark pink = ictal; black = post-ictal). (I) Plot of normalized local field potential activity that has been rectified and down-sampled to rate of imaging (black) and normalized mean Δf/f calcium (purple), simultaneously recorded during in vitro seizure (J) Correlation in signal between the two modalities, color indicates phase of seizure (blue = baseline inter-ictal; light pink = seizure onset; dark pink = ictal; black = post-ictal).
Fig. 3.
Fig. 3.. Changes in network synchrony and calcium amplitude underly population level changes.
(A) Example single cell soma-GCaMP8m calcium traces, obtained from 30 Hz, 2-photon imaging in OHSC . Red line indicates active state detection threshold for each cell. Phase of seizure indicated by colorbar. (B) Top: Mean Δf/f calcium of 20 neurons. (C) Raster plot showing the Δf/f amplitude for each of the 20 neurons. Neurons in (A) correspond to cell #1, 5, 10, 15 and 20 in raster plot. (D) Raster plot depicting when neurons are in the subthreshold (black) or active states (white). Recruitment shown in hatched white/yellow and represents the first time a neuron is in the active state during the seizure epoch. (E) Plot of network synchrony over time (i.e. fraction of network in the active state). Yellow line = cumulative recruitment. (F) Scatter plot of the mean active (red) and subthreshold (black) Ca+2 Δf/f amplitude over time normalized to detection threshold (red dotted line). Number of cells contributing to mean varies over time depending on number of neurons in active versus subthreshold state at each time point.
Fig. 4.
Fig. 4.. Network synchrony and recruitment.
(A) Example plot of fraction of synchronously active neurons (S = # active neurons/total # neurons) over time from seizure in OHSC. (35 Hz, 1-photon imaging of GCaMP7f). Color represents fraction of S that is new recruitment. (B) Beeswarm plot of time-averaged fraction of synchronously active neurons (S) during seizure onset and ictal activity. Colorbar = recruitment/total fraction active. n = 82 seizures from OHSCs. (C) Plot of instantaneous recruitment (black) and cumulative recruitment (yellow), from same seizure as (A). (D) Beeswarm plot of mean rate of recruitment (fraction of total network recruited per second) during onset and ictal periods, n = 82 seizures from OHSCs. (E) Beeswarm plot of cumulative recruitment during onset, ictal and in total (onset + ictal), n = 82 seizures from OHSCs. (F) Example plot of fraction of synchronously active neurons over time from an in vivo seizure. (20 Hz, 1-photon imaging of GCaMP6f). Color represents fraction of S that is new recruitment. (G) Beeswarm plot of time-averaged fraction of synchronously active neurons (S) during seizure onset and ictal activity. Colorbar = recruitment/total fraction active. n = 5 in vivo seizures. (H) Plot of instantaneous recruitment (black) and cumulative recruitment (yellow), from same seizure in (F). (I) Beeswarm plot of mean rate of recruitment (fraction of total network recruited per second) during onset and ictal periods, n = 5 in vivo seizures. (J) Beeswarm plot of cumulative recruitment during onset, ictal and in total, n = 5 in vivo seizures.
Fig. 5.
Fig. 5.. Change in calcium amplitude
(A) Raster plot of Δf/f signal of neurons in the subthreshold state from an example seizure in OHSC. (35 Hz, 1-photon imaging GCaMP7f). White = time points when the neuron was in the active state. Colors on bottom show stages of activity, gray = baseline activity, pink = seizure onset, red = ictal. Bottom: zoom-in to 40 seconds of activity in 10 cells. (B) Raster plot of Δf/f signal of neurons in the active state. Black = time points when the neuron was subthreshold. Bottom: zoom-in to 40 seconds of activity in 10 cells. (C) Example mean baseline normalized subthreshold calcium (STCa+2) amplitude over time of all neurons shown in (A). (D) Example mean baseline normalized active calcium (ActCa+2) amplitude over time of all neurons shown in (B). Data from A-D all show the same seizure recorded from an OHSC. (E) Beeswarm plot of time-averaged mean normalized STCa+2 amplitude during seizure onset and ictal in OHSC. n = 82 seizures. (F) Beeswarm plot of time-averaged mean normalized STCa+2 amplitude during seizure onset and ictal in vivo. n = 5 seizures. (20 Hz, 1-photon imaging of GCaMP6f). (G) Beeswarm plot of time-averaged mean normalized ActCa+2 amplitude during seizure onset and ictal in OHSC. (H) Beeswarm plot of time-averaged mean normalized ActCa+2 amplitude during seizure onset and ictal activity in vivo.
Fig. 6.
Fig. 6.. Quantifying sources of increased population calcium signal during seizure
(A) Plots of the absolute contributions of recruitment, reactivation, change in mean active calcium amplitude (ActCa+2), and mean subthreshold calcium amplitude (STCa+2) in an example seizure recorded from an OHSC. (35 Hz, 1-photon imaging GCaMP7f). (B) 3D line plot of the 4 sources of ictal signal and the total mean Δf/f signal in black from the example seizure in (A). The 4 sources (recruitment (yellow), reactivation (red), changing in ActCa+2 (teal), and change in STCa+2 amplitude(blue)) summate into the population level mean Δf/f signal (black). (C) Pie chart of the mean relative contribution of each source during seizure onset and ictal activity, n = 82 seizures from OHSC. Relative contribution = absolute contribution/total Δf/f signal. (D) Plots of the absolute contributions of recruitment, reactivation, change in mean active calcium amplitude (ActCa+2), and mean subthreshold calcium amplitude (STCa+2) in an example seizure recorded in vivo. (20 Hz, 1-photon imaging GCaMP6f). (E) 3D line plot of the 4 sources of ictal signal and the total mean Δf/f signal in black from the example seizure in (D). The 4 sources (recruitment (yellow), reactivation (red), changing in ActCa+2 (teal), and change in STCa+2 amplitude(blue)) summate into the population level mean Δf/f signal (black). (F) Pie chart of the mean relative contribution of each source during seizure onset and ictal activity, n = 5 in vivo seizures. Relative contribution = absolute contribution/total Δf/f signal.

References

    1. Panzica F, Franceschetti S, Binelli S, Canafoglia L, Granata T, Avanzini G, Spectral properties of EEG fast activity ictal discharges associated with infantile spasms. Clin Neurophysiol 110, 593–603 (1999). - PubMed
    1. Engel J Jr., A practical guide for routine EEG studies in epilepsy. J Clin Neurophysiol 1, 109–142 (1984). - PubMed
    1. Noachtar S, Remi J, The role of EEG in epilepsy: a critical review. Epilepsy & behavior : E&B 15, 22–33 (2009). - PubMed
    1. Jun JJ, Steinmetz NA, Siegle JH, Denman DJ, Bauza M, Barbarits B, Lee AK, Anastassiou CA, Andrei A, Aydin C, Barbic M, Blanche TJ, Bonin V, Couto J, Dutta B, Gratiy SL, Gutnisky DA, Hausser M, Karsh B, Ledochowitsch P, Lopez CM, Mitelut C, Musa S, Okun M, Pachitariu M, Putzeys J, Rich PD, Rossant C, Sun WL, Svoboda K, Carandini M, Harris KD, Koch C, O'Keefe J, Harris TD, Fully integrated silicon probes for high-density recording of neural activity. Nature 551, 232–236 (2017). - PMC - PubMed
    1. Merricks EM, Smith EH, Emerson RG, Bateman LM, McKhann GM, Goodman RR, Sheth SA, Greger B, House PA, Trevelyan AJ, Schevon CA, Neuronal Firing and Waveform Alterations through Ictal Recruitment in Humans. J Neurosci 41, 766–779 (2021). - PMC - PubMed

LinkOut - more resources