. 2025 Mar 8;16(3):188-210.
doi: 10.1093/procel/pwae030.

IL-24 promotes atopic dermatitis-like inflammation through driving MRSA-induced allergic responses

Affiliations

IL-24 promotes atopic dermatitis-like inflammation through driving MRSA-induced allergic responses

Xinmin Qian et al. Protein Cell. .

Abstract

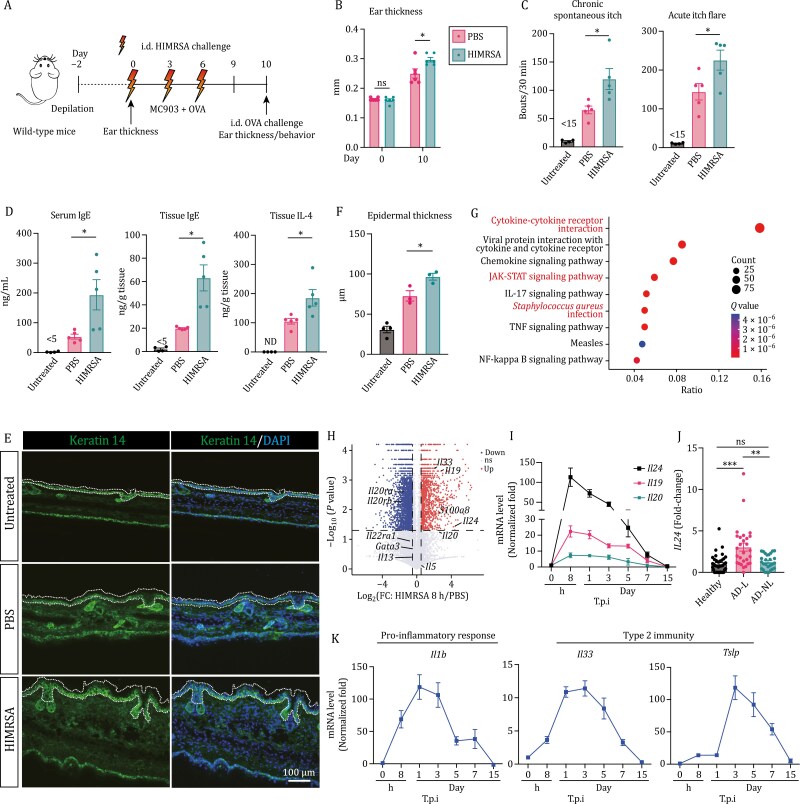
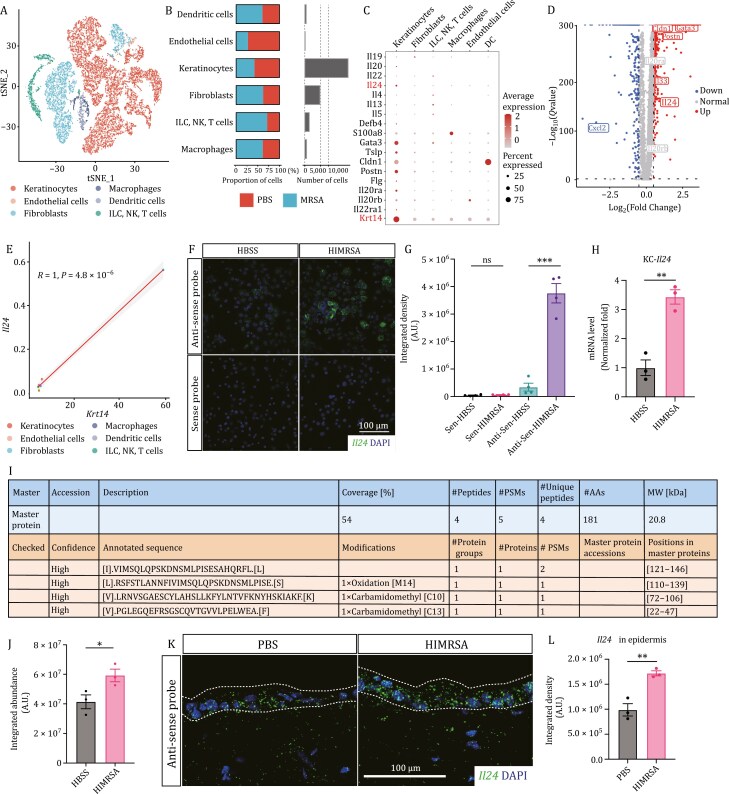
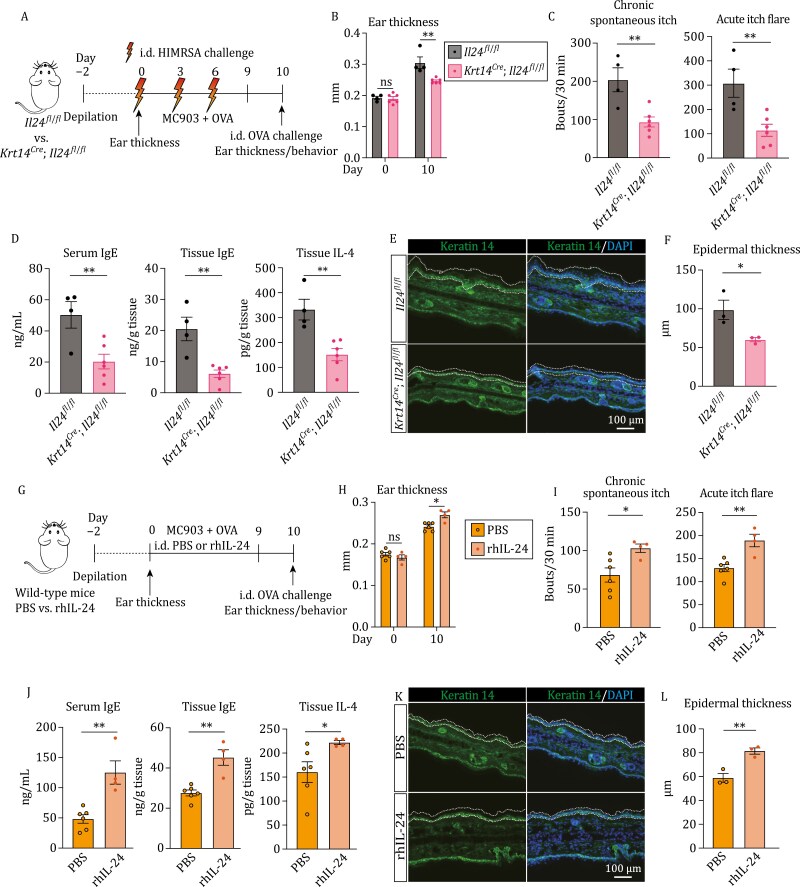
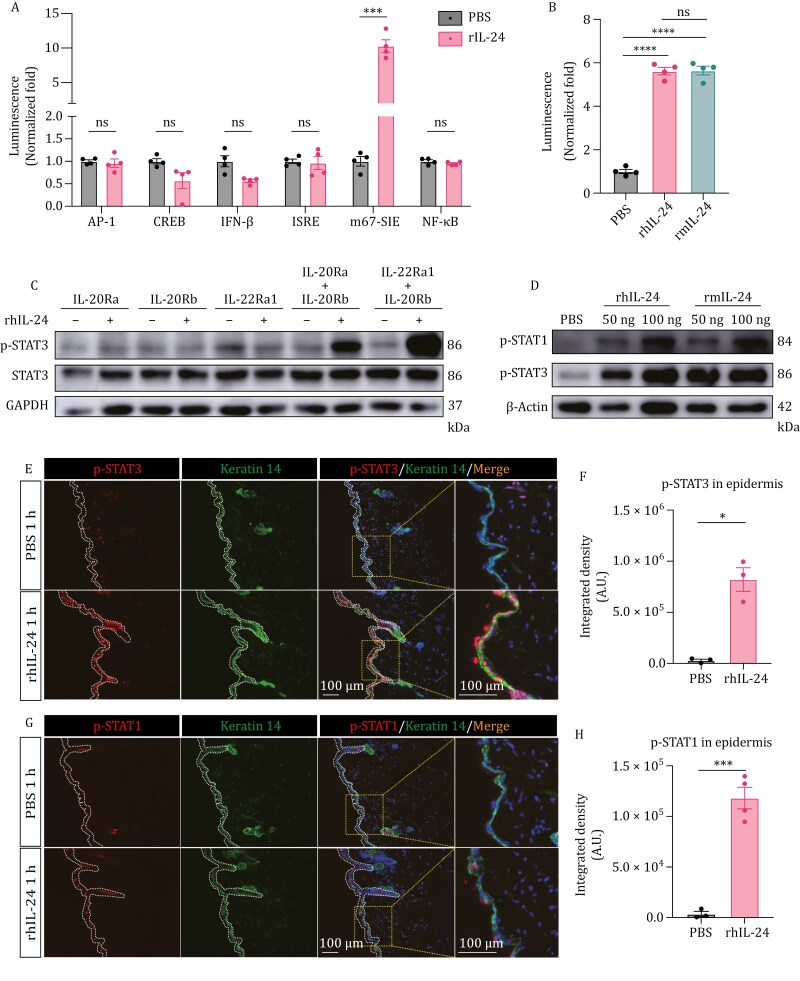
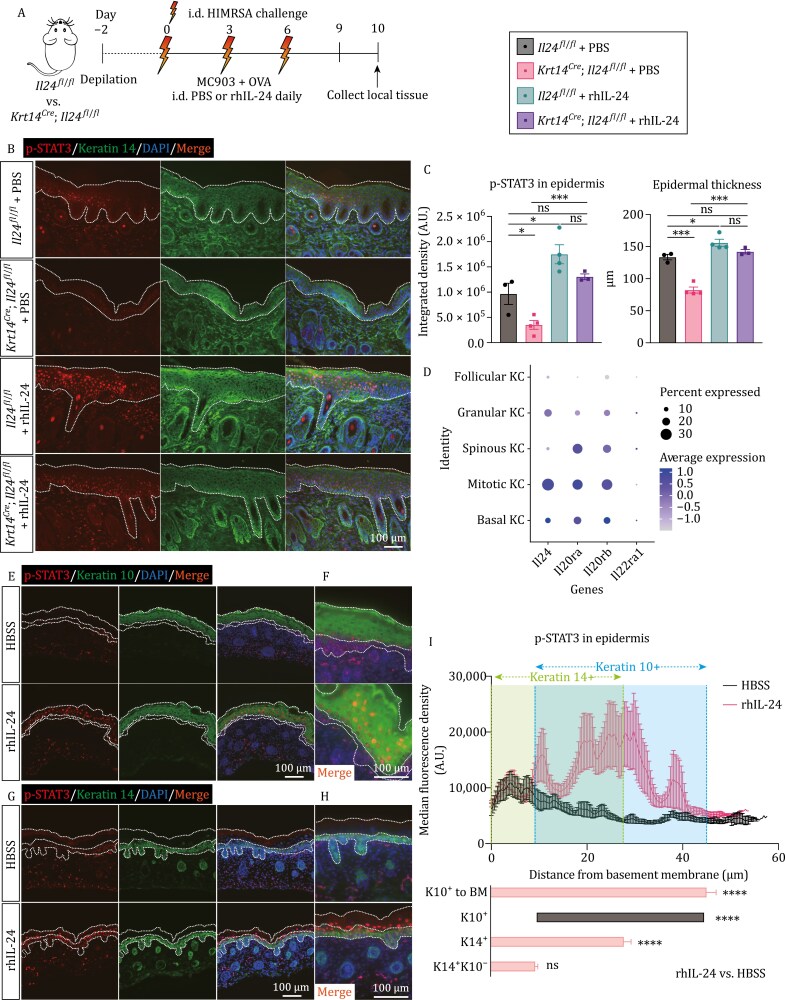
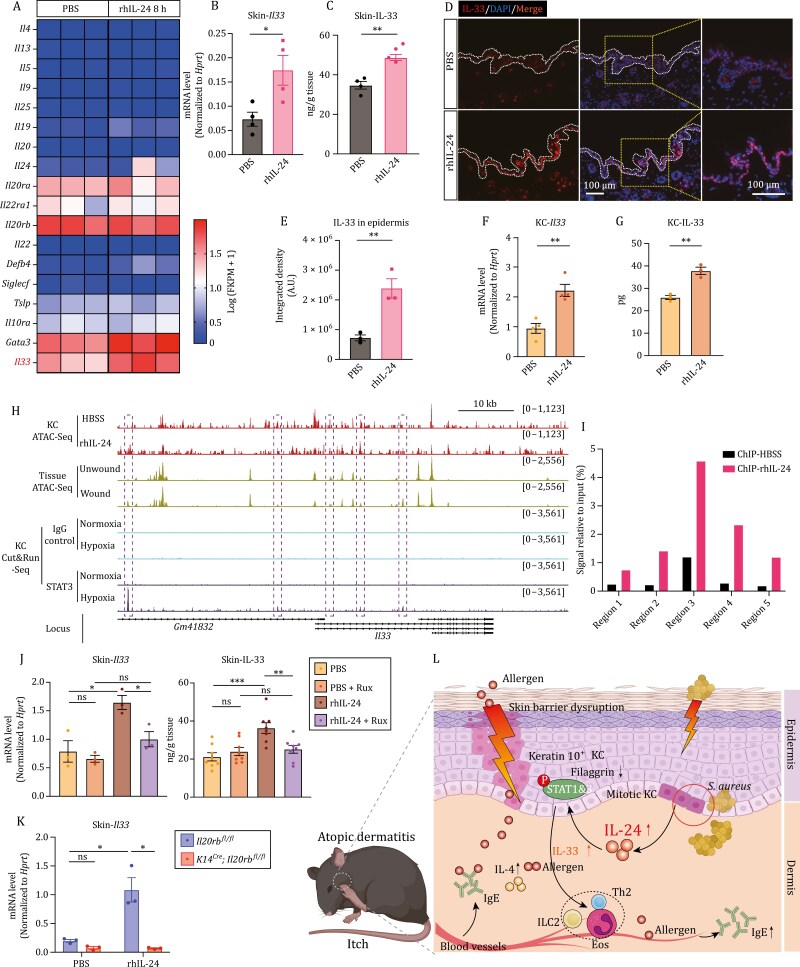
Atopic dermatitis (AD) is a prevalent inflammatory skin disorder in which patients experience recurrent eczematous lesions and intense itching. The colonization of Staphylococcus aureus (S. aureus) is correlated with the severity of the disease, but its role in AD development remains elusive. Using single-cell RNA sequencing, we uncovered that keratinocytes activate a distinct immune response characterized by induction of Il24 when exposed to methicillin-resistant S. aureus (MRSA). Further experiments using animal models showed that the administration of recombinant IL-24 protein worsened AD-like pathology. Genetic ablation of Il24 or the receptor Il20rb in keratinocytes alleviated allergic inflammation and atopic march. Mechanistically, IL-24 acted through its heterodimeric receptors on keratinocytes and augmented the production of IL-33, which in turn aggravated type 2 immunity and AD-like skin conditions. Overall, these findings establish IL-24 as a critical factor for onset and progression of AD and a compelling therapeutic target.

Keywords: IL-24; MRSA; allergic inflammation; atopic dermatitis; keratinocytes.


Conflict of interest statement

Authors declare that they have no competing interests.

Figures

Figure 1.
Figure 1.
Skin HIMRSA application exacerbates AD-like inflammation and induces Il24 expression. (A) Schematic of mouse AD-like disease model induction (MC903 + OVA) and experimental pipeline. Wild-type mice were intradermally (i.d.) challenged with PBS or HIMRSA every three days. (B) Ear thickness changes between Days 0 and 10 postmodel induction. Each data point represents the right ear thickness of one individual mouse. n = 5 mice. *P < 0.05 by unpaired t-test. ns, not significant. (C) Number of scratching bouts in HIMRSA-treated group and vehicle-treated control group before i.d. OVA challenge (chronic spontaneous itch; left) and following i.d. OVA challenge (acute itch flares; right) on Day 10 post model induction. Untreated group shows the basal level of scratching bouts. n = 4–5 mice, mean ± SEM. *P < 0.05 by unpaired t-test. (D) Serum IgE (left), tissue IgE (middle), and tissue IL-4 (right) in HIMRSA-treated group and vehicle-treated control group. Untreated group shows the basal level. n = 4–5 mice, mean ± SEM. *P < 0.05 by unpaired t-test. ND, not detected. (E and F) Representative immunofluorescent images showing the ear of HIMRSA-treated group and vehicle-treated control group. Antikeratin 14 antibody was used to label K14+ keratinocytes. Untreated group shows the basal level. The epidermal thickness was assessed and quantified in (F). n = 3–4 mice, mean ± SEM. *P < 0.05 by unpaired t-test. Dashed lines indicate the border of epidermis. (G) KEGG pathway analysis of DEGs in the skin from AD patients and healthy control in RNA-Seq datasets from the GEO database (GSE121212). (H) Volcano plot displaying the upregulated expression of IL-20 subfamily cytokines during HIMRSA application. Down, downregulation; ns, not significant; Up, upregulation. Dotted horizontal lines and dotted vertical lines represent, respectively, significance (FDR < 0.05) and fold change (log2 FC > |0.5|) thresholds. (I) Transcriptional analysis of the IL-20 subfamily cytokines in MRSA-treated skin of wild-type mice over the course of infection; results were presented by fold normalized to uninfected mice. n = 9–12 mice per time point, mean ± SEM. T.p.i., time post infection. (J) Expression of IL24 in human skin samples analyzed from a publicly available dataset (GEO database, accession No. GSE121212). RNA-Seq analysis was performed in skin samples from 38 healthy controls and in lesional (AD-L) and non-lesional (AD-NL) skin samples from 27 patients with AD. Data were normalized to the gene HPRT. **P < 0.01, ***P < 0.001 by unpaired t-test. ns, not significant. (K) Transcriptional analysis of Il1b, Il33, and Tslp in MRSA-treated skin of wild-type mice over the course of infection; results were presented by fold normalized to uninfected mice. n = 9–12 mice per time point, mean ± SEM. T.p.i., time post infection.
Figure 2.
Figure 2.
Keratinocytes are the main producer of IL-24 upon MRSA infection. (A) t-SNE plot displaying the 6 cell types from mouse skin. Cells were colored by types and annotated to the right. ILC, innate lymphoid cells; NK, natural killer cells. (B) Proportion and numbers of cells from the skin of mice with MRSA and vehicle application. (C) Dot plot showing feature genes related to infection and allergic responses for each cell type. (D) Volcano plot displaying genes that were differentially expressed in keratinocytes versus other cell types. Dotted horizontal lines and dotted vertical lines represent, respectively, significance (FDR < 0.05) and fold change (log2 FC > |0.5|) thresholds. (E) Correlation plots of mRNA levels of Il24 and Krt14 across different cell types. Scatterplots with estimated linear regression and 95% confidence interval; R, Pearson correlation. (F and G) In situ HCR images of primary keratinocytes at 12 h postindicated treatment, probed for Il24 mRNA (antisense) and sense control. Integrated density of Il24 mRNA labeled by green fluorescence was quantified in (G). n = 4, mean ± SEM. ***P < 0.001 by unpaired t-test. ns, not significant. (H) Expression of Il24 in primary keratinocytes at 12 h postindicated treatment. Results were presented by fold normalized to control group. n = 3, mean ± SEM. **P < 0.01 by unpaired t-test. KC, keratinocyte. (I and J) Mass-spectrometry on specific IL-24 peptides from the supernatant of cultured primary keratinocytes at 24 h post indicated treatment. Integrated abundance of specific “IVIMSQLQPSKDNSMLPISESAHQRFLL” peptide was quantified in (J). n = 3, mean ± SEM. *P < 0.05 by unpaired t-test. MW, molecular weight; PSMs, peptide/spectrum matches; AAs, amino acids. (K and L) In situ HCR images of skin sections at 12 h post indicated treatment, probed for Il24 mRNA (antisense). Integrated density of Il24 mRNA labeled by green fluorescence was quantified in (L). n = 3, mean ± SEM. **P < 0.01 by unpaired t-test. Dashed lines indicate the border of epidermis.
Figure 3.
Figure 3.
Keratinocyte-derived IL-24 drives AD-like inflammation. (A) Schematic of mouse AD-like disease model (MC903 + OVA) and experimental pipeline. Il24ffl/fl and Krt14Cre; Il24ffl/fl mice were intradermally (i.d.) challenged with HIMRSA every three days. (B) Ear thickness changes between Days 0 and 10 postmodel induction. Each data point represents the right ear thickness of one individual mouse. n = 4–6 mice. **P < 0.01 by unpaired t-test. ns, not significant. (C) Number of scratching bouts in Il24ffl/fl and Krt14Cre; Il24ffl/fl mice before i.d. OVA challenge (chronic spontaneous itch; left) and following i.d. OVA challenge (acute itch flares; right) on Day 10 post model induction. n = 4–6 mice, mean ± SEM. **P < 0.01 by unpaired t-test. (D) Serum IgE (left), tissue IgE (middle), and tissue IL-4 (bottom) in Il24ffl/fl and Krt14Cre; Il24ffl/fl mice. n = 4–6 mice, mean ± SEM. **P < 0.01 by unpaired t-test. (E and F) Representative immunofluorescent images showing the ear of Il24ffl/fl and Krt14Cre; Il24ffl/fl mice on Day 10 post model induction. Antikeratin 14 antibody was used to label K14+ keratinocytes. The epidermal thickness was assessed and quantified in (F). n = 3 mice, mean ± SEM. *P < 0.05 by unpaired t-test. Dashed lines indicate the border of epidermis. (G) Schematic of mouse AD-like disease model (MC903 + OVA) and experimental pipeline. Wild-type mice were intradermally (i.d.) treated with PBS or rhIL-24 every day. (H) Ear thickness change between Days 0 and 10 post-model induction. Each data point represents the right ear thickness of one individual mouse. n = 4–6 mice. *P < 0.05 by unpaired t-test. ns, not significant. (I) Number of scratching bouts in rhIL-24-treated group and vehicle-treated control group before i.d. OVA challenge (chronic spontaneous itch; left) and following i.d. OVA challenge (acute itch flares; right) on Day 10 post model induction. n = 4–6 mice, mean ± SEM. *P < 0.05, **P < 0.01 by unpaired t-test. (J) Serum IgE (left), tissue IgE (middle), and tissue IL-4 (right) in rhIL-24-treated group and vehicle-treated control group. n = 4–6 mice, mean ± SEM. *P < 0.05, **P < 0.01 by unpaired t-test. (K and L) Representative immunofluorescent images showing the ear of rhIL-24-treated group and vehicle-treated control group. Antikeratin 14 antibody was used to label K14+ keratinocytes. The epidermal thickness was assessed and quantified in (L). n = 3 mice, mean ± SEM. **P < 0.01 by unpaired t-test. Dashed lines indicate the border of epidermis.
Figure 4.
Figure 4.
IL-24 activates JAK-STAT pathway in keratinocytes. (A) Characterization of different signaling pathways determined by luciferase reporter assay in HEK293T cells co-expressing the receptors. AP-1, activator protein-1; CREB, cyclic-AMP response binding protein; IFN-β, interferon-β; ISRE, interferon-stimulated response elements; m67-SIE, m67-sis inducible element; NF-κB, nuclear factor-κB. n = 4, mean ± SEM. ***P < 0.001 by unpaired t-test. ns, not significant. (B) Luciferase reporter assay of m67-SIE responding to rhIL-24 or rmIL-24 stimulation in HEK293T cells co-expressing the receptors. Relative luciferase activities driven by m67-SIE were measured at 12 h post rIL-24 treatment. n = 4, mean ± SEM. ****P < 0.0001 by unpaired t-test. ns, not significant. (C) Immunoblot analysis of HEK293T cells expressing indicated receptors responding to rhIL-24 stimulation. (D) Immunoblot analysis of skin samples from wild-type mice treated with indicated rIL-24 or vehicle-control. (E–H) Representative immunofluorescent images showing the skin of rhIL-24-treated group and vehicle-treated control group for 1 h. Zoomed views on the right indicate the regions outlined by orange dashed rectangles. Quantification was shown in (F and H) indicating the phosphorylation of STAT3 and STAT1, respectively. Antikeratin 14 antibody was used to label K14+ keratinocytes. n = 3–4 mice, mean ± SEM. *P < 0.05, ***P < 0.001 by unpaired t-test. Dashed lines indicate the border of epidermis.
Figure 5.
Figure 5.
IL-24 exacerbates AD-like inflammation by activating JAK-STAT pathway primarily in K10+ keratinocytes. (A) Schematic of mouse AD-like disease model (MC903 + OVA) and experimental pipeline. Il24ffl/fl and Krt14Cre; Il24ffl/fl mice were intradermally (i.d.) treated respectively with PBS or rhIL-24 every day. (B and C) Representative immunofluorescent images showing the p-STAT3 signals from Il24ffl/fl and Krt14Cre; Il24ffl/fl mice with indicated treatment postmodel induction. Quantification of p-STAT3 and epidermal thickness were shown in (C). Antikeratin 14 antibody was used to label K14+ keratinocytes. n = 3–4 mice, mean ± SEM. *P < 0.05, ***P < 0.001 by unpaired t-test. ns, not significant. Dashed lines indicate the border of epidermis. (D) Dot plot showing the expression of Il24 and receptor genes for keratinocyte-subclusters. KC, keratinocyte. (E and F) Representative immunofluorescent images showing the p-STAT3 signals of the skin from postnatal Day 0 (p0) mouse with indicated treatment for 1 h. Zoomed views were shown in (F). Antikeratin 10 antibody was used to label K10+ keratinocytes. Dashed lines indicate the border of epidermis and K10+ keratinocytes. (G and H) Representative immunofluorescent images showing the p-STAT3 signals of the skin from p0 mouse with indicated treatment for 1 h. Zoomed views were shown in (H). Antikeratin 14 antibody was used to label K14+ keratinocytes. Dashed lines indicate the border of epidermis and K14+ keratinocytes. (I) Quantification of p-STAT3 signals in epidermis (upper) across different types of keratinocytes (bottom) after rhIL-24 treatment for 1 h. n = 10, mean ± SEM. ****P < 0.0001 by unpaired t-test. ns, not significant. BM, basement membrane.
Figure 6.
Figure 6.
Keratinocyte-specific Il20rb depletion abrogates IL-24-STAT3 signaling and alleviates AD-like disease conditions. (A and B) Representative immunofluorescent images showing the p-STAT3 signals from Il20rbffl/fl and Krt14Cre; Il20rbffl/fl mice with indicated treatment for 1 h. Quantification of p-STAT3 in the epidermis was shown in (B). n = 3–4 mice, mean ± SEM. *P < 0.05, ***P < 0.001 by unpaired t-test. ns, not significant. Dashed lines indicate the border of epidermis. (C) Ear thickness change between Days 0 and 10 post model induction. Each data point represents the right ear thickness of one individual mouse. n = 4–7 mice. **P < 0.01 by unpaired t-test. ns, not significant. (D) Number of scratching bouts in Il20rbffl/fl and Krt14Cre; Il20rbffl/fl mice on Day 10 postmodel induction. n = 4–7 mice, mean ± SEM. *P < 0.05 by unpaired t-test. (E) Serum IgE (left), tissue IgE (middle), and tissue IL-4 (right) in Il20rbffl/fl and Krt14Cre; Il20rbffl/fl mice. n = 4–7 mice, mean ± SEM. *P < 0.05, **P < 0.01 by unpaired t-test. (F and G) Representative immunofluorescent images showing the ear of Il20rbffl/fl and Krt14Cre; Il20rbffl/fl mice on Day 10 post model induction. Antikeratin 14 antibody was used to label K14+ keratinocytes. The epidermal thickness was assessed and quantified in (I). n = 4–7 mice, mean ± SEM. ****P < 0.0001 by unpaired t-test. Dashed lines indicate the border of the epidermis. (H–J) Representative immunofluorescent images showing the p-STAT3 signals from Il20rbffl/fl and Krt14Cre; Il20rbffl/fl mice postmodel induction. Quantification of p-STAT3 and epidermal thickness were shown in (I and J), respectively. Antikeratin 14 antibody was used to label K14+ keratinocytes. n = 4–7 mice, mean ± SEM. *P < 0.05, **P < 0.01 by unpaired t-test. Dashed lines indicate the border of epidermis.
Figure 7.
Figure 7.
IL-24 enhances IL-33 production and drives type 2 immunity. (A) Heatmap showing the feature genes related to allergic responses in skin samples from rhIL-24-treated mice (8 h) and vehicle-control mice by RNA-Seq analysis. (B) Expression of Il33 in the skin of wild-type mice with indicated treatment for 12 h. Relative expression level was normalized to Hprt. n = 4 mice, mean ± SEM. *P < 0.05 by unpaired t-test. (C) Protein level of IL-33 in the skin tissue of wild-type mice with indicated treatment for 24 h assessed by ELISA. n = 4, mean ± SEM. **P < 0.01 by unpaired t-test. (D and E) Representative immunofluorescent images showing the skin samples from wild-type mice with indicated treatment for 24 h. Quantification of IL-33 was shown in (E). n = 3, mean ± SEM. **P < 0.01 by unpaired t-test. (F) Expression of Il33 in primary keratinocytes with indicated treatment for 12 h. Relative expression level was normalized to Hprt. n = 4, mean ± SEM. **P < 0.01 by unpaired t-test. (G) Protein level of IL-33 in primary keratinocytes and their supernatant with indicated treatment for 24 h assessed by ELISA. n = 3, mean ± SEM. **P < 0.01 by unpaired t-test. (H) Normalized peak tracks at the genomic locus of Il33 identified by ATAC-Seq and Cut&Run-Seq. KC ATAC-Seq was performed on keratinocytes with indicated treatments. Tissue ATAC-Seq and KC Cut&Run-Seq were reanalyzed from a publicly available dataset (NCBI BioProject accession No. PRJNA731164). Dashed boxes indicate the five chromatin regions at the Il33 locus that opened upon rhIL-24 treatment or wounding process (ATAC) and have STAT3 binding peaks (Cut&Run). KC, keratinocyte. (I) Binding of STAT3 to the genomic loci of Il33 in cultured keratinocytes upon rhIL-24 treatment analyzed by ChIP-quantitative real-time PCR (ChIP-qPCR). (J, left) Expression of Il33 in the skin of wild-type mice with indicated treatment for 12 h. Ruxolitinib (Rux) was used to block JAK-STAT signaling. Relative expression level was normalized to Hprt. n = 3 mice, mean ± SEM. *P < 0.05 by unpaired t-test. ns, not significant. (J, right) Protein level of IL-33 in the skin of wild-type mice with indicated treatment for 24 h assessed by ELISA. Ruxolitinib (Rux) was used to block JAK-STAT signaling. n = 8 mice, mean ± SEM. **P < 0.01, ***P < 0.001 by unpaired t-test. ns, not significant. (K) Expression of Il33 in the skin from Il20rbffl/fl and Krt14Cre; Il20rbffl/fl mice with indicated treatment. n = 3 mice, mean ± SEM. *P < 0.05 by unpaired t-test. ns, not significant. (L) Proposed model of IL-24 function in exacerbating AD-like inflammation. KC, keratinocyte.

References

    1. Bieber T. Atopic dermatitis: an expanding therapeutic pipeline for a complex disease. Nat Rev Drug Discov 2022;21:21–40. - PMC - PubMed
    1. Bromberg JF, Wrzeszczynska MH, Devgan G. et al.. Stat3 as an oncogene. Cell 1999;98:295–303. - PubMed
    1. Brunner PM, Suarez-Farinas M, He H. et al.. The atopic dermatitis blood signature is characterized by increases in inflammatory and cardiovascular risk proteins. Sci Rep 2017;7:8707. - PMC - PubMed
    1. Byrd AL, Deming C, Cassidy SKB. et al.. Staphylococcus aureus and Staphylococcus epidermidis strain diversity underlying pediatric atopic dermatitis. Sci Transl Med 2017;9:1. - PMC - PubMed
    1. Byrd AL, Belkaid Y, Segre JA.. The human skin microbiome. Nat Rev Microbiol 2018;16:143–155. - PubMed

MeSH terms