. 2024 Jul 3;16(7):evae110.
doi: 10.1093/gbe/evae110.

Diverse Gene Regulatory Mechanisms Alter Rattlesnake Venom Gene Expression at Fine Evolutionary Scales

Affiliations

Diverse Gene Regulatory Mechanisms Alter Rattlesnake Venom Gene Expression at Fine Evolutionary Scales

Siddharth S Gopalan et al. Genome Biol Evol. .

Abstract

Understanding and predicting the relationships between genotype and phenotype is often challenging, largely due to the complex nature of eukaryotic gene regulation. A step towards this goal is to map how phenotypic diversity evolves through genomic changes that modify gene regulatory interactions. Using the Prairie Rattlesnake (Crotalus viridis) and related species, we integrate mRNA-seq, proteomic, ATAC-seq and whole-genome resequencing data to understand how specific evolutionary modifications to gene regulatory network components produce differences in venom gene expression. Through comparisons within and between species, we find a remarkably high degree of gene expression and regulatory network variation across even a shallow level of evolutionary divergence. We use these data to test hypotheses about the roles of specific trans-factors and cis-regulatory elements, how these roles may vary across venom genes and gene families, and how variation in regulatory systems drive diversity in venom phenotypes. Our results illustrate that differences in chromatin and genotype at regulatory elements play major roles in modulating expression. However, we also find that enhancer deletions, differences in transcription factor expression, and variation in activity of the insulator protein CTCF also likely impact venom phenotypes. Our findings provide insight into the diversity and gene-specificity of gene regulatory features and highlight the value of comparative studies to link gene regulatory network variation to phenotypic variation.

Keywords: ATAC-seq; CTCF; chromatin; cis-regulatory element; enhancer; gene regulatory networks.


Figures

Fig. 1.
Fig. 1.
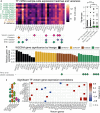
Toxin genes and their derived proteins display high expression variation. a) Venom gene expression for all individuals displayed as a heatmap. Variance, across all samples (across) and within C. viridis (within), in gene expression is shown as two rows above the heatmap, with brighter colors indicating higher variance and darker colors lower. Note that variances have been square root transformed to aid visualization; unscaled variances can be found in supplementary fig. S4, Supplementary Material online. To the right, the boxplot shows expression variance for venom genes and select nonvenom paralogs (a disintegrin and metalloproteinases (ADAMs), phospholipase A2s, beta-defensins and serine proteases; collectively NVPs; full list found in supplementary fig. S3, Supplementary Material online), both across all samples and within C. viridis. The asterisks represent P-values of a 2-sample t-test comparing groups (*** P < 0.01). Only significant comparisons are shown. b) Averaged venom protein abundances for each sampling group are displayed as pie charts. c) Linear correlation between protein and gene abundances. Gene and protein abundances were transformed using centered-log ratio (clr) transformation.
Fig. 2.
Fig. 2.
TF expression varies across lineages, suggesting role of trans-factor expression in venom variation. a) The top 25 TFs sorted by expression variance across all samples. To the right, the boxplot shows VST expression variances for all venom-associated TFs (from Perry et al. 2022; N = 161) and TFs not associated with venom, both within C. viridis and across all samples. The asterisks represent P-values of a 2-sample t-test comparing groups (***P < 0.01). b) WGCNA gene significance for TFs within the co-expression module that is most significant for each lineage variable. The functional annotations below 2a were taken from Perry et al. (2022) for pioneer TFs, UPR and ERK related TFs, and Westfall et al. (2023) for venom regulons. c) The matrix of Pearson's correlation coefficients between expression of candidate TFs and venom genes are displayed only for significant correlations. Pearson's rho scalebar on the right represents positive negative correlations. An uncolored box represents not significant (n.s.) correlations. Functional annotations come from Perry et al. (2022) and Westfall et al. (2023).
Fig. 3.
Fig. 3.
Abundant chromatin accessibility, TF binding and standing nucleotide variation exist in venom CREs. a) PCAs of venom gene mRNA expression and ATAC-seq peak scores at venom cis-elements (promoters and enhancers of venom genes) demonstrate variance partitioning across populations and species, corresponding to the two main PC axes. The dashed line encircles C. viridis samples. b) Chromatin accessibility and peak accessibility variation for enhancers and promoters. The variance sorted accessibility and footprint scores across venom gene families are shown below. c) Nucleotide diversity (π) for venom enhancers and promoters. d) Frequency of variable TFBSs within enhancers and promoters across samples. This is interpreted in a similar manner to a site frequency spectrum, where each bar represents the fraction of TFBSs that are shared by that many individuals. Asterisks above boxplots indicate statistical significance for parametric 2-sample t-tests: *P < 0.05; ***P < 0.001.
Fig. 4.
Fig. 4.
Linking toxin gene expression and regulatory variation. Results of the linear modeling on a gene-by-gene basis. Absolute values of regression coefficients and log-transformed P-values from multiple linear regression are shown as point size and point color respectively. Absolute values were used to assess only the effect size of the inputs. The color scale shifts from gray to red at the point of significance (P < 0.05). Points where the correlation is significant are also outlined in black. Sample-wide average gene expression and gene expression variance are shown as colored bars below, where brighter colors indicate higher values.
Fig. 5.
Fig. 5.
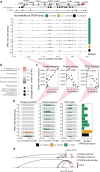
Nucleotide variation causes TF occupancy differences at enhancer, driving SVMP6 expression variation. a) The SVMP gene array and enhancers redrawn from Perry et al. (2022). Venom gland ATAC-seq for C. viridis and non-C. viridis individuals are shown as read pileup tracks. Variance in ATAC-seq density is shown as the bottom-most track. b) Results of multiple linear modeling for SVMP6 redrawn from Fig. 4. The significant feature is circled in black. c) TF binding frequency at the SVMP6 enhancer is shown, with SVMP6 expression displayed as a histogram at the top. GATA4 and GATA6 are highlighted with different colors. The expression is shown as DESeq2-normalized counts in thousands. d) The SNP and indel variants that modify the TF occupancy at TFBS sequences is shown for TFBS sequences in the SVMP6 enhancer. Below this, TFBS motifs which are affected by the SNP and indel variants are drawn onto the sequence, as well as the genotypes of C. viridis and non-C. viridis individuals. The direction of each motif is indicated by the arrow, and individual colors represent separate TFBSs.
Fig. 6.
Fig. 6.
De-novo and CTCF-bound loci explain SVSP9 expression. a) The SVSP gene array and its predicted enhancers (redrawn from Perry et al. 2022), with CTCF binding inferred from ChIP-seq (Perry et al. 2022) shown below. The locus with accessibility that was significantly correlated with SVSP9 expression is circled. Venom gland ATAC-seq for C. viridis and non-C. viridis individuals are shown as read pileup tracks. Variance in read density is shown as the bottom-most track. b) Results of linear modeling for SVSP9, redrawn from Fig. 4b. The significant features are outlined with a black circle. c) Linear regressions between chromatin accessibility at the three loci of interest (a putative enhancer, silencer and a CTCF-bound locus) and SVSP9 gene expression. All linear models are significant at P < 0.05. d) Accessibility landscapes at the loci of interest are shown with a SVSP9 gene expression histogram shown at the far right. The light gray rectangles show the location of ATAC-seq peaks called by MACS2. Peaks have been centered and length standardized. e) A proposed model for how SVSP9 gene regulation responds to various input loci, and how this may be inhibited by CTCF binding.

Similar articles

References

    1. Amazonas DR, Portes-Junior JA, Nishiyama-Jr MY, Nicolau CA, Chalkidis HM, Mourão RHV, Grazziotin FG, Rokyta DR, Gibbs HL, Valente RH, et al. Molecular mechanisms underlying intraspecific variation in snake venom. J Proteomics. 2018:181:60–72. 10.1016/j.jprot.2018.03.032. - DOI - PubMed
    1. Barr KA, Rhodes KL, Gilad Y. The relationship between regulatory changes in cis and trans and the evolution of gene expression in humans and chimpanzees. Genome Biol. 2023:24(1):207. 10.1186/s13059-023-03019-3. - DOI - PMC - PubMed
    1. Bentsen M, Goymann P, Schultheis H, Klee K, Petrova A, Wiegandt R, Fust A, Preussner J, Kuenne C, Braun T, et al. ATAC-seq footprinting unravels kinetics of transcription factor binding during zygotic genome activation. Nat Commun. 2020:11(1):4267. 10.1038/s41467-020-18035-1. - DOI - PMC - PubMed
    1. Berthelot C, Villar D, Horvath JE, Odom DT, Flicek P. Complexity and conservation of regulatory landscapes underlie evolutionary resilience of mammalian gene expression. Nat Ecol Evol. 2018:2(1):152–163. 10.1038/s41559-017-0377-2. - DOI - PMC - PubMed
    1. Bolger AM, Lohse M, Usadel B. Trimmomatic: a flexible trimmer for illumina sequence data. Bioinformatics. 2014:30(15):2114–2120. 10.1093/bioinformatics/btu170. - DOI - PMC - PubMed

Substances