. 2024 Jul;229(6):1397-1415.
doi: 10.1007/s00429-024-02806-3. Epub 2024 May 16.

A strong direct link from the layer 3/4 border to layer 6 of cat primary visual cortex

Affiliations

A strong direct link from the layer 3/4 border to layer 6 of cat primary visual cortex

Kevan A C Martin et al. Brain Struct Funct. 2024 Jul.

Abstract

The cat primary visual cortex (V1) is a cortical area for which we have one of the most detailed estimates of the connection 'weights' (expressed as number of synapses) between different neural populations in different layers (Binzegger et al in J Neurosci 24:8441-8453, 2004). Nevertheless, the majority of excitatory input sources to layer 6, the deepest layer in a local translaminar excitatory feedforward loop, was not accounted for by the known neuron types used to generate the quantitative Binzegger diagram. We aimed to fill this gap by using a retrograde tracer that would label neural cell bodies in and outside V1 that directly connect to layer 6 of V1. We found that more than 80% of labeled neurons projecting to layer 6 were within V1 itself. Our data indicate that a substantial fraction of the missing input is provided by a previously unidentified population of layer 3/4 border neurons, laterally distributed and connecting more strongly to layer 6 than the typical superficial layer pyramidal neurons considered by Binzegger et al. (Binzegger et al in J Neurosci 24:8441-8453, 2004). This layer 3/4 to layer 6 connection may be a parallel route to the layer 3 - layer 5 - layer 6 feedforward pathway, be associated with the fast-conducting, movement-related Y pathway and provide convergent input from distant (5-10 degrees) regions of the visual field.

Keywords: Cat; Cortical circuit; Interlaminar connectivity; Striate cortex; Visual system.


Conflict of interest statement

The authors have no relevant financial or non-financial interests to disclose.

Figures

Fig. 1
Fig. 1
Sample injection site. (a) Top-view of cat cortex. The primary visual cortex (V1, area 17, A17) at the back of both hemispheres is marked in gray, running along the lateral and postlateral gyri. G. lat.: lateral gyrus; G. p. lat.: postlateral gyrus; G. s. syl.: suprasylvian gyrus. Image drawn based on Otsuka and Hassler (1962), Abb. 7, Typ I. See also Wilson (1968) for a nice view on the cat gyri and sulci. Scale bar 1 cm (b) Coronal section through left hemisphere at the level indicated by the dashed line in (a). The injection site (Inj.) in layer 6 of A17 is depicted in black. A17: area 17, primary visual cortex. A18: area 18, secondary visual cortex. S. lat.: lateral sulcus. S. s. spl.: suprasplenial sulcus. G. spl.: splenial gyrus. S. spl.: splenial sulcus. Scale bar: 1 mm (c) Close-up of the rectangle in (b) with the injection site (Inj.). Center of an HRP (horseradish peroxidase) injection site reacted with Ni-DAB (nickel-diamidinobenzidine) to give a dark stain. Retrogradely labeled neuron somata appear black. Scale bar: 1 mm (d) Schematic of the injection site and labeled neuron somata with cortical layers 1 to 6 drawn based on Nissl stainings
Fig. 2
Fig. 2
Series of coronal sections. (a) Ipsilateral cortex. Series of every fourth coronal section of the visual cortices of one cat (cat 1), from posterior to anterior starting at the top left. Injection sites are shown as large dark blobs and labeled neuron somata as black dots. Fine lines separate cortical layers and short lines above the cortex indicate area borders. Note the spread of neuron clusters in layers 3, 4 and 5 at the suprasplenial sulcus. A17: area 17, primary visual cortex. A18: area 18, secondary visual cortex. A19: area 19. A21a: area 21a. PMLS: posteromedial lateral suprasylvian area. G. spl.: splenial gyrus. S. spl.: splenial sulcus. S. s. spl.: suprasplenial sulcus. Scale bar: 1 mm (b) Contralateral cortex. Labeled neurons in coronal sections of the contralateral cortex of four cats. Most callosal neurons were in layer 3 of A17 close to the A17/A18 border. Only in one cat (cat 2) were the labeled neurons in contralateral visual cortices outside A17 and A18. A17: area 17, primary visual cortex. A18: area 18, secondary visual cortex. A19: area 19. PMLS: posteromedial lateral suprasylvian area. A21a: area 21a. Scale bar: 1 mm (c) Subcortical nuclei. Labeled neurons in thalamus and claustrum of two cats. The more anterior thalamic nuclei LP and CM only contained labeled neurons in cat 2, which had large injections at the A17/18 border. LGN: lateral geniculate nucleus, primary visual thalamus. A: A lamina of LGN. A1: A1 lamina of LGN. C: C lamina of LGN. MIN: medial interlaminar nucleus of LGN. pul.: pulvinar, secondary visual thalamus. LP: lateral posterior thalamic nucleus. CL: central lateral thalamic nucleus. CM: central medial thalamic nucleus. Scale bars: 1 mm
Fig. 3
Fig. 3
Fraction of labeled neurons (FLN) per brain area. Input weight as percentage of total labeled neurons per brain: Distribution of retrogradely labeled neurons in different brain areas after tracer injections in layer 6 of the left A17. All cats are plotted separately. The last plot shows the average FLN of cats 1–7. Black and gray bars ipsilateral, white bars contralateral to injection site. Gray titles and bars: cat with injections at the A17/18 border. Local input from ipsilateral A17 (and A18) is predominant. Apart from LGN and contralateral A17, all other areas each provide less than 1% of the total input. Insets: Same plot for FLN values below 1%. A17: area 17, primary visual cortex. A18: area 18, secondary visual cortex. A19: area 19. PMLS: posteromedial lateral suprasylvian area. A21: area 21. A20: area 20. LGN: lateral geniculate nucleus, primary visual thalamus. Thal: thalamus, other nuclei. Cl: claustrum. N = 7. Error bars: standard deviation
Fig. 4
Fig. 4
Horizontal spread of labeled neurons in area 17. (a) Projection of labeled neurons in area 17 around the suprasplenial sulcus from 18 (cat 1) and 15 (cat 3) coronal sections, respectively. Schematic of the injection site (black blob) and labeled neuron somata (black dots) with cortical layers 1 to 6 drawn based on Nissl stainings. Scale bar: 1 mm. G. lat.: lateral gyrus. G. spl.: splenial gyrus. S. spl.: splenial sulcus. S. s. spl.: suprasplenial sulcus (b) The most distant neurons of ipsilateral area 17. For the 5 cats with the largest horizontal spread of labeled neurons, the 30 labeled neurons inside area 17 with the largest Euclidean distance to the closest injection site center are plotted as an ‘x’ in their respective cortical layer. A17: area 17, primary visual cortex. L2: layer 2. L3: layer 3. L4: layer 4. L5: layer 5. L6: layer 6. (c) Labeled neurons with large cell bodies in posterior A17 and A18. Left: Very posterior coronal sample section of cat 2 with large labeled pyramidal neurons marked with ‘x’. A17: area 17, primary visual cortex. A18: area 18, secondary visual cortex. G. p. lat.: postlateral gyrus. Scale bar: 1 mm. Right: Top: Close-up of the neurons in the frame on the left. Numbers denote cortical layers. Middle & bottom: Further examples of labeled layer 5 neurons with a large-diameter soma located in A17 within 0.8 mm anterior of the coronal section depicted on the left. Scale bar 200 μm
Fig. 5
Fig. 5
Laminar distribution of neurons in cortical areas. The proportion of labeled neurons in the different layers of each cortical area containing labeled neurons for all cats as well as their average. The framed bars on the left depict cortical areas ipsilateral to and the unframed bars on the right contralateral to the injection site. The areas are sorted from left to right in ascending hierarchical order. Gray title: cats with injections at the A17/18 border. A17: area 17, primary visual cortex. A18: area 18, secondary visual cortex. A19: area 19. A20a: area 20a. A20b: area 20b. A21a: area 21a. PMLS: posteromedial lateral suprasylvian area. N = 10. Error bars: standard deviation
Fig. 6
Fig. 6
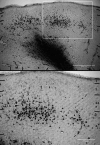
Patchy distribution of retrogradely labeled layer 3/4 cells in area 17. Top: Coronal section through the medial bank of the lateral gyrus (bending towards the top of the gyrus on the left) with Nissl stain. Retrogradely labeled neuronal cell bodies and some blood vessel outlines appear black. Large dark stain at injection site in layer 6. Numbers: cortical layers. Scale bar 500 μm. Bottom: Zoom-in of the white frame in the top image: A cluster of retrogradely labeled neurons at the layer 3/4 border. Neuronal cell bodies and parts of their most proximal dendrites are visible. Scale bar 200 μm
Fig. 7
Fig. 7
Candidate layer 3/4 neurons projecting to layer 6. (a) Canonical layer 3 pyramidal cell with axon branches in layers 3 and 5. (b) Layer 3 pyramidal cell at the layer 3/4 border with additional axon branches running for more than 1 mm in layer 6. (c) Layer 4 spiny stellate cell with many axon branches in layer 6. (d) Layer 4 spiny stellate cell with a large axon cluster in layer 6 and long horizontal branches in layers 4, 5 and 6
Fig. 8
Fig. 8
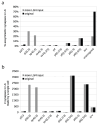
Adding the layer 3/4-to-layer 6 input into the Binzegger diagram. (a) Comparison of the percentage of total asymmetric synapses in layer 6 of the Binzegger diagram (labeled ‘original’) with the hypothetical case where the inputs come from the new cell types identified in the present study. The layer 3 pyramids p3(L6) are assumed to provide 30.0% and the layer 4 type sp4(L6) 21.7% of asymmetric synapses in layer 6. These new inputs would leave only 19.2% unassigned synapses (based on our FLN of 81% for area 17), compared to 70% unassigned in the Binzegger diagram. (b) Total number of synapses that a single cell of each given cell type makes in layer 6. Each ‘standard’ excitatory cell of layers 3 and 4 in the Binzegger diagram (labeled ‘original’) made on average 78 (p2/3) and 85 (mean of ss4(L2/3), ss4(L4) and p4) synapses in layer 6. In the hypothetical case given in (a), p3(L6) cells would each form 2329 synapses in layer 6 and sp4(L6) cells would each form 2115 synapses in layer 6
Fig. 9
Fig. 9
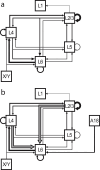
Schematic of the excitatory interlaminar connections of cat V1. (a) Modified from the original diagram. Thicker arrows indicate higher weight connections. (b) Updated diagram: Gray arrows with black outlines mark connections that are stronger according to our tracing experiments than previously estimated in the Binzegger diagram. L1–6: Layers 1–6. X/Y: thalamic input from the lateral geniculate nucleus (LGN). A18: area 18. adapted from Binzegger et al. (2004), Fig. 12A

Similar articles

References

    1. Abbott LF, Bock DD, Callaway EM, et al. The mind of a mouse. Cell. 2020;182:1372–1376. doi: 10.1016/j.cell.2020.08.010. - DOI - PubMed
    1. Anderson JC, Martin KAC. Chap. 6 - interareal connections of the Macaque cortex: how Neocortex talks to itself. In: Rockland KS, editor. Axons and Brain Architecture. San Diego: Academic; 2016. pp. 117–134.
    1. Anderson PA, Olavarria J, Sluyters RV. The overall pattern of ocular dominance bands in cat visual cortex. J Neurosci. 1988;8:2183–2200. doi: 10.1523/JNEUROSCI.08-06-02183.1988. - DOI - PMC - PubMed
    1. Anderson JC, Martin KAC, Whitteridge D. Form, function, and Intracortical Projections of Neurons in the Striate cortex of the Monkey Macacus Nemestrinus. Cereb Cortex. 1993;3:412–420. doi: 10.1093/cercor/3.5.412. - DOI - PubMed
    1. Anderson JC, Douglas RJ, Martin KAC, Nelson JC. Synaptic output of physiologically identified spiny stellate neurons in cat visual cortex. J Comp Neurol. 1994;341:16–24. doi: 10.1002/cne.903410103. - DOI - PubMed

LinkOut - more resources