. 2024 Aug;23(4):1411-1429.
doi: 10.1007/s10237-024-01847-1. Epub 2024 May 16.

A reduced order model formulation for left atrium flow: an atrial fibrillation case

Affiliations

A reduced order model formulation for left atrium flow: an atrial fibrillation case

Caterina Balzotti et al. Biomech Model Mechanobiol. 2024 Aug.

Abstract

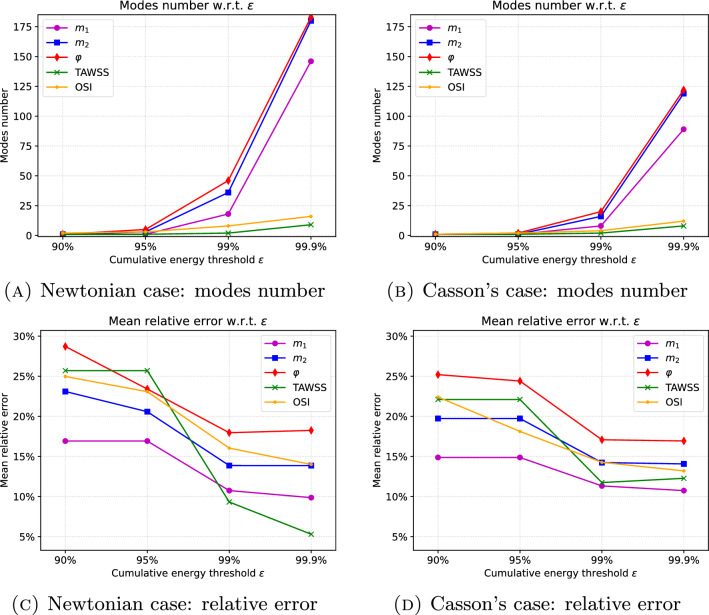
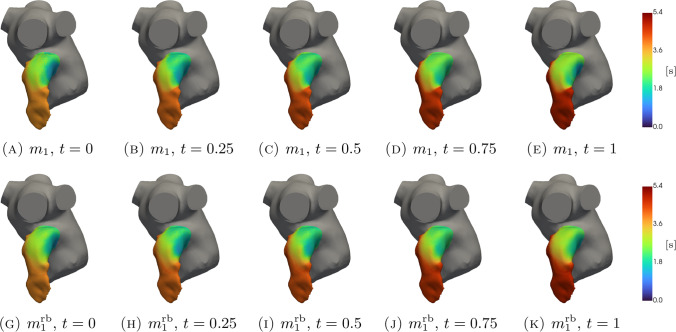
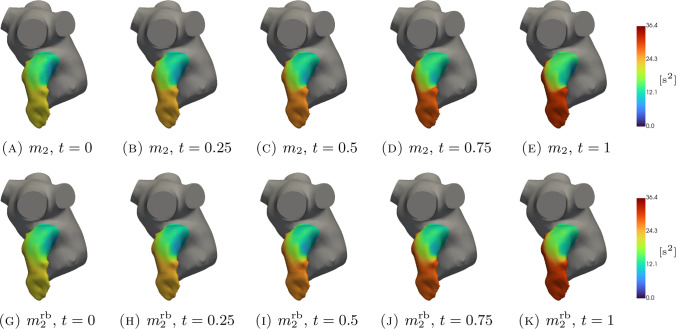
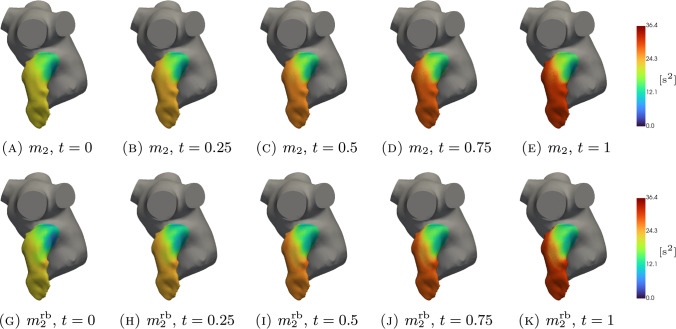
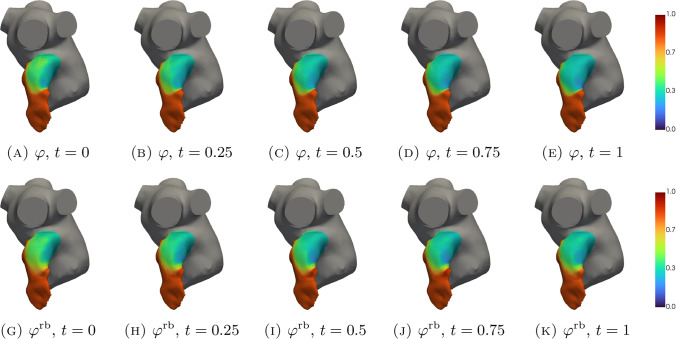
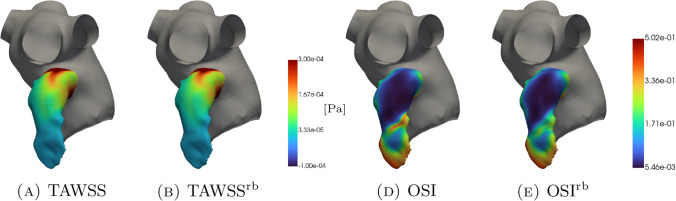
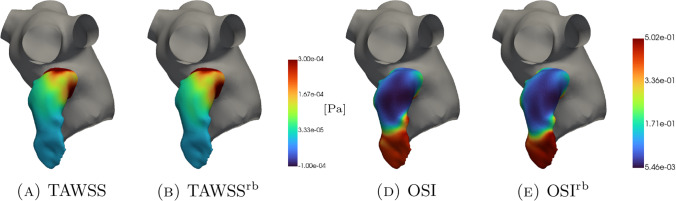
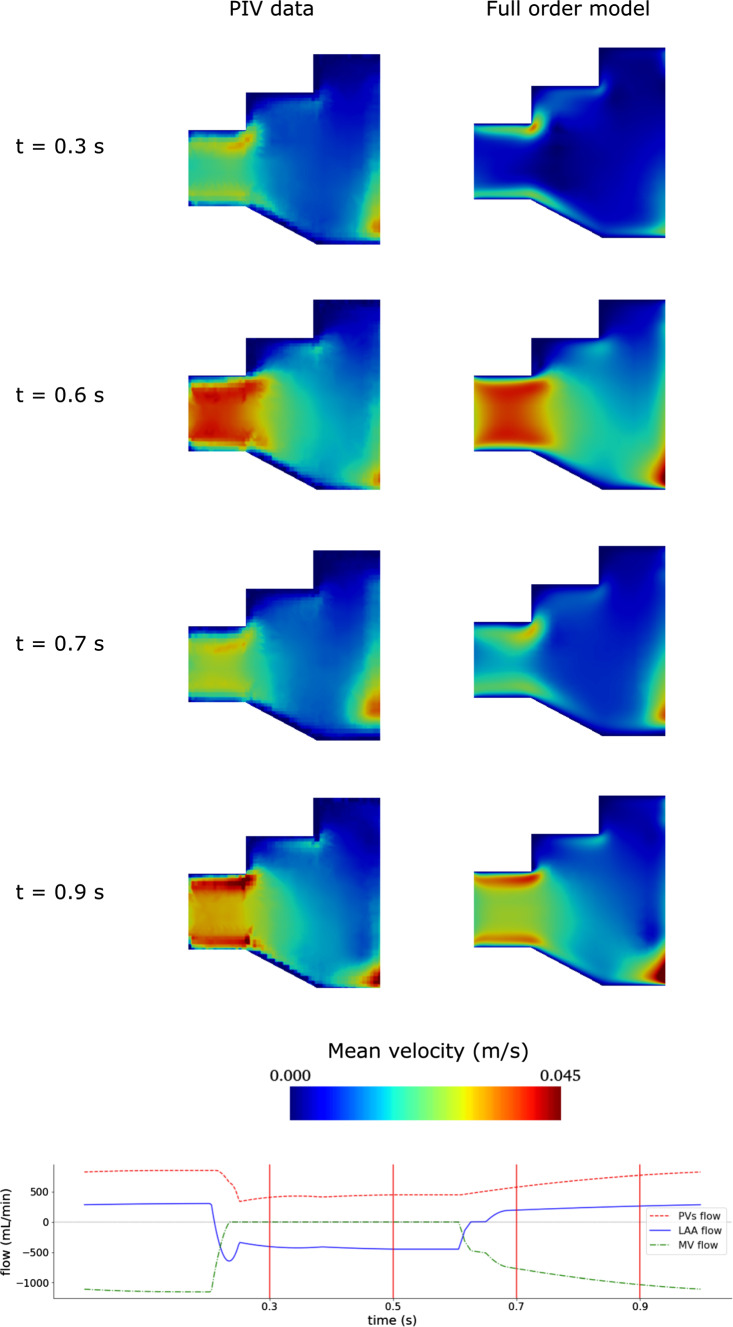
A data-driven reduced order model (ROM) based on a proper orthogonal decomposition-radial basis function (POD-RBF) approach is adopted in this paper for the analysis of blood flow dynamics in a patient-specific case of atrial fibrillation (AF). The full order model (FOM) is represented by incompressible Navier-Stokes equations, discretized with a finite volume (FV) approach. Both the Newtonian and the Casson's constitutive laws are employed. The aim is to build a computational tool able to efficiently and accurately reconstruct the patterns of relevant hemodynamics indices related to the stasis of the blood in a physical parametrization framework including the cardiac output in the Newtonian case and also the plasma viscosity and the hematocrit in the non-Newtonian one. Many FOM-ROM comparisons are shown to analyze the performance of our approach as regards errors and computational speed-up.

Keywords: Cardiovascular flows; Data-driven models; Hemodynamics; Left atrium; Patient-specific configurations; Reduced order model.


Figures

Fig. 1
Fig. 1
Left: LA patient-specific geometry; the green surfaces are the PV inlets, while the red region is the MV outlet. Right: boundary conditions for MV flow for different scaling factors ranging in [0.5, 1.5] (the dashed line corresponds to 1)
Algorithm 1
Algorithm 1
Description of the main steps of the Offline/Online framework
Fig. 2
Fig. 2
Sketch of the mesh. The red portion corresponds to LAA
Fig. 3
Fig. 3
Variation of the number of modes and of the relative error with respect to the cumulative energy threshold ε for the Newtonian (first column) and non-Newtonian (second column) case for all the variables involved
Fig. 4
Fig. 4
Variation in time of the relative error corresponding to the test parameters values for the Newtonian (first column) and non-Newtonian (second column) case for m1, m2 and φ
Fig. 5
Fig. 5
Newtonian case: qualitative comparison between FOM (top) and ROM (bottom) solutions at different times for m1
Fig. 6
Fig. 6
Casson’s case: qualitative comparison between FOM (top) and ROM (bottom) solutions, different times for m1
Fig. 7
Fig. 7
Newtonian case: qualitative comparison between FOM (top) and ROM (bottom) solutions at different times for m2
Fig. 8
Fig. 8
Casson’s case: qualitative comparison between FOM (top) and ROM (bottom) solutions at different times for m2
Fig. 9
Fig. 9
Newtonian case: qualitative comparison between FOM (top) and ROM (bottom) solutions at different times for φ
Fig. 10
Fig. 10
Casson’s case: qualitative comparison between FOM (top) and ROM (bottom) solutions at different times for φ
Fig. 11
Fig. 11
Newtonian case: qualitative comparison between FOM and ROM solutions for TAWSS (panels A and B) and OSI (panels D and E)
Fig. 12
Fig. 12
Casson’s case: qualitative comparison between FOM and ROM solutions for TAWSS (panels A and B) and OSI (panels D and E)
Fig. 13
Fig. 13
Description of validation experiment taken from Dueñas-Pamplona et al. (2021). A: Isometric view of the in vitro LA with inflows QPV,i, mitral valve outflow QMV and LAA volume highlighted; B: Front view of the in vitro LA; C: Detailed view of the measurement section and plane at the in vitro LAA
Fig. 14
Fig. 14
Comparison of mean velocity field obtained by experimental measurements (PIV, Dueñas-Pamplona et al. (2021)) Vs. OpenFOAM simulation data (top) and boundary conditions (bottom)

References

    1. Al-Saady NM, Obel OA, Camm AJ (1999) Left atrial appendage: Structure, function, and role in thromboembolism. Heart 82(5):547–554 10.1136/hrt.82.5.547 - DOI - PMC - PubMed
    1. Atwell JA, King BB (2001) Proper orthogonal decomposition for reduced basis feedback controllers for parabolic equations. Math Comput Model 33(1–3):1–1910.1016/S0895-7177(00)00225-9 - DOI
    1. Ballarin F, Faggiano E, Ippolito S, Manzoni A, Quarteroni A, Rozza G, Scrofani R (2016) Fast simulations of patient-specific haemodynamics of coronary artery bypass grafts based on a POD-Galerkin method and a vascular shape parametrization. J Comput Phys 315:609–62810.1016/j.jcp.2016.03.065 - DOI
    1. Ballarin F, Faggiano E, Manzoni A, Quarteroni A, Rozza G, Ippolito S, Antona C, Scrofani R (2017) Numerical modeling of hemodynamics scenarios of patient-specific coronary artery bypass grafts. Biomech Model Mechanobiol 16:1373–1399 10.1007/s10237-017-0893-7 - DOI - PubMed
    1. Balzotti C, Siena P, Girfoglio M, Quaini A, Rozza G (2022) A data-driven reduced order method for parametric optimal blood flow control: application to coronary bypass graft. Commun Optim Theory 2022(26):1–19

LinkOut - more resources