. 2024 Sep 4;14(9):1612-1630.
doi: 10.1158/2159-8290.CD-23-1157.

A Functional Survey of the Regulatory Landscape of Estrogen Receptor-Positive Breast Cancer Evolution

Affiliations

A Functional Survey of the Regulatory Landscape of Estrogen Receptor-Positive Breast Cancer Evolution

Iros Barozzi et al. Cancer Discov. .

Abstract

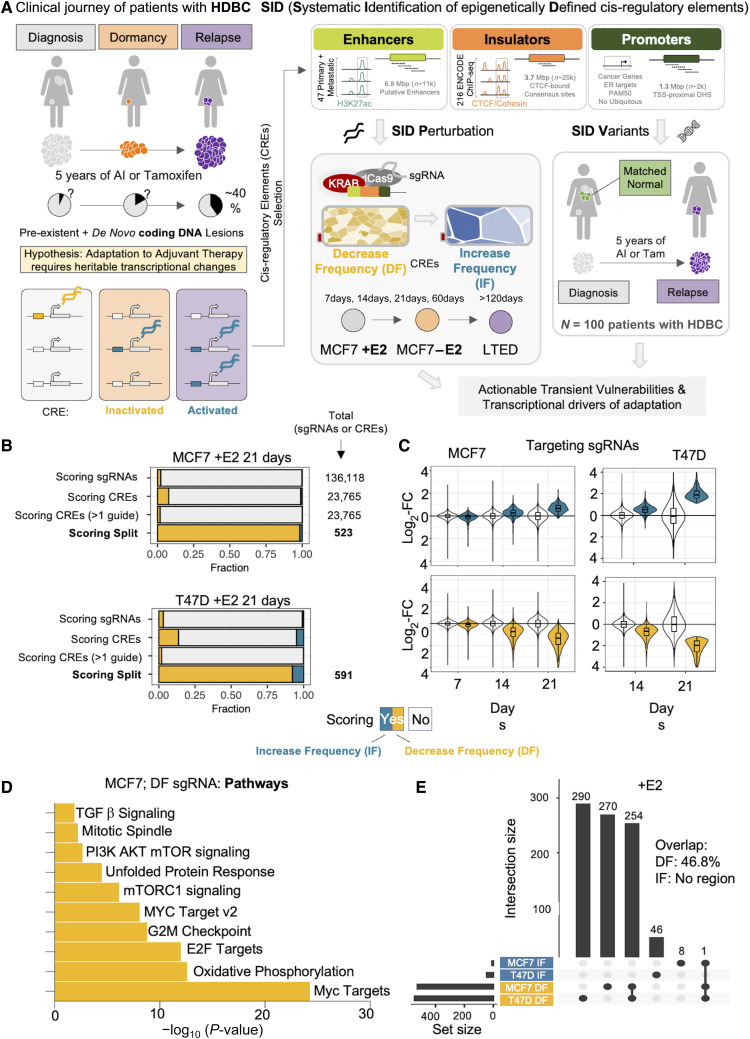
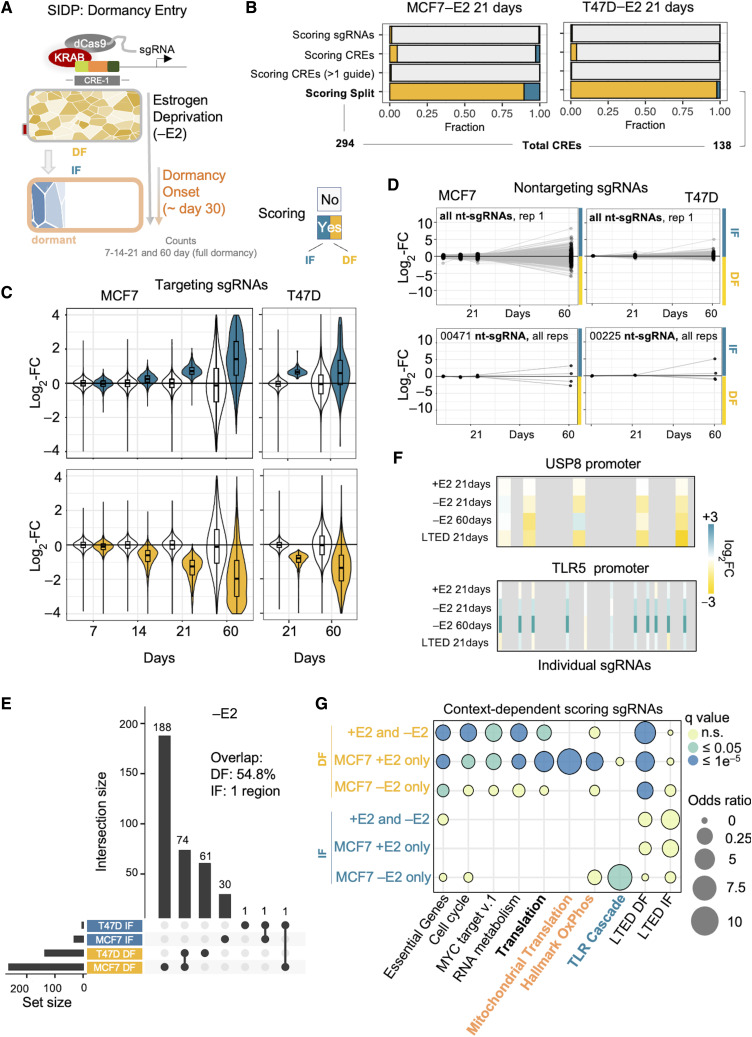
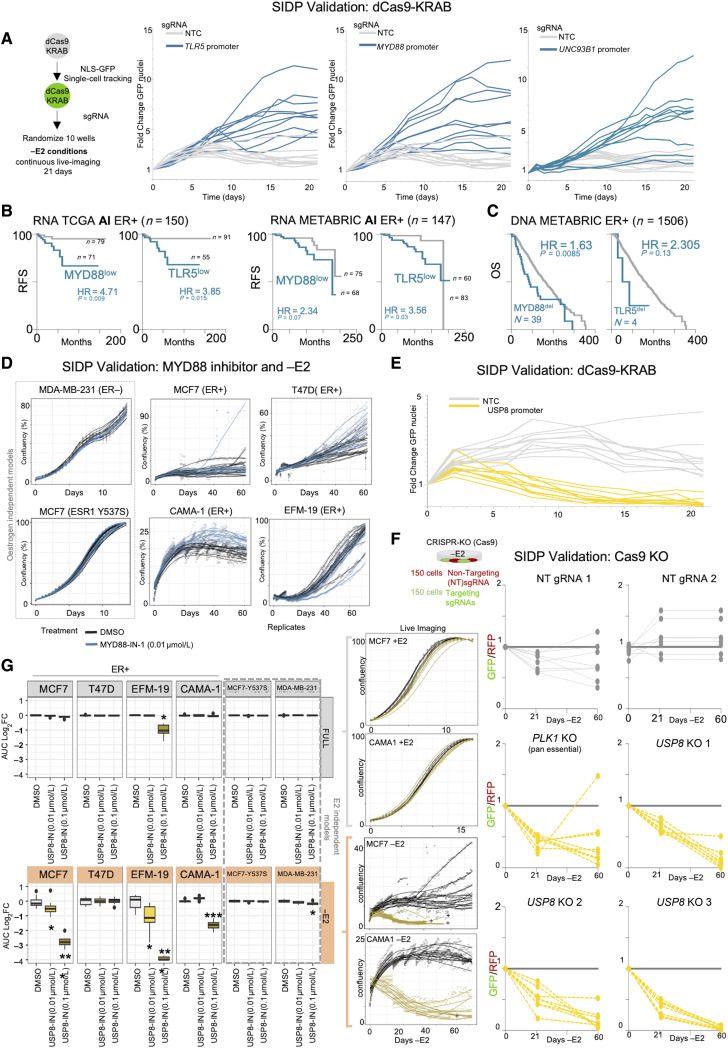
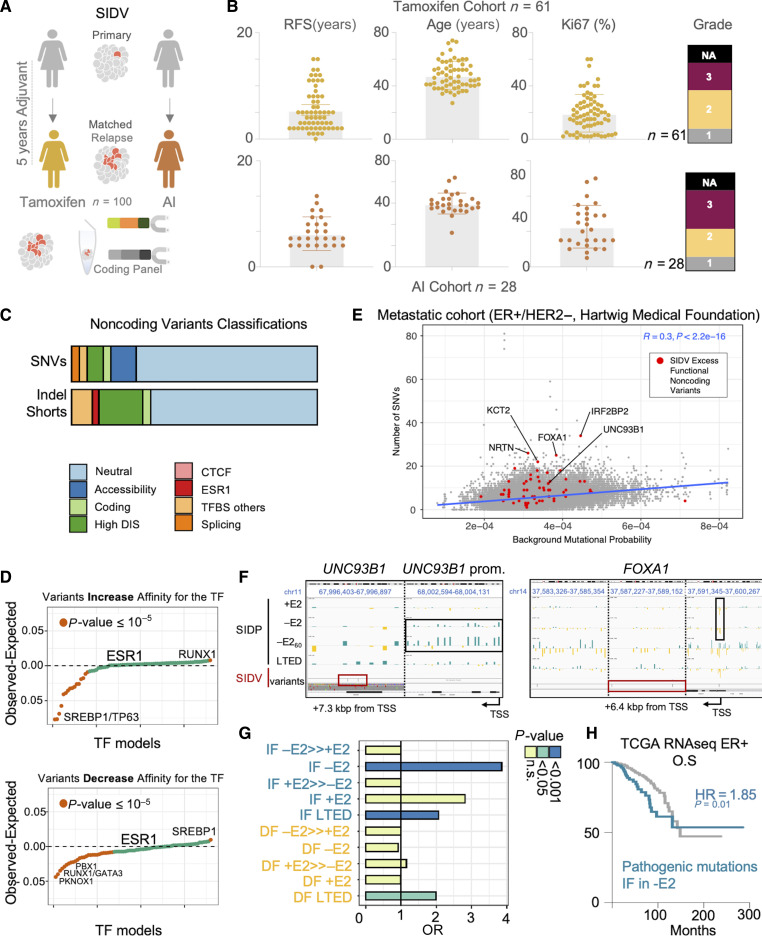
Only a handful of somatic alterations have been linked to endocrine therapy resistance in hormone-dependent breast cancer, potentially explaining ∼40% of relapses. If other mechanisms underlie the evolution of hormone-dependent breast cancer under adjuvant therapy is currently unknown. In this work, we employ functional genomics to dissect the contribution of cis-regulatory elements (CRE) to cancer evolution by focusing on 12 megabases of noncoding DNA, including clonal enhancers, gene promoters, and boundaries of topologically associating domains. Parallel epigenetic perturbation (CRISPRi) in vitro reveals context-dependent roles for many of these CREs, with a specific impact on dormancy entrance and endocrine therapy resistance. Profiling of CRE somatic alterations in a unique, longitudinal cohort of patients treated with endocrine therapies identifies a limited set of noncoding changes potentially involved in therapy resistance. Overall, our data uncover how endocrine therapies trigger the emergence of transient features which could ultimately be exploited to hinder the adaptive process. Significance: This study shows that cells adapting to endocrine therapies undergo changes in the usage or regulatory regions. Dormant cells are less vulnerable to regulatory perturbation but gain transient dependencies which can be exploited to decrease the formation of dormant persisters.


Conflict of interest statement

M.V. Dieci reports personal fees from Eli Lilly, Novartis, Pfizer, Roche, Gilead, Seagen, Daiichi Sankyo, AstraZeneca, MSD, and Exact Sciences outside the submitted work, as well as a patent for EP20382679.7 licensed to Università di Padova. G. Pruneri reports grants from Fondazione AIRC per la Ricerca sul Cancro ETS - Project ID: 26320 PI: G. Pruneri during the conduct of the study, as well as personal fees from Novartis, Illumina, and Eli Lilly and Company outside the submitted work. G.G. Galli reports being an employee and a shareholder of Novartis. No disclosures were reported by the other authors.

Figures

Figure 1.
Figure 1.
Defining a comprehensive strategy to functionally annotate the noncoding genome of HDBC. A, HDBC journey is characterized by distinct phases. Cells must adapt to different niches and treatments. Overcoming these stresses require profound, heritable transcriptional changes. Leveraging in vivo and in vitro data we develop SID, a strategy to prioritize HDBC-specific regulatory regions for functional (SID Perturbation) and genomic (SID Variants) annotation in cell line models and in patient samples. B, Bar plot showing the relative fraction of scoring sgRNAs and CREs bearing scoring sgRNAs, upon perturbation of noncoding genome of estrogen dependent MCF7 cells via SIDP. Scoring sgRNAs showing a significantly decreased frequency at 21 days postinfection are referred to as DF, whereas those with a significantly higher frequency as IF. C, Box plots showing the log2 fold change of both scoring (either blue or yellow) and nonscoring (white) sgRNAs at 21 days postinfection in estrogen-dependent MCF7 cells, at 7, 14, and 21 days, as compared with the initial library. D, Bar plot showing the top 10 hallmark gene sets enriched among the genes found in the proximity of the CREs with scoring sgRNAs showing a DF pattern at 21 days postinfection (P value estimated via hypergeometric test). E, UpSet plot showing the intersection between the SIDP loci showing two or more concordant significant sgRNAs after 21 days postinfection, in either MCF7 or T47D cells (+E2).
Figure 2.
Figure 2.
Adaptation to treatment exposes hidden roles for the noncoding genome. A, Experimental design. B, Bar plot showing the relative fraction of scoring sgRNAs and CREs bearing these sgRNAs, upon perturbation of the noncoding genome of estrogen deprived MCF7 cells via SIDP. Scoring sgRNAs showing a significantly decreased frequency at 21 days postinfection are referred to as DF, whereas those with a significantly higher frequency as IF. For the total numbers of sgRNAs and CREs, refer to Fig. 1B. C, Box plots showing the log2 fold change of both scoring (either blue or yellow) and nonscoring (white) sgRNAs at 21 days postinfection in estrogen-deprived MCF7 cells, at 7, 14, and 21 days, as compared with the initial library. D, Longitudinal tracking of individual non-targeting sgRNAs in four replicates during dormancy entrance (black dots highlight 7, 14, 21, and 60 days postinfection) support stochastic behavior of cells during dormancy entrance. E, UpSet plot showing the intersection between the SIDP loci showing two or more concordant significant sgRNAs after 21 days postinfection, in either MCF7 or T47D cells (−E2). F, Summary of the results for the sgRNAs targeting critical CREs of the USP8 and TLR5 genes. G, Bubble plot highlighting the enrichment of distinct biological functions, when considering sets of genes near CREs showing context-specific responses to perturbation.
Figure 3.
Figure 3.
Targeted CRE perturbations facilitate or disturb the adaptive processes. A, Overview of the experimental design. A, Cell growth dynamics of MCF7 cells under estrogen deprivation (−E2) were monitored by tracking the total number of GFP-positive nuclei with continuous live imaging over the course of 21 days. Cells carrying sgRNA for MYD88, TLR5, and UNC93B1 have a significant higher chance of avoiding therapy induced dormancy B and C, Retrospective patient stratification based on RNA expression (B) or CNVs (C) for MYD88 and TLR5. Log-rank P values calculated with a Mantel–Cox test. D, Cell growth dynamics for a panel of estrogen dependent (MCF7, T47D, CAMA1, and EFM-19) and estrogen independent (MDA-MB231 and MCF7 Y537S) breast cancer cell lines under estrogen deprivation (−E2) were monitored with continuous live imaging over the course of 60 days in presence of a low dose of MYD88 inhibitor (MyD88-IN-1). Chemical MYD88 perturbation increased the number of dormant persister and in turn the chances of early awakening. The same concentration did not have any significant effect in +E2 condition. E, Same as A but targeting the USP8 gene promoter. Cell growth dynamics of MCF7 cells under estrogen deprivation (−E2) were monitored by tracking the total number of GFP-positive nuclei with continuous live imaging over the course of 21 days. Cells carrying sgRNA for USP8 have a lower chance of adapting to therapy. F, CRISPR-Cas9 knockout of USP8. FACS sorting was used to quantify green (USP8 sgRNAs carrying cells) and red (nontargeting sgRNAs). FACS analyses were carried out at three specific timepoints. G, Cell growth dynamics for a panel of estrogen dependent (MCF7, T47D, CAMA1, and EFM-19) and estrogen independent (MDA-MB231 and MCF7 Y537S) breast cancer cell lines under estrogen deprivation (−E2) were monitored with continuous live imaging over the course of 60 days in presence of low dose of USP8 inhibitor (DUB-IN-2). Area under the curve during the entire length of experiment was compared with the average of the controls to quantify the overall impact of USP8 inhibition. Chemical inhibition of USP8 significantly impact the survival of cells adapting to long term −E2 conditions. *, P < 0.01; **, P < 0.001; ***, P <10−5 (Mann–Whitney test).
Figure 4.
Figure 4.
Noncoding variants contribute to heritable transcriptional changes during tumor progression. A, Schematic showing the rationale and implementation of SIDV. B, Overview of the clinical cohorts and the associated features. C, Pathogenic classification of noncoding variants identified by SIDV. D, Scatterplot summarizing the potential of the profiled SIDV variants to alter transcription factor binding. Each dot represents a TF. TFs are sorted based on their propensity to either increase (top) or decrease (bottom) the affinity to each TF. Values significantly larger than zero indicate a propensity to alter the binding that is higher than expected by chance. Those significantly smaller instead indicate a depletion of variants potentially altering the affinity for a given TF. P values estimated via χ2 test. E, Scatterplot showing the number of SNVs in the SID regions (each dot is a region) across 551 ER-positive, HER2-negative metastatic breast cancer samples, vs. the estimated background mutational rate. Regions showing an excess of functional variants are highlighted in red. The blue line represents a linear fit of the data. F, Integration of SIDV and SIDP identify critical regulators of HDBC biology. SIDP log2 fold changes (for the indicated samples, in black; blue fold changes indicate an increased frequency compared with the control library, yellow ones indicate a decrease; scale is [−3; +3]) and SIDV calls (in dark red) at the indicated loci are shown (IGV genome browser). Dark red and black boxes indicate regions with clusters of mutations or with multiple scoring sgRNAs, respectively. For both loci, different zoomed-in regions are shown, separate by vertical, black, dashed lines (precise coordinates of each region are indicated on top). G, Bar plot showing enrichment of SIDV-identified alterations at sets of regions showing condition-specific patterns upon perturbation (SIDP). P values estimated via χ2 Test. H, Kaplan–Meier plot showing that genes near CREs with an excess of SIDV mutations and overlapping IF sgRNAs upon estrogen deprivation (−E2) are associated with prognostic expression levels (HR = 1.85, P value = 0.01; log-rank Test).

References

    1. Festuccia N, Gonzalez I, Owens N, Navarro P. Mitotic bookmarking in development and stem cells. Development 2017;144:3633–45. - PubMed
    1. He P, Williams BA, Trout D, Marinov GK, Amrhein H, Berghella L, et al. The changing mouse embryo transcriptome at whole tissue and single-cell resolution. Nature 2020;583:760–7. - PMC - PubMed
    1. Magnani L, Eeckhoute J, Lupien M. Pioneer factors: directing transcriptional regulators within the chromatin environment. Trends Genet 2011;27:465–74. - PubMed
    1. Hoadley KA, Yau C, Hinoue T, Wolf DM, Lazar AJ, Drill E, et al. Cell-of-Origin patterns dominate the molecular classification of 10,000 tumors from 33 types of cancer. Cell 2018;173:291–304.e6. - PMC - PubMed
    1. Gaiti F, Chaligne R, Gu H, Brand RM, Kothen-Hill S, Schulman RC, et al. Epigenetic evolution and lineage histories of chronic lymphocytic leukaemia. Nature 2019;569:576–80. - PMC - PubMed

MeSH terms

Substances