

Published Erratum
doi: 10.1182/blood.2024024693.
Silva A, Almeida ARM, Cachucho A, et al. Overexpression of wild-type IL-7Rα promotes T-cell acute lymphoblastic leukemia/lymphoma. Blood. 2021;138(12):1040-1052
- PMID: 38753359
- PMCID: PMC11208294
- DOI: 10.1182/blood.2024024693
Item in Clipboard
Published Erratum
Silva A, Almeida ARM, Cachucho A, et al. Overexpression of wild-type IL-7Rα promotes T-cell acute lymphoblastic leukemia/lymphoma. Blood. 2021;138(12):1040-1052
Blood.
.
No abstract available
Figures

IL-7Rα expression results in progressive thymic hyperplasia and disseminated, fatal T-cell leukemia/lymphoma. (A) Thymus cellularity vs age from wild-type F5 control and F5 TetIL-7RON mice. Numbers indicate slope of line fit and 95% confidence intervals. (B) CD4 vs CD8 expression by thymocytes and splenocytes from TetIL-7RON mice (n = 36). Lymphoma/leukemia present in thymus and spleen, characterized by their expression of CD4 and CD8 into DN, CD8 SP, DP, and CD4 SP. A representative example of each phenotype is shown and the percent incidence of phenotype indicated under the phenotypic label. (C) CD4 vs CD8 expression by thymocytes and splenocytes from TetIL-7RON or control C57Bl6/J mice. Histograms are of Ki67 labeling of thymocytes (top) and splenocytes (bottom) of the indicated subpopulation from either TetIL-7RON or C57Bl6/J control mice. (D) Survival of cohorts of TetIL-7RON (n = 8) vs TetIL-7ROFF (n = 4) and TreIL-7R+ rtTA– Il7r−/− mice (n = 4). Mice were culled when they reached the defined humane end point (see “Methods”). P = .0003. (E) Phenotype in the indicated organs of F5 TetIL-7RON mice identified with clinical signs of disease (tumor), as compared with IL-7RWT F5 control mice (control). Density plots are of CD4 vs CD8 in the thymus, spleen and bone marrow of the indicated conditions. (F) Malignant thymocytes from donor mouse in (E) were transferred into Rag1−/− recipients (n = 8). Four weeks later, thymus, spleen, and bone marrow were analyzed for the presence of donor cells. Shown is pooled data of 2 (D) or 6 (A-B) independent experiments or mean results of 3 (C,E-F) independent experiments.
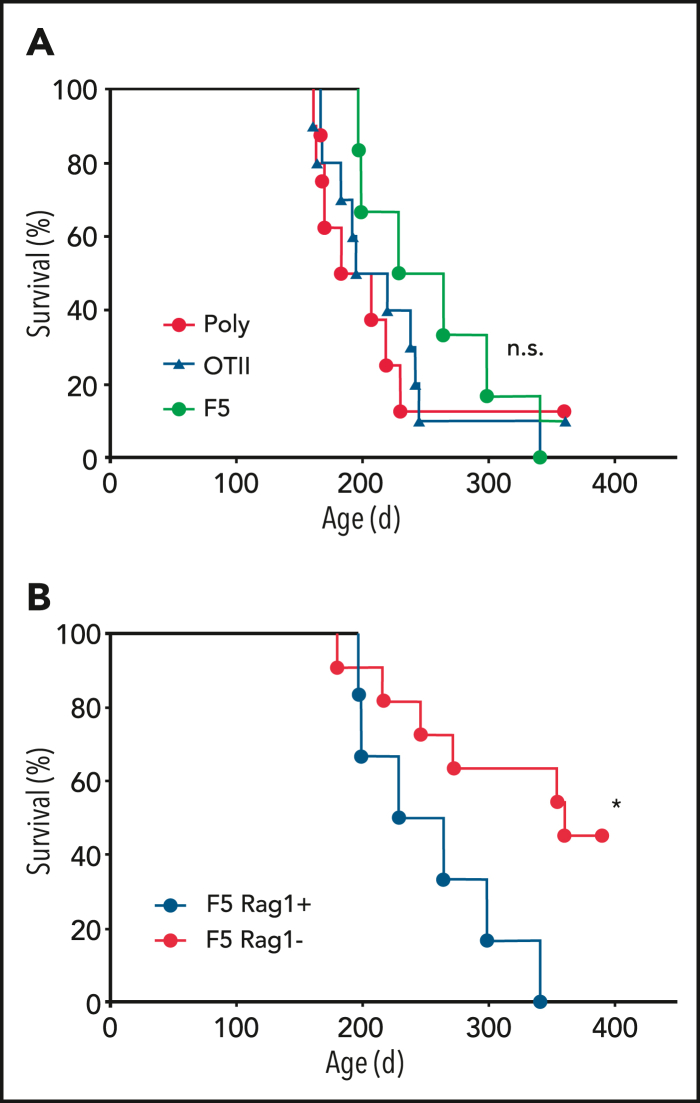
Disease development is influenced by Rag1 expression but not TCR signaling. (A) Development of malignant disease was monitored in cohorts of TetIL-7RON mice, whose T cells have a polyclonal TCR repertoire (Poly; n = 8), and TCR transgenic F5 TetIL-7RON (F5; n = 6) and OTII TetIL-7RON (OTII; n = 10) mice. Survival of the different strains over time is shown. (B) Survival of cohorts of F5 TetIL-7RON (F5 Rag1+) and F5 Rag1−/− TetIL-7RON (F5 Rag1−; n = 11) mice was monitored up to 400 days of age. ∗P = .018; n.s., nonsignificant; log-rank, Mantel-Cox test.
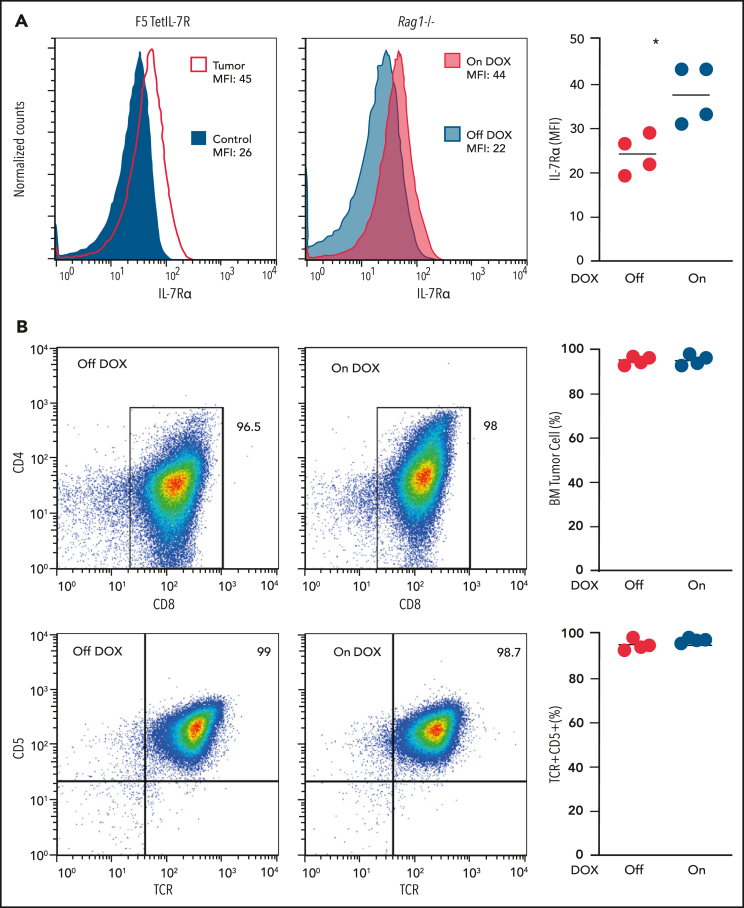
Maintenance of established TetIL-7R tumors no longer appears to require high IL-7Rα expression. (A) IL-7Rα expression was measured in F5 TetIL-7R primary tumor cells (left), and after adoptive transfer into Rag1−/− mice (middle). Mean fluorescence intensity (MFI) of primary tumor cells collected from the thymus of a sick mouse continuously fed dox (tumor) were compared with the DP (CD4+CD8+) cells of an F5 control mouse (used as the negative control; left). Malignant cells collected from the thymus of the same mouse were transplanted into Rag1−/− recipient mice that were fed with (On dox) or not fed (Off dox) dox-containing food for 4 weeks after transplantation (middle). MFI was compared after 4 weeks between On- and Off-dox groups. IL-7Rα MFI for each transplant-recipient animal (right). (B) Transplanted cells collected from the bone marrow of On- and Off-dox recipient mice 4 weeks after transplantation were compared for their immunophenotype. CD4 vs CD8 (top) and CD5 vs TCRαβ (bottom). Frequency of cells within the gate (left) for each transplant recipient. Results are representative of 3 independent experiments (each from a different primary tumor).
Erratum for
-
Overexpression of wild-type IL-7Rα promotes T-cell acute lymphoblastic leukemia/lymphoma.Blood. 2021 Sep 23;138(12):1040-1052. doi: 10.1182/blood.2019000553. Blood. 2021. PMID: 33970999 Free PMC article.
Publication types
LinkOut - more resources
Full Text Sources
