. 2024 Jul;131(4):1045-1067.
doi: 10.1037/rev0000475. Epub 2024 May 16.

"The eyes are the window to the representation": Linking gaze to memory precision and decision weights in object discrimination tasks

Affiliations

"The eyes are the window to the representation": Linking gaze to memory precision and decision weights in object discrimination tasks

Emily R Weichart et al. Psychol Rev. 2024 Jul.

Abstract

Humans selectively attend to task-relevant information in order to make accurate decisions. However, selective attention incurs consequences if the learning environment changes unexpectedly. This trade-off has been underscored by studies that compare learning behaviors between adults and young children: broad sampling during learning comes with a breadth of information in memory, often allowing children to notice details of the environment that are missed by their more selective adult counterparts. The current work extends the exemplar-similarity account of object discrimination to consider both the intentional and consequential aspects of selective attention when predicting choice. In a novel direct input approach, we used trial-level eye-tracking data from training and test to replace the otherwise freely estimated attention dynamics of the model. We demonstrate that only a model imbued with gaze correlates of memory precision in addition to decision weights can accurately predict key behaviors associated with (a) selective attention to a relevant dimension, (b) distributed attention across dimensions, and (c) flexibly shifting strategies between tasks. Although humans engage in selective attention with the intention of being accurate in the moment, our findings suggest that its consequences on memory constrain the information that is available for making decisions in the future. (PsycInfo Database Record (c) 2024 APA, all rights reserved).


Figures

Figure A1
Figure A1. Behavioral Correlates of Selective and Distributed Attention: Model Predictions With Freely Estimated α
Note. Green bars represent patterns of behavior consistent with a selective strategy of attention, and orange bars correspond to distributed attention. Bold bars and significance markers denote key effects in the observed behavior. (A) We identified four groups of participants via comparison of generalized context model (GCM) variants with contrasting specifications of attention. Bars show mean and 95% confidence intervals of best-fitting estimates of αD for each test phase. (B) Bars show mean probabilities of making an “old” response to each item type during the recognition test phase. Points show aggregate simulations using best-fitting parameters. (C) Bars for high-match, conflict, and one-new-P items reflect mean probabilities of responding consistently with the D feature. Bars for new-D reflect probabilities of responding consistently with the majority of P features. D = deterministic; P = probabilistic; P(X) = proportion of X; N = number of subjects; α = attention parameter; Recog. = recognition; Cat. = categorization; Sel = selective; Dist = distributed; R = recognition; C = categorization; n.s. = not significant.
Figure B1
Figure B1. Relating Attention to Choice Probability During Critical Items
Note. Panels depict simulated response probabilities. Most parameter values were selected arbitrarily and fixed across simulations; only parameter values representing attention were varied. X and Y values of each panel show the proportion of attention allocated to the deterministic dimension. The proportion of attention allocated to the probabilistic dimensions was specified as αP=1αD. (A) Z values (colors) indicate the probability of correctly rejecting a one-new-P item as “new” during the recognition test. Attention was specified as a single vector where α=1. (B) Z values indicate the probability of correctly rejecting a one-new-P item as “new” during the recognition test. Attention was specified as the product of two vectors, where η=1 and ζ=1. (C) Z values indicate the probability of making a categorization response consistent with the deterministic feature of given conflict item. Attention was specified as a single vector, where α=1. (D) Z values indicate the probability of making a categorization response consistent with the deterministic feature of given conflict item. Attention was specified as the product of two vectors, where η=1 and ζ=1.
Figure D1
Figure D1. Recognition: Combined Gaze-Based Memory Precision and Decision Weights
Note. Heatmaps show aggregate feature discriminability across subjects. X-ticks indicate stimulus dimensions, where P dimensions were rank-ordered within-subject according to gaze preference. Y-ticks indicate the dimension location of a novel feature within the relevant subset of trials. Subject-wise discriminability maps were calculated by subjecting raw dwell time data to best-fitting model-based transformations. Sel = selective; Dist = distributed; R = recognition; C = categorization; D = deterministic; P = probabilistic.
Figure D2
Figure D2. Categorization: Combined Gaze-Based Memory Precision and Decision Weights
Note. Heatmaps show aggregate feature discriminability across subjects. X-ticks indicate stimulus dimensions, where P dimensions were rank-ordered within-subject according to gaze preference. Y-ticks indicate the dimension location of a novel feature within the relevant subset of trials. Subject-wise discriminability maps were calculated by subjecting raw dwell time data to best-fitting model-based transformations. Sel = selective; Dist = distributed; R = recognition; C = categorization; D = deterministic; P = probabilistic.
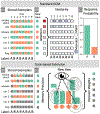
Figure 1
Figure 1. Exemplar-Similarity Framework
Note. (A) Labeled exemplars are stored in memory as vectors of feature information. Here, green and orange squares represent features that were drawn from unseen prototypes of Categories A and B, respectively. (B) The observer compares the features of a new to-be-categorized item to those of the stored exemplars. Feature-level similarity is impacted by a distribution of attention, such that features of highly attended (deeper hues of red) dimensions result in better discriminability between matching and mismatching features. (C) Exemplars that are perceived to be more similar to the new item are assigned a higher “activation” value. Response probability is a ratio of total activation values between Categories A and B. (D) In the proposed gaze-based extension to GCM, exemplar features are stored in memory in proportion to how long they were fixated during learning. Gray hues represent low memory precision. (E) When the observer processes a new item, gaze patterns are presumed to provide insight into both which features were plausibly encoded into memory and how features were weighted during the categorization decision. GCM = generalized context model.
Figure 2
Figure 2. Predictions of Key Behavioral Effects
Note. (A) During recognition, a strategy of distributed attention should result in correct rejections of both new-D and one-new-P items as “new.” A strategy of selective attention to the D dimension should result in a reduced ability to correctly reject one-new-P items. (B) During categorization, a strategy of selective attention should result in high proportions of responses consistent with the D feature during both high-match and conflict items. A strategy of distributed attention should result in a lower proportion of D-consistent responses during conflict items. D = deterministic; P = probabilistic.
Figure 3
Figure 3. Linking Functions
Note. (Top) Candidate linking functions used in our investigation. X values show dwell time inputs, and Y values show outputs representing memory precision or decision weight components of attention. Colored lines illustrate changes to the function that result from modulation of free parameters θ and ω. (Bottom) Heatmaps show examples of attention outputs (Z values; colors) when applying the candidate functions to one subject’s gaze data. The X-axis shows stimulus dimensions. The Y-axis indexes training trials. D = deterministic; θ and ω = linking parameters.
Figure 4
Figure 4. Gaze-Predicted Behavioral Correlates of Selective and Distributed Attention
Note. Green bars represent patterns of behavior consistent with a selective strategy of attention, and orange bars correspond to distributed attention. Bold bars and significance markers denote key effects in the observed behavior. (A) Bars show mean probabilities of making an “old” response to each item type during the recognition test phase. Points show aggregate simulations using best-fitting parameters from Model C–B. (B) Bars for high-match, conflict, and one-new-P items reflect mean probabilities of responding consistently with the D feature. Bars for new-D reflect probabilities of responding consistently with the majority of P features. Points show aggregate simulations using best-fitting parameters from Model C–B. Sel = selective; Dist = distributed; R = recognition; C = categorization; D = deterministic; P = probabilistic; P(X) = proportion of X; n.s. = not significant.
Figure 5
Figure 5. Gaze-Based Memory Precision for Training Features
Note. Heatmaps show aggregate memory precision across subjects. X-ticks indicate stimulus dimensions, where P dimensions were rank-ordered within-subject according to gaze preference. Y-ticks show trial numbers. Subject-wise memory precision maps were calculated by subjecting raw dwell time data to best-fitting model-based transformations. Sel = selective; Dist = distributed; R = recognition; C = categorization; D = deterministic; P = probabilistic.

Similar articles

References

    1. Akaike H. (1974). A new look at the statistical model identification. IEEE Transactions on Automatic Control, 19(6), 716–723. 10.1109/TAC.1974.1100705 - DOI
    1. Ashby F, & Lee W (1991). Predicting similarity and categorization from identification. Journal of Experimental Psychology: General, 120(2), 150–172. 10.1037/0096-3445.120.2.150 - DOI - PubMed
    1. Ashby F, & Maddox W (1993). Relations between prototype, exemplar, and decision bound models of categorization. Journal of Mathematical Psychology, 37(3), 372–400. 10.1006/jmps.1993.1023 - DOI
    1. Beesley T, & Le Pelley M (2011). The influence of blocking on overt attention and associability in human learning. Journal of Experimental Psychology: Animal Behavior Processes, 37(1), 114–120. 10.1037/a0019526 - DOI - PubMed
    1. Beesley T, Nguyen K, Pearson D, & Le Pelley M (2015). Uncertainty and predictiveness determine attention to cues during human associative learning. Quarterly Journal of Experimental Psychology, 68(11), 2175–2199. 10.1080/17470218.2015.1009919 - DOI - PubMed