. 2024 May 16;134(12):e179834.
doi: 10.1172/JCI179834.

Osteochondroprogenitor cells and neutrophils expressing p21 and senescence markers modulate fracture repair

Affiliations

Osteochondroprogenitor cells and neutrophils expressing p21 and senescence markers modulate fracture repair

Dominik Saul et al. J Clin Invest. .

Abstract

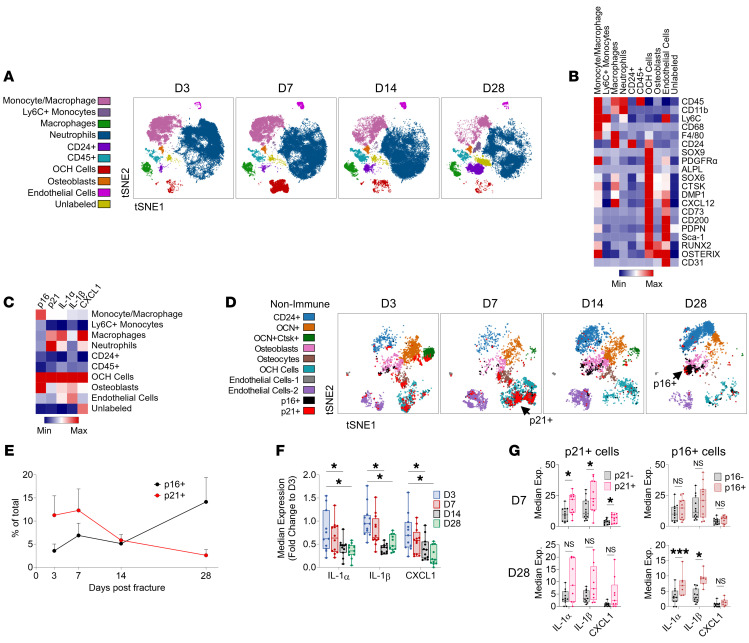
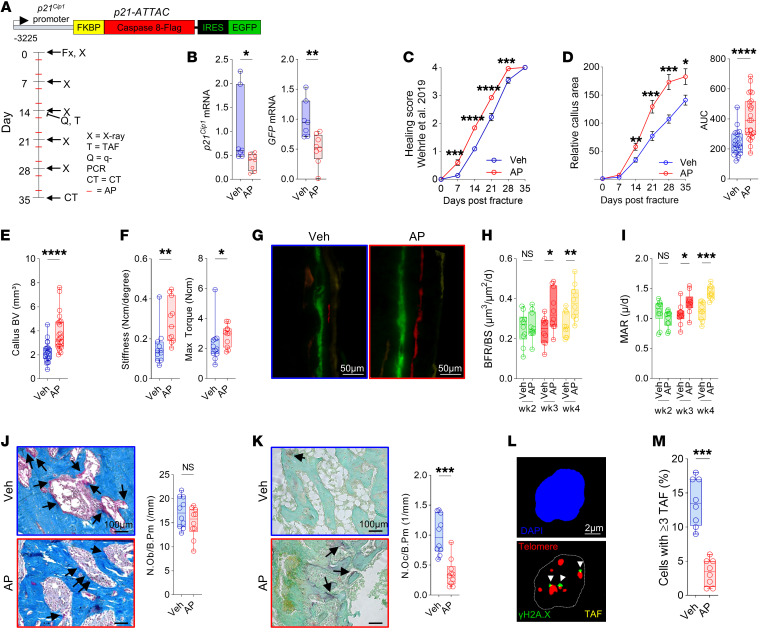
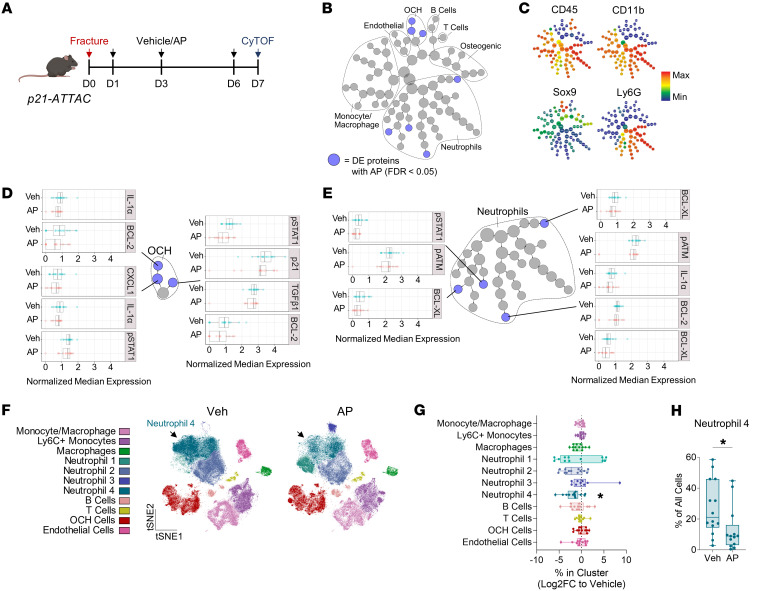
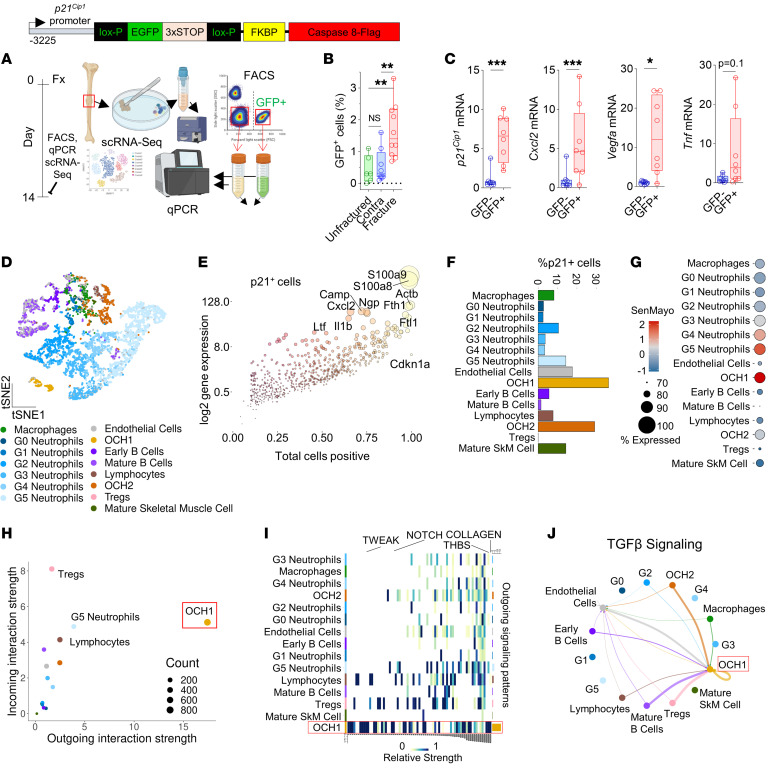
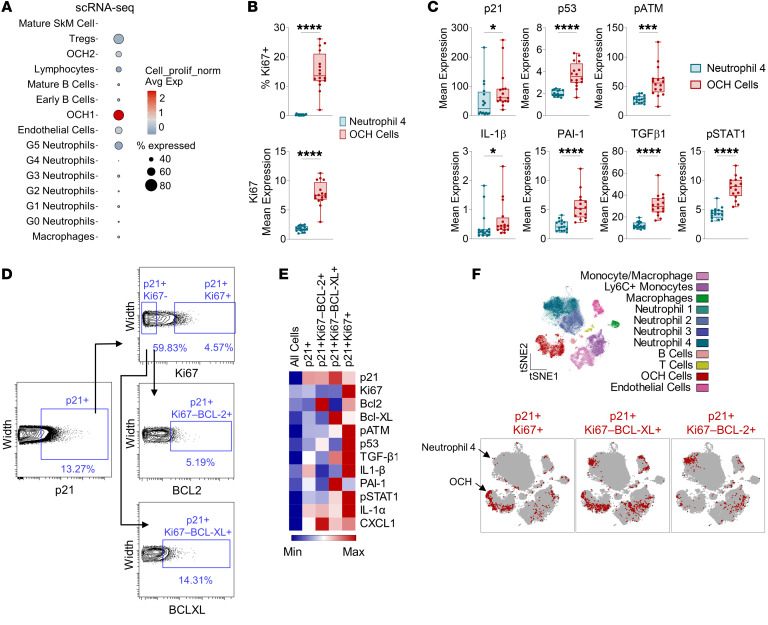
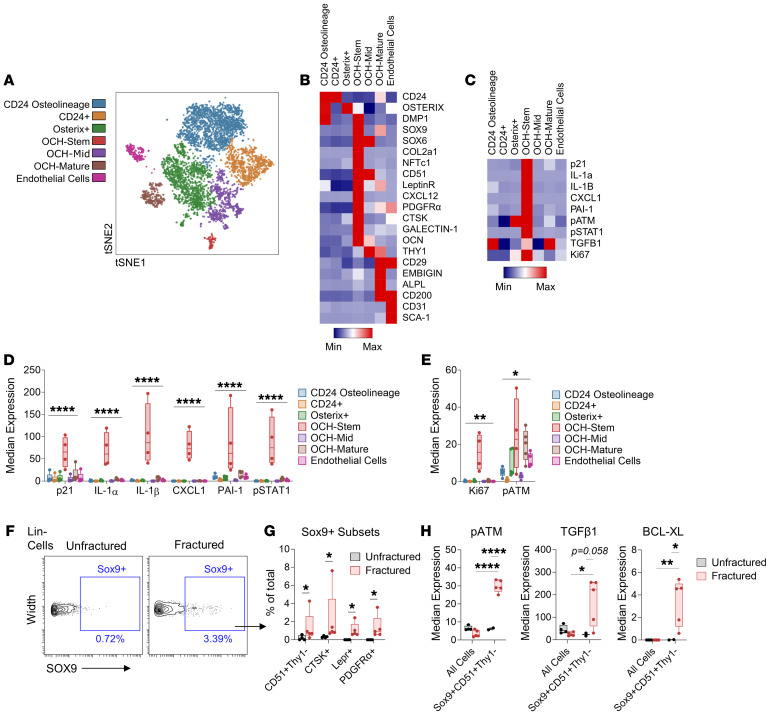
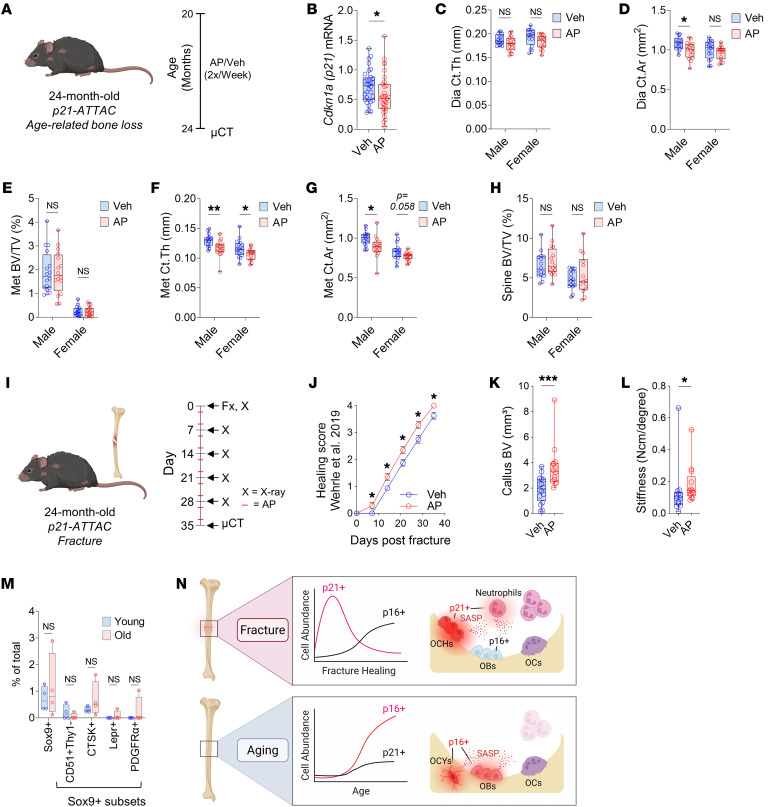
Cells expressing features of senescence, including upregulation of p21 and p16, appear transiently following tissue injury, yet the properties of these cells or how they contrast with age-induced senescent cells remains unclear. Here, we used skeletal injury as a model and identified the rapid appearance following fracture of p21+ cells expressing senescence markers, mainly as osteochondroprogenitors (OCHs) and neutrophils. Targeted genetic clearance of p21+ cells suppressed senescence-associated signatures within the fracture callus and accelerated fracture healing. By contrast, p21+ cell clearance did not alter bone loss due to aging; conversely, p16+ cell clearance, known to alleviate skeletal aging, did not affect fracture healing. Following fracture, p21+ neutrophils were enriched in signaling pathways known to induce paracrine stromal senescence, while p21+ OCHs were highly enriched in senescence-associated secretory phenotype factors known to impair bone formation. Further analysis revealed an injury-specific stem cell-like OCH subset that was p21+ and highly inflammatory, with a similar inflammatory mesenchymal population (fibro-adipogenic progenitors) evident following muscle injury. Thus, intercommunicating senescent-like neutrophils and mesenchymal progenitor cells were key regulators of tissue repair in bone and potentially across tissues. Moreover, our findings established contextual roles of p21+ versus p16+ senescent/senescent-like cells that may be leveraged for therapeutic opportunities.

Keywords: Aging; Bone biology; Bone disease; Cellular senescence.


Figures

Figure 1
Figure 1. p21+ and p16+ cells appear in a divergent manner during fracture healing.
(A) t-SNE visualization of clustered cell populations across murine fracture healing by CyTOF. (B) Heatmap representation of identification and (C) senescence and SASP marker median expression across all clusters. (D) t-SNE visualization of nonimmune (CD45CD11b) callus cells across fracture healing, overlaid with p16+ (black) and p21+ cells (red). (E) p16+ and p21+ cell abundances across fracture healing in nonimmune cells. (F) SASP marker median expression throughout fracture healing in all nonimmune cells and (G) in p16+ and p21+ nonimmune cells. Day 3: n = 12 mice (6 female, 6 male); day 7: n = 12 mice (6 female, 6 male); day 14: n = 12 mice (6 female, 6 male); day 28: n = 11 mice (6 female, 5 male). *P < 0.05; ***P < 0.001 by 1-way ANOVA with Tukey’s correction for multiple comparisons (F) or Mann-Whitney U test (G).
Figure 2
Figure 2. Clearance of p21+ cells accelerates fracture healing by increasing bone formation rates and reducing osteoclast numbers.
(A) Schematic of the p21-ATTAC transgene and overall study design. p21-ATTAC mice (4–6 months old) were used to selectively clear p21+ cells through AP administration twice weekly over a 5-week fracture healing time course. (B) qRT-PCR measurement of p21Cip1 and GFP (p21-ATTAC transgene) mRNA expression after AP treatment on day 14. (C) Fracture healing score (described by Wehrle et al.; ref. 21), and (D) callus area as measured by weekly x-rays. (E) μCT of callus bone volume (BV). (F) Tibial stiffness and maximal torque measured by biomechanical testing. (GI) Histomorphometric analysis of bone formation rate per bone surface (BFR/BS) and mineral apposition rate (MAR) through weekly injections of bone-labeling dyes (see Methods). Scale bars: 50 μm. (J) Histological quantification of osteoblasts through Masson’s trichrome staining. (K) Histological quantification of osteoclasts through tartrate-resistant acid phosphatase (TRAP) staining. Scale bars: 100 μm (J and K). Arrows in J and K indicate osteoblasts and osteoclasts, respectively. (L) Telomere-associated foci (TAF) staining (day 14) for DNA damage. Scale bar: 2 μm. (M) Quantification of cells exhibiting 3 or more TAF per cell. n = 8–11 (B and FM) or n = 22–25 (C and D) per treatment, equally split by sex. *P < 0.05; **P < 0.01; ***P < 0.001; ****P < 0.0001 by Mann-Whitney U test (B, D, E, and JM), 2-way ANOVA with Šidák’s correction (C, D, and F), or multiple t test with FDR correction (H and I).
Figure 3
Figure 3. Clearance of p21+ cells suppresses factors driving osteoclast recruitment and inhibition of bone formation through targeting OCH cells and neutrophils.
(A) Schematic outlining CyTOF analysis of callus cells after p21+ cell clearance in p21-ATTAC mice. (B) CITRUS analysis reveals reduced expression (blue dots; FDR < 0.05) of proteins in OCH and Neutrophil cell clusters. (C) CITRUS expression plots for key identification markers. (D) CITRUS results of differential expression between vehicle- and AP-treated groups in OCH (D) and Neutrophil (E) clusters; all FDR < 0.05. (F) t-SNE visualization and FlowSOM clustering of callus cells from p21-ATTAC mice treated with either vehicle (Veh) or AP. (G) Quantification of changes in cell cluster percentages after AP treatment (log2[fold change]; 2-way ANOVA with Šidák’s multiple-comparison test). (H) Quantification of absolute changes in the Neutrophil-4 cluster after AP treatment (Mann-Whitney U test). n = 16 vehicle-treated mice (8 female, 8 male), n = 13 AP-treated mice (7 female, 6 male). *P < 0.05.
Figure 4
Figure 4. p21+ callus cells are largely highly secretory OCH cells and mature neutrophils.
(A) Schematic of p21+ cell isolation and scRNA-seq using the p21 reporter mice. (B) GFP+ cells were significantly higher in the fractured compared with the unfractured contralateral side and an unfractured mouse tibia. n = 10 fractured (n = 4 female, n = 6 male), n = 8 contralateral sides (n = 4 female, n = 4 male), n = 6 unfractured (n = 3 female, n = 3 male). (C) p21Cip1, Cxcl2, Vegfa, and Tnfa mRNA expression was significantly enriched in GFP+ cells. n = 8 mice (n = 4 male, n = 4 female). (D) scRNA-seq analysis was performed on 5,994 total callus cells from n = 4 mice (n = 2 male, n = 2 female). (E) Differentially upregulated mRNA transcripts in p21+ cells. (F) Proportion of p21+ cells and (G) SenMayo gene enrichment analysis among clustered cell populations. (H and I) Predicted secretory strength relationships in callus cells among all signaling pathways and (J) TGF-β signaling by CellChat. *P < 0.05; **P < 0.01; ***P < 0.001 by 1-way ANOVA with Tukey’s correction (B) or Mann-Whitney U test (C, GFP+ vs. GFP).
Figure 5
Figure 5. OCH cells are a proliferative population with a senescent-like phenotype.
(A) Expression of cell proliferation gene set (GO_0008283) among callus cell populations identified by scRNA-seq (see Figure 4). n = 4 mice. (B) Percentage Ki67+ and Ki67 mean expression between OCH cell and Neutrophil-4 callus cell clusters identified by CyTOF (see Figure 3). (C) Senescence-related and SASP protein expression between OCH cells and Neutrophil-4 clusters. (D) Gating strategy for p21+/Ki67+, p21+Ki67BCL2+, and p21+Ki67BCL-XL+ cell populations in fractured mice. (E) Heatmap demonstrating mean expression of senescence-associated proteins in p21+ subsets by CyTOF. (F) t-SNE visualization of FlowSOM-clustered callus cells overlaid with p21+Ki67+, p21+Ki67BCL-XL+, and p21+Ki67BCL2+ cells (red). n = 16 mice (BF). *P < 0.05, ***P < 0.001, ****P < 0.0001 by unpaired, 2-tailed t test (B and C: p53, p-ATM, PAI-1, TGF-β1, p-STAT1) or Mann-Whitney U test (C: p21, IL-1β).
Figure 6
Figure 6. OCHs expressing SSC markers define an injury-specific senescent-like population.
(A) t-SNE visualization of FlowSOM-clustered callus cell populations collected from fractured WT C57BL/6 mice. (B and C) Heatmap representation of mean protein expression of (B) identity and (C) senescence-associated markers. (D and E) Quantification of senescence-associated proteins among all clustered cell populations. (F) Gating strategy for LinSox9+ cells in CyTOF samples isolated from either unfractured or fractured bones from young (4- to 6-month-old) mice. (G) Quantification of manually gated OCH-Stem clusters in both unfractured and fractured samples. (H) Quantification of senescence-associated proteins in manually gated OCH-Stem (LinSox9+CD51+) cell populations compared to all cells in both unfractured and fractured samples. n = 5 fractured, n = 4 unfractured, all female. *P < 0.05; **P < 0.01; ****P < 0.0001 by 2-way ANOVA with Tukey’s multiple-comparison test (D, E, and H) or Mann-Whitney U test (G).
Figure 7
Figure 7. Detrimental effects of p21+ cells on bone metabolism are aging independent.
(A) p21+ cell clearance was performed in old p21-ATTAC mice treated at 20 months of age for 4 months with either vehicle (Veh) (n = 32 mice: 16 male, 16 female) or AP (n = 32 mice: 16 male, 15 female) twice weekly until sacrifice at 24 months. (B) qRT-PCR measurement of p21Cip1 mRNA expression. (CG) Skeletal parameters measured at the femur by μCT: (C) diaphyseal (Dia) cortical thickness (Ct.Th), (D) Dia cortical area (Ct.Ar), (E) metaphyseal (Met) trabecular bone volume per total volume (BV/TV), (F) Met Ct.Th, and (G) Met Ct.Ar. (H) Trabecular BV/TV measured at the L5 lumbar vertebra. (I) Schematic for clearance of p21+ cells in old mice undergoing fracture repair; 24-month-old p21-ATTAC mice were used to selectively clear p21+ cells through treatment with either vehicle (n = 16 mice; 8 male, 8 female) or AP (n = 14 mice; 7 male, 7 female) twice weekly over a 5-week fracture healing time course. (J) Fracture healing score measured by weekly x-ray. (K) μCT of callus bone volume. (L) Tibial stiffness measured by biomechanical testing (n = 13 Veh: 6 male, 7 female. n = 13 AP: 7 male, 6 female). (M) CyTOF analysis of OCH-Stem population abundances among CD45Lin nonimmune cells isolated from the digested hind limbs of young (6-month-old) and old (24-month-old) WT C57BL/6 mice (n = 4 mice per group, all female). (N) Schematic of results from injured young bone versus intact aging bone. OCHs, osteochondroprogenitors; OBs, osteoblasts; OCs, osteoclasts; OCYs, osteocytes. Note that this figure is a schematic and only provides a depiction of the cell populations rather than quantitative data. *P < 0.05; **P < 0.01; ***P < 0.001 by Mann-Whitney U test (B and KM), unpaired, 2-tailed t test (CH), or 2-way ANOVA with Šidák’s correction (J).

Update of

Similar articles

Cited by

References

    1. López-Otín C, et al. Hallmarks of aging: an expanding universe. Cell. 2023;186(2):243–278. doi: 10.1016/j.cell.2022.11.001. - DOI - PubMed
    1. Tchkonia T, et al. Cellular senescence and the senescent secretory phenotype: therapeutic opportunities. J Clin Invest. 2013;123(3):966–972. doi: 10.1172/JCI64098. - DOI - PMC - PubMed
    1. Lopes-Paciencia S, et al. The senescence-associated secretory phenotype and its regulation. Cytokine. 2019;117:15–22. doi: 10.1016/j.cyto.2019.01.013. - DOI - PubMed
    1. Di Micco R, et al. Cellular senescence in ageing: from mechanisms to therapeutic opportunities. Nat Rev Mol Cell Biol. 2021;22(2):75–95. doi: 10.1038/s41580-020-00314-w. - DOI - PMC - PubMed
    1. Raffaele M, Vinciguerra M. The costs and benefits of senotherapeutics for human health. Lancet Healthy Longev. 2022;3(1):e67–e77. doi: 10.1016/S2666-7568(21)00300-7. - DOI - PubMed

MeSH terms

Substances