. 2024 Dec;13(1):2353302.
doi: 10.1080/22221751.2024.2353302. Epub 2024 May 26.

The lethal K18-hACE2 knock-in mouse model mimicking the severe pneumonia of COVID-19 is practicable for antiviral development

Affiliations

The lethal K18-hACE2 knock-in mouse model mimicking the severe pneumonia of COVID-19 is practicable for antiviral development

Zhen Zhang et al. Emerg Microbes Infect. 2024 Dec.

Abstract

Animal models of COVID-19 facilitate the development of vaccines and antivirals against SARS-CoV-2. The efficacy of antivirals or vaccines may differ in different animal models with varied degrees of disease. Here, we introduce a mouse model expressing human angiotensin-converting enzyme 2 (ACE2). In this model, ACE2 with the human cytokeratin 18 promoter was knocked into the Hipp11 locus of C57BL/6J mouse by CRISPR - Cas9 (K18-hACE2 KI). Upon intranasal inoculation with high (3 × 10⁵ PFU) or low (2.5 × 10² PFU) dose of SARS-CoV-2 wildtype (WT), Delta, Omicron BA.1, or Omicron BA.2 variants, all mice showed obvious infection symptoms, including weight loss, high viral loads in the lung, and interstitial pneumonia. 100% lethality was observed in K18-hACE2 KI mice infected by variants with a delay of endpoint for Delta and BA.1, and a significantly attenuated pathogenicity was observed for BA.2. The pneumonia of infected mice was accompanied by the infiltration of neutrophils and pulmonary fibrosis in the lung. Compared with K18-hACE2 Tg mice and HFH4-hACE2 Tg mice, K18-hACE2 KI mice are more susceptible to SARS-CoV-2. In the antivirals test, REGN10933 and Remdesivir had limited antiviral efficacies in K18-hACE2 KI mice upon the challenge of SARS-CoV-2 infections, while Nirmatrelvir, monoclonal antibody 4G4, and mRNA vaccines potently protected the mice from death. Our results suggest that the K18-hACE2 KI mouse model is lethal and stable for SARS-CoV-2 infection, and is practicable and stringent to antiviral development.

Keywords: K18-hACE2 knock-in mouse; Omicron; SARS-CoV-2; antivirals; mouse model; severe pneumonia.


Conflict of interest statement

No potential conflict of interest was reported by the author(s).

Figures
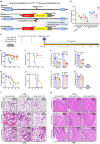
Figure 1.
Figure 1.
The comparison of outcomes of the hACE2 mouse models to SARS-CoV-2 infection. (A) Generation of K18-hACE2 KI mice. The element containing the K18 promoter, the human ACE2 (hACE2) coding sequence, was inserted into the Hipp11 locus, which can drive the epithelial cell-specific expression of hACE2. (B) hACE2 distribution in the tissues of K18-hACE2 KI mice. K18-hACE2 KI mice (n = 6) were euthanized, and the indicated tissues were collected to measure hACE2 mRNA levels via absolute quantification RT-PCR. hACE2 copy numbers were normalized as copies per milligram of tissue. (C) Schematic for SARS-CoV-2 infection. Twelve – to eighteen-week-old K18-hACE2 KI, B6.Cg-Tg(K18-hACE2)2Prlmn/J (K18-hACE2 Tg) and HFH4-hACE2 Tg mice were anesthetized, followed by intranasal inoculation with 2.5 × 102 or 3.0 × 105 PFU of SARS-CoV-2 wild-type (WT). Infected mice were monitored and evaluated at the indicated time for (D, H) body weight changes (n = 6) and (E, I) survival (n = 6), and were then sacrificed to harvest samples at the endpoint of experiment. Mice that lost over 20% of their starting body weight were euthanized. (F, J) Viral N gene copy numbers were measured by absolute quantification RT-PCR in the lungs and the brains. (G, K) Pathology scoring on lung and brain tissues. (L, M) H&E staining of lung and brain tissues obtained from K18-hACE2 KI, K18-hACE2 Tg or HFH4-hACE2 Tg mice following SARS-CoV-2 WT infection. The black arrow indicates the lung tissue damages. One-way ANOVA with Tukey’s multiple comparison test was used. ****, P < 0.0001; ***, P < 0.001; **, P < 0.01; *, P < 0.05; ns, not significant, P > 0.05. Error bars represent the means with SEMs in (B), (D) and (H), and the means with SDs elsewhere. ND, not detected.
Figure 2.
Figure 2.
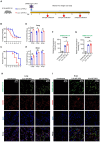
SARS-CoV-2 infection in K18-hACE2 KI results in a lethal infection. (A) Schematic for SARS-CoV-2 infection. Twelve – to eighteen-week-old male and female K18-hACE2 KI mice were anesthetized, followed by intranasal inoculation with 2.5 × 102 or 3.0 × 105 PFU of SARS-CoV-2. Infected mice were monitored and evaluated at the indicated time for (B) body weight changes (n = 12) and (C) survival (n = 12). At 2, 4, and 6 dpi, at least 3 mice per group were sacrificed to harvest samples, and viral N gene copy numbers in (D) the lungs and (E) the brains were measured by absolute quantification RT-PCR. Mice that lost over 20% of their starting body weight were euthanized. (F) to (I) Immunofluorescence quantification and analysis of hACE2 and SARS-CoV-2 N protein in the lungs and the brains of K18-hACE2 KI mice. In (H) and (I), left panel, the uninfected group; middle panel, the group infected with 2.5 × 102 PFU of SARS-CoV-2 WT at 4 dpi; right panel, the group infected with 3 × 105 PFU of SARS-CoV-2 WT at 4 dpi. Green, SARS-CoV N protein; red, hACE2; blue, DAPI. The scale bar is shown in each section. Two-way ANOVA with Tukey’s multiple comparison test was used in (D) and (E), ****, P < 0.0001; *, P < 0.05; ns, not significant, P > 0.05. Unpair Student’s t test was used in (F) and (G), *, P < 0.05; ns, not significant, P > 0.05; ND, not detected. Error bars represent the means with SEMs in (B) and the means with SDs elsewhere.
Figure 3.
Figure 3.
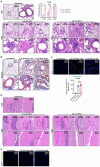
Lung and brain histopathological analysis of K18-hACE2 KI mice. (A) Lung H&E staining of K18-hACE2 KI mice and the pathology scores. The lungs of K18-hACE2 KI mice collected at 2, 4, and 6 dpi were subjected to H&E staining. The uninfected mice served as the control group. The black arrow indicates the lung tissue damages. (B) IHC analysis for pulmonary fibrosis in SARS-CoV-2-infected mice. Pulmonary fibrosis was marked with Masson (blue). Left panel, the uninfected group; middle panel, the group infected with 2.5 × 102 PFU of SARS-CoV-2 WT at 6 dpi; right panel, the group infected with 3 × 105 PFU of SARS-CoV-2 WT at 6 dpi. (C) Lung immunofluorescence analysis and quantification for neutrophils (Neu+) in SARS-CoV-2-infected mice. Neutrophils are marked with Ly6G. Left panel, the uninfected group; middle panel, the group infected with 2.5 × 102 PFU of SARS-CoV-2 at 6 dpi; right panel, the group infected with 3 × 105 PFU of SARS-CoV-2 at 6 dpi. Blue, DAPI; green, Ly6G. The scale bar is shown in each section. (D) Brain H&E staining of K18-hACE2 KI mice. The brains of K18-hACE2 KI mice collected from the indicated time point were subjected to H&E staining. The uninfected mice served as the control group. (E) The brain immunofluorescence analysis for neutrophils (Neu+) in SARS-CoV-2-infected mice. Neutrophils are marked with Ly6G. Left panel, the uninfected group; middle panel, the group infected with 2.5 × 102 PFU of SARS-CoV-2 at 6 dpi; right panel, the group infected with 3 × 105 PFU of SARS-CoV-2 at 5 dpi. Blue, DAPI; green, Ly6G. The scale bar is shown in each section. ***, P < 0.001; *, P < 0.05; ns, not significant, P > 0.05. Two-way ANOVA with Tukey’s multiple comparison test was used in (A), ***, P < 0.001; *, P < 0.05; ns, not significant, P > 0.05. Unpair Student’s t test was used in (C), ns, not significant, P > 0.05. Error bars represent the means with SDs.
Figure 4.
Figure 4.
SARS-CoV-2 infection activated PRRs and interferons in K18-hACE2 KI mice. The mRNA levels of Tlr3, Tlr7, Tlr8, Ddx58, Irf3, Irf7, Ifna1, Ifna4, Ifnb, Ifnl2/3, and Ifng in (A) the lungs and (B) the brains were measured by relative quantification RT-PCR. The results are expressed as fold changes in the gene RNA levels in infected mice relative to the uninfected control. Gapdh was used as housekeeping gene. Two-way ANOVA with Tukey’s multiple comparison test was used. ****, P < 0.0001; ***, P < 0.001; **, P < 0.01; *, P < 0.05; ns, not significant, P > 0.05. Error bars represent the means with SEMs.
Figure 5.
Figure 5.
SARS-CoV-2 infection induced inflammatory cytokines in K18-hACE2 KI mice. The mRNA levels of Il1a, Il1b, Il6, Il10, Il12a, Il17a, Il17f, Il18, Il33, Tnfa, and Tgfb1 in (A) the lungs and (B) the brains were measured by relative quantification RT-PCR. The results are expressed as fold changes in the gene RNA levels in infected mice relative to the uninfected control. Gapdh was used as housekeeping gene. Two-way ANOVA with Tukey’s multiple comparison test was used. ****, P < 0.0001; ***, P < 0.001; **, P < 0.01; *, P < 0.05; ns, not significant, P > 0.05. Error bars represent the means with SEMs.
Figure 6.
Figure 6.
SARS-CoV-2 infection induced chemokine storms in K18-hACE2 KI mice. the mRNA levels of Ccl2, Ccl3, Ccl4, Ccl5, Ccl11, Cxcl1, Cxc12, Cxc15, Cxc19, and Cxc19 in (A) the lungs and (B) the brains were measured by relative quantification RT-PCR. The results are expressed as fold changes in the gene RNA levels in infected mice relative to the uninfected control. Gapdh was used as housekeeping gene. Two-way ANOVA with Tukey’s multiple comparison test was used. ****, P < 0.0001; ***, P < 0.001; **, P < 0.01; *, P < 0.05; ns, not significant, P > 0.05. Error bars represent the means with SEMs.
Figure 7.
Figure 7.
K18-hACE2 KI mouse infection with SARS-CoV-2 variants. (A) Schematic for SARS-CoV-2 infection. Twelve-week-old K18-hACE2 KI mice were i.n. inoculated with 2.5 × 102 PFU of SARS-CoV-2 WT, Delta, Omicron BA.1, or Omicron BA.2 of SARS-CoV-2. Infected mice were monitored and evaluated at the indicated time for (B) body weight changes (n = 5) and (C) survival (n = 5). At endpoint (n = 5), mice were sacrificed to harvest their lungs, and (D) viral N gene copy numbers were measured by absolute quantification RT-PCR. Mice that lost over 20% of their starting body weight were euthanized. Error bars represent the means with SDs. (E) Pathology scores. (F) Lung H&E staining of K18-hACE2 KI mice. The lungs of K18-hACE2 KI mice collected at endpoint were subjected to H&E staining and histology scoring. The scale bar is shown in each section. The black arrow indicates the lung tissue damage, the yellow arrow indicates the infiltration of monocytes. Two-way ANOVA with Tukey’s multiple comparison test was used. **, P < 0.01; ns, not significant, P > 0.05. Error bars represent the means with SEMs in (B) and the means with SDs elsewhere.
Figure 8.
Figure 8.
Evaluation of anti-SARS-CoV-2 drug by K18-hACE2 KI mouse model. (A) Schematic of experimental design for anti-SARS-CoV-2 neutralizing antibody, mRNA vaccine, and drug treatment. Twelve-week-old K18-hACE2 KI mice were injected with 10 mg/kg REGN10933 or 4G4 at – 1 dpi, or treated with 25 mg/kg Remdesivir (RDV) daily by intraperitoneally injection from 0 to 5 dpi, or treated with 300 mg/kg Nirmatrelvir (NMV) daily by oral gavage from 0 to 5 dpi. For mRNA vaccine, mice received the first dose of mRNA vaccine intramuscularly 6 weeks prior to infection, followed by the second dose 3 weeks before infection. All groups K18-hACE2 KI mice were infected i.n. with 2.5 × 102 PFU SARS-CoV-2 WT viruses at 0 dpi. Mice that lost over 20% of their starting body weight were euthanized. Infected mice were monitored and evaluated at the indicated time for (B) body weight changes (n = 4), (C) survival (n = 4) and (D) viral N gene copy numbers at experimental endpoint. (E) Pathology scores. (F) The lungs of K18-hACE2 KI mice collected at experimental endpoint were subjected to H&E staining and histology scoring. The scale bar is shown in each section. The black arrow indicates the lung tissue damage, the yellow arrow indicates the infiltration of monocytes. One-way ANOVA with Tukey’s multiple comparison test was used. ***, P < 0.001; **, P < 0.01; ns, not significant, P > 0.05. Error bars represent the means with SEMs in (B) and the means with SDs elsewhere.

Similar articles

Cited by

References

    1. Wu F, Zhao S, Yu B, et al. . A new coronavirus associated with human respiratory disease in China. Nature. 2020;579(7798):265–269. doi:10.1038/s41586-020-2008-3 - DOI - PMC - PubMed
    1. Zhu N, Zhang D, Wang W, et al. . A novel coronavirus from patients with pneumonia in China, 2019. N Engl J Med. 2020;382(8):727–733. doi:10.1056/NEJMoa2001017 - DOI - PMC - PubMed
    1. Zhou P, Yang XL, Wang XG, et al. . A pneumonia outbreak associated with a new coronavirus of probable bat origin. Nature. 2020;579(7798):270–273. doi:10.1038/s41586-020-2012-7 - DOI - PMC - PubMed
    1. Chen Y, Liu QY, Guo DY.. Emerging coronaviruses: Genome structure, replication, and pathogenesis. J Med Virol. 2020;92(4):418–423. doi:10.1002/jmv.25681 - DOI - PMC - PubMed
    1. Chen N, Zhou M, Dong X, et al. . Epidemiological and clinical characteristics of 99 cases of 2019 novel coronavirus pneumonia in Wuhan, China: a descriptive study. Lancet. 2020;395(10223):507–513. doi:10.1016/S0140-6736(20)30211-7 - DOI - PMC - PubMed

MeSH terms

Supplementary concepts