. 2024 May 28;43(5):114239.
doi: 10.1016/j.celrep.2024.114239. Epub 2024 May 15.

Conserved and divergent DNA recognition specificities and functions of R2 retrotransposon N-terminal domains

Affiliations

Conserved and divergent DNA recognition specificities and functions of R2 retrotransposon N-terminal domains

Rosa Jooyoung Lee et al. Cell Rep. .

Abstract

R2 non-long terminal repeat (non-LTR) retrotransposons are among the most extensively distributed mobile genetic elements in multicellular eukaryotes and show promise for applications in transgene supplementation of the human genome. They insert new gene copies into a conserved site in 28S ribosomal DNA with exquisite specificity. R2 clades are defined by the number of zinc fingers (ZFs) at the N terminus of the retrotransposon-encoded protein, postulated to additively confer DNA site specificity. Here, we illuminate general principles of DNA recognition by R2 N-terminal domains across and between clades, with extensive, specific recognition requiring only one or two compact domains. DNA-binding and protection assays demonstrate broadly shared as well as clade-specific DNA interactions. Gene insertion assays in cells identify the N-terminal domains sufficient for target-site insertion and reveal roles in second-strand cleavage or synthesis for clade-specific ZFs. Our results have implications for understanding evolutionary diversification of non-LTR retrotransposon insertion mechanisms and the design of retrotransposon-based gene therapies.

Keywords: CP: Molecular biology; DNA-binding specificity; Myb domain; R2 retrotransposon; gene insertion; gene therapy; genome engineering; non-LTR retrotransposon; protein-DNA interaction; zinc finger.


Conflict of interest statement

Declaration of interests B.V.T. and K.C. are listed inventors on patent applications filed by University of California, Berkeley, related to the transgene insertion technology platform. B.V.T. and K.C. have equity options in Addition Therapeutics, which licensed the University of California, Berkeley technology. K.C. is a consultant and board member of Addition Therapeutics but does not receive personal compensation for these roles.

Figures

Figure 1.
Figure 1.. Design and purification of R2 N-terminal-region proteins for DNA-binding assays
(A) Domain schematic of R2 retrotransposon clades A–D. ZF, zinc finger; RT, reverse transcriptase; ZK, zinc knuckle; EN, endonuclease. Domains are not drawn to scale. (B) Schematic of a new R2 retrotransposon insertion into the 28S rDNA target site. Solid lines denote DNA, and squiggly lines denote RNA. Arrowheads indicate strand 3′ end. (C) Target site and flanking 28S rDNA sequences from selected species of D- and A-clade R2 retrotransposons relevant for this study. A dot denotes the same nt as in B. mori. The conserved position of the first-strand nick is denoted with a black triangle. The numbering schematic places 0 as the phosphodiester bond at the center of the B. mori R2 protein first- and second-strand nick sites and is negative upstream or positive downstream. The color scheme used here (red for BoMo, orange for DroSi, green for TrCasB, and blue for ZoAl) is maintained throughout the figures. (D) Amino acid sequence alignment of the N-terminal regions of selected D- and A-clade R2 retrotransposons. Black triangles indicate conserved zinc-coordinating residues. Color scheme and characters follow Clustal X convention: an asterisk (*) indicates all residues are identical, a colon (:) indicates conserved substitutions, and a period (.) indicates semi-conserved substitutions. (E) Schematic for N-terminal-region proteins with amino acid numbering. Schematic is not to scale. (F) Coomassie blue-stained sodium dodecyl sulfate-PAGE (SDS-PAGE) gel of N-terminal-region proteins purified from E. coli. For all gel images shown, an unbroken line bounds samples in the same gel that have the same image contrast settings. A dashed line separates lanes of the same gel, sometimes with removal of empty lanes between samples.
Figure 2.
Figure 2.. Clade-specific DNA interaction of R2 protein N-terminal domains
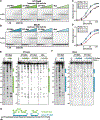
Images of EMSA native PAGE gels. Symbols on the far right indicate migration of free versus bound radiolabeled DNA. The circle represents protein, and the straight lines indicate DNA duplex. An asterisk indicates the radiolabeled strand. NBoMo ZF1-Myb (A) and NDroSi ZF1-Myb (B) were tested with upstream target half-site (−50 to −9) on the left or downstream target half-site (−8 to +34) on the right. NTrCasB ZF3-Myb (C) and NZoAl ZF3-Myb (D) were tested with upstream target half-site (−50 to −1) on the left or downstream target half-site (+1 to +50) on the right.
Figure 3.
Figure 3.. Contribution of D-clade ZF1 and Myb domains to target-site recognition
(A and B) Images of EMSA native PAGE gels. NBoMo proteins (A) and NDroSi proteins (B) were tested with 100-bp duplex target site (−50 to +50). (C and D) Images of denaturing PAGE gels for DNase I footprinting using 100-bp duplex target site (−50 to +50) with NBoMo ZF1-Myb (C) or NDroSi ZF1-Myb (D). G + A denotes a Maxam-Gilbert sequencing ladder with target-site DNA fragmented at guanosines and adenosines. Numbering on the left indicates target-site DNA position using the numbering scheme of Figure 1C. Circles outlined with dashed or solid lines indicate 125 or 625 nM protein, respectively. Regions of protection are indicated to the right of each gel. (E) Schematic of DNase I footprints of NBoMo ZF1-Myb and NDroSi ZF1-Myb. The consensus target site for B. mori and D. simulans is displayed using International Union of Pure and Applied Chemistry (IUPAC) notation.
Figure 4.
Figure 4.. High-affinity target-site binding by A-clade R2 protein ZF1 and Myb domains
(A and B) Images of EMSA native PAGE gels. NTrCasB proteins (A) and NZoAl proteins (B) were tested with upstream target half-site DNA (−50 to −1). (C and D) Quantifications of (A) and (B) with technical replicates (n = 3). The x axis is on a logarithmic scale. Mean ± SEM is plotted. (E and F) Images of denaturing PAGE gels for DNase I footprinting using upstream target half-site DNA (−50 to −1) with NTrCasB proteins (E) or NZoAl proteins (F). See also Figure S1. (G) Schematic of DNase I footprints of NTrCasB Myb and NZoAl ZF1-Myb. The consensus target-site sequence for T. castaneum and Z. albicollis is displayed using IUPAC notation.
Figure 5.
Figure 5.. TPRT dependence on N-terminal ZFs in vitro
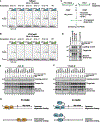
(A) Domain schematic and amino acid numbering for R2 protein versions used in TPRT assays and ZoAl cellular assays. (B) Purified R2 protein versions used for TPRT assays were resolved by SDS-PAGE and visualized by immunoblot with an anti-FLAG antibody. (C) Schematic of TPRT assay. Green strands indicate DNA visualizable by 5′ radiolabeling of the antisense strand. (D) Image from denaturing PAGE of TPRT assay products. TPRT products are indicated with black triangles (1X = cDNA and 2X = cDNA + template jump). (E) Densitometric quantification of TPRT products (1X and 2X cDNA) and first-strand nick products altogether, from the assays in (D) and technical replicates (n = 3). Mean ± SEM is plotted.
Figure 6.
Figure 6.. ZF3-2 contributions to new gene insertion in cells
(A) Top, schematic of transgene insertion assay and downstream workflow. RPE-1, retinal pigment epithelium cell line. Middle, schematic of template RNA encoding the GFP expression cassette. Bottom, schematic of transgene inserted into the 28S rDNA target site. 5′ and 3′ junctions are indicated by brackets. (B) Flow cytometry data for one of three replicates of a parallel set of transgene insertion assays. Cells inside the indicated gating were considered GFP positive. See also Figure S2. (C) Transgene insertion assays. Flow cytometry results are mean ± SEM of three replicates. Bar plot of percentage GFP-positive cells is on the left y axis. Dot plot of average median GFP intensity is on the right y axis; error bars are not visible because the right y axis is on a logarithmic scale. p values for percentage GFP positive comparisons from one-way ANOVA with post hoc Tukey’s multiple comparisons test are indicated above the plot. See also Figures S2 and S3. (D) Bar plot of mean ± SEM of insertion copy number from ddPCR is on the left y axis (n = 4). Copy number is relative to diploid genome content. Dot plot of average percentage full-length insertions with 95% confidence intervals is on the right y axis (n = 4). p values for percentage full-length comparisons from one-way ANOVA with post hoc Tukey’s multiple comparisons test are indicated above the plot. See also Figure S4. (E) Bar plot of the number of onvs. off-target transgene 3′ junctions. (F) Schematic of 5′ junction categories. See also Figure S4. (G) Bar plot of proportion of each type of 5′ junction. Key is to the left under (F). See also Figure S4. (H) Histogram of rDNA positions of transgene 5′ junctions from the “Join” category. Black and gray bars indicate full-length and truncated transgene insertions, respectively. The x axis is linear between −10 and +10 and otherwise on a logarithmic scale. See also Figure S4.
Figure 7.
Figure 7.. ZF3-2 DNA-binding properties and influence on second-strand nicking
(A and B) Images of EMSA native PAGE gels. NZoAl ZF3-2 polypeptide (A) and NTrCasB ZF3-2 polypeptide (B) were tested with −50 to +10 duplex target-site DNA with a scrambled region indicated above the gel. See also Figure S6. (C) Schematic of second-strand nicking assay. Green strands indicate DNA visualizable by 5′ radiolabeling. (D–F) Second-strand nicking position comparison (D) shows similarity across R2 proteins, whereas domain requirements differ for second-strand nicking by ZoAl (E) versus TrCasB (F). (G) Model for DNA interaction by R2 N-terminal domains of D-clade or A-clade retrotransposons. See also Figure S5.

Similar articles

Cited by

References

    1. Bourque G, Burns KH, Gehring M, Gorbunova V, Seluanov A, Hammell M, Imbeault M, Izsvák Z, Levin HL, Macfarlan S, et al. (2018). Ten things you should know about transposable elements. Genome Biol. 19, 199. 10.1186/s13059-018-1577-z. - DOI - PMC - PubMed
    1. Malik HS, Burke WD, and Eickbush TH (1999). The age and evolution of non-LTR retrotransposable elements. Mol. Biol. Evol. 16, 793–805. 10.1093/oxfordjournals.molbev.a026164. - DOI - PubMed
    1. Kapitonov VV, Tempel S, and Jurka J (2009). Simple and fast classification of non-LTR retrotransposons based on phylogeny of their RT domain protein sequences. Gene 448, 207–213. 10.1016/j.gene.2009.07.019. - DOI - PMC - PubMed
    1. Han JS (2010). Non-long terminal repeat (non-LTR) retrotransposons: mechanisms, recent developments, and unanswered questions. Mobile DNA 1, 15. 10.1186/1759-8753-1-15. - DOI - PMC - PubMed
    1. Bao W, Kojima KK, and Kohany O (2015). Repbase Update, a database of repetitive elements in eukaryotic genomes. Mobile DNA 6, 11. 10.1186/s13100-015-0041-9. - DOI - PMC - PubMed

Publication types