. 2024 May 21;121(21):e2318874121.
doi: 10.1073/pnas.2318874121. Epub 2024 May 16.

Essential role of N-terminal SAM regions in STIM1 multimerization and function

Affiliations

Essential role of N-terminal SAM regions in STIM1 multimerization and function

Matthias Sallinger et al. Proc Natl Acad Sci U S A. .

Abstract

The single-pass transmembrane protein Stromal Interaction Molecule 1 (STIM1), located in the endoplasmic reticulum (ER) membrane, possesses two main functions: It senses the ER-Ca2+ concentration and directly binds to the store-operated Ca2+ channel Orai1 for its activation when Ca2+ recedes. At high resting ER-Ca2+ concentration, the ER-luminal STIM1 domain is kept monomeric but undergoes di/multimerization once stores are depleted. Luminal STIM1 multimerization is essential to unleash the STIM C-terminal binding site for Orai1 channels. However, structural basis of the luminal association sites has so far been elusive. Here, we employed molecular dynamics (MD) simulations and identified two essential di/multimerization segments, the α7 and the adjacent region near the α9-helix in the sterile alpha motif (SAM) domain. Based on MD results, we targeted the two STIM1 SAM domains by engineering point mutations. These mutations interfered with higher-order multimerization of ER-luminal fragments in biochemical assays and puncta formation in live-cell experiments upon Ca2+ store depletion. The STIM1 multimerization impeded mutants significantly reduced Ca2+ entry via Orai1, decreasing the Ca2+ oscillation frequency as well as store-operated Ca2+ entry. Combination of the ER-luminal STIM1 multimerization mutations with gain of function mutations and coexpression of Orai1 partially ameliorated functional defects. Our data point to a hydrophobicity-driven binding within the ER-luminal STIM1 multimer that needs to switch between resting monomeric and activated multimeric state. Altogether, these data reveal that interactions between SAM domains of STIM1 monomers are critical for multimerization and activation of the protein.

Keywords: EF-SAM; Orai; SOCE; STIM.


Conflict of interest statement

Competing interests statement:The authors declare no competing interest.

Figures
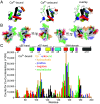
Fig. 1.
Fig. 1.
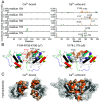
Molecular dynamics simulations of ER-luminal STIM1 dimerization. (A) Structural representation of ER-luminal hSTIM1 [PDB:2K60 (22)] in the Ca2+-bound state (Left), Ca2+ unbound (Middle), and their overlay (Right) depicted from MD simulations (30, 31). (B) Representative MD simulation snapshots of two ER-luminal STIM1 monomers (starting configuration as in a Middle image) in 0.15 M KCl environment, after 30 ns and 60 ns simulation time, respectively. (C) Histogram of residue–residue contact counts for Ca2+-bound (in black) and Ca2+-unbound STIM1 (in color code) summarized from three different starting configurations after two simulation runs each. Counts were based on calculated distances between the Cα of a residue in one monomer and the Cα of the residues in the other monomer with a cut-off radius of 10Å during 200 ns simulation time. Helices are represented as cylinders in MD snapshots (A) and (B) in a color code corresponding to the schematic shown in (C).
Fig. 2.
Fig. 2.
Identification of luminal STIM1 multimerization sites. (A) Histogram of residues intermolecular interactions (monomer A in orange and monomer B in green) with a cut-off radius of 3Å during 200 ns simulation time, specifically focused on F154, R155, K156 (in α7), and V178, L179 (the adjacent region near α9) for MD simulations as in Fig. 1C for Ca2+ bound (Left) and Ca2+-unbound (Right) STIM1 simulations. (B) Representative MD simulation snapshots of preferential residue–residue contact sites including F154, R155, K156 (Left), and V178 and L179 (Right). (C) Hydrophobic surface representation of two Ca2+ bound STIM1 monomers (Left) and Ca2+-unbound STIM1 dimer (Right) with residues F154, R155, and K156 highlighted in both cases in the left monomer and V178, L179 in the right monomer. Graduating hydrophobicity is represented in different color intensities (dark high, bright low).
Fig. 3.
Fig. 3.
Alanine mutations in α7 and α9 affect STIM1 cluster formation. (A) Representative TIRFM images of CFP-tagged STIM1-wild-type (WT), F154A-R155A-K156A (α7), and V178A-L179A (α9) proteins expressed in HEK293 cells. Images were taken at resting state (Upper) and after treatment with 25 µM CPA (Lower). (B) TIRFM data representing total puncta intensity per cell after addition of 25 µM CPA (added at 60 s time point) in 1 mM Ca2+ solution for HEK293 cells expressing STIM1-WT (n = 42), STIM1-α7 (n = 30), and STIM1-α9 (n = 35). (C and D) Representative images of STIM1 homomerization FRET experiments and (D) mean values in HEK293 cells expressing C-terminally CFP-/YFP-tagged STIM1-WT (rest: n = 41; TG: n = 62), STIM1-α7 (rest: n = 37; TG: n = 47), and STIM1-α9 (rest: n = 43; TG: n = 58) in response to 1 µM Thapsigargin (TG). (E) Histogram of residue–residue contact counts for MD simulations with two STIM1 Ca2+-unbound WT forms (in black), STIM1-α7 (in red), and STIM1-α9 (in blue) summarized from three different starting configurations after two simulation runs each. Counts were based on calculated distances between the Cα of a residue in one monomer and the Cα of the residues in the other monomer with a cut-off radius of 10Å during 200 ns simulation time.
Fig. 4.
Fig. 4.
Quaternary, secondary structure, and thermal stability of STIM1 EF-SAM WT, α7-, and α9-mutant. (AC) Representative SEC with in-line MALS data of STIM1-EF-SAM-WT (A), α7 (B), and α9 (C) acquired in the absence (solid line) and presence of 5 mM CaCl2 (dotted line). (DF) Far-UV CD Spectra of STIM1-EF-SAM-WT (D), α7 (E), α9 (F) in the absence (solid line) and presence of CaCl2 (dotted line) acquired at 20 °C. (G and H) Comparison of the STIM1-EF-SAM-WT and mutants thermal melts based on the fractional change in ellipticity at 225 nm as a function of temperature in the presence (G) and absence of CaCl2 (H). Far UV-CD spectra were acquired at 20 °C after sequential additions of CaCl2 up to a final concentration of 25 mM. (I) The fractional change in ellipticity at 225 nm was plotted versus total divalent cation concentration to construct the binding curves. The equilibrium dissociation constants (Kd) were estimated using a one-site binding model that accounts for protein concentration, fit to the data by nonlinear regression. Inset shows Kd values for WT, α7-, and α9-mutants.
Fig. 5.
Fig. 5.
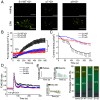
Effects of N-terminal STIM1-α7 and -α9 activation on functional Ca2+ signaling upon Orai1 overexpression. (A and B) Representative TIRFM images (A) and (B) time course of TIRF experiments representing increasing total cumulative STIM1 puncta intensity per cell after addition of 25 µM CPA (added at 60 s time point) in HEK293 cells expressing CFP-STIM1-WT (n = 68), STIM1-α7 (n = 49), and STIM1-α9 (n = 73) together with Orai1-YFP. In (A) CFP-STIM1 proteins depicted in red and Orai1-YFP in green at resting state (Upper) and after treatment with 25 µM CPA (Lower). (C) Time course of whole-cell patch-clamp recordings showing inward currents at −74 mV activated by passive store depletion of HEK293 cells by 20 mM EGTA in the pipette solution. HEK293 cells were coexpressing CFP-Orai1-WT together with YFP-STIM1-WT (n = 17), STIM1-α7 (n = 13), or STIM1-α9 (n = 14). (D) Time course of Fura 2 measurements in HEK293 cells overexpressing CFP-STIM1-WT (n = 493) STIM1-α7 (n = 185), STIM1-α9 (n = 312), or untransfected cells (control) (n = 1,936) upon stimulation using 100 µM Carbachol (CCh) in 1 mM Ca2+ containing solution. (E) Data presented for different intracellular Ca2+ [Ca2+]i patterns (Release only in gray, baseline oscillations turquoise, and elevated oscillations olive) are shown representatively (Left). Bar graphs indicate the proportion of cell population displaying these various patterns of [Ca2+]i changes in HEK293 cells overexpressing CFP-STIM1-WT (n = 486) STIM1-α7 (n = 118), STIM1-α9 (n = 238), or untransfected cells (control) (n = 1,836) upon stimulation using 100 µM Carbachol (CCh) in 1 mM Ca2+ containing solution.
Fig. 6.
Fig. 6.
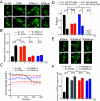
Functional effects of SAM mutants on constitutively active STIM mutants. (A and B) Confocal fluorescence images (A) and average STIM1 clusters per cell (B) for HEK293 cells expressing CFP-STIM1-WT (rest: n = 81; TG: n = 67), CFP-STIM1-D76A (rest: n = 19; TG: n = 31), CFP-STIM1-D76A-α7 (rest: n = 31; TG: n = 49), and CFP-STIM1-D76A-α9 (rest: n = 40; TG: n = 39) at resting conditions and after addition of 1 µM TG. (C) Time course of whole-cell patch-clamp experiments showing inward currents at −74 mV activated by passive store depletion of HEK293 cells with 20 mM EGTA in the pipette solution. HEK293 cells were coexpressing CFP-Orai1-WT and YFP-STIM1-WT (n = 4), STIM1-D76A (n = 7) STIM1-D76A-α7 (n = 5) or STIM1-D76A-α9 (n = 5). (D) Bar graphs representing Pearson correlation value (R-factor) of CFP-STIM1-1-343 and YFP-CAD colocalization experiments in HEK293 cells expressing N-terminally tagged CFP-STIM1-WT (rest: n = 37; TG: n = 40), STIM1-α7 (rest: n = 34; TG: n = 29), STIM1-α9 (rest: n = 39; TG: n = 38), and STIM1-H72R (rest: n = 27; TG: n = 36) in dependence of 1 µM TG treatment. (E and F) Confocal fluorescence microscopy images (E) and mean values of number of puncta per cell (F) before and after addition of 1 µM TG for HEK293 cells expressing CFP-STIM1-WT (rest: n = 81; TG: n = 67), CFP-STIM1-R304W (rest: n = 29; TG: n = 38), CFP-STIM1-R304W-α7 (rest: n = 33; TG: n = 38), and CFP-STIM1-R304W-α9 (rest: n = 37; TG: n = 32).

References

    1. Brini M., Ottolini D., Cali T., Carafoli E., Calcium in health and disease. Met Ions Life Sci. 13, 81–137 (2013). - PubMed
    1. Berridge M. J., Bootman M. D., Roderick H. L., Calcium signalling: Dynamics, homeostasis and remodelling. Nat. Rev. Mol. Cell Biol. 4, 517–529 (2003). - PubMed
    1. Prakriya M., Lewis R. S., Store-operated calcium channels. Physiol. Rev. 95, 1383–1436 (2015). - PMC - PubMed
    1. Putney J. W. Jr., A model for receptor-regulated calcium entry. Cell Calcium 7, 1–12 (1986). - PubMed
    1. Emrich S. M., Yoast R. E., Trebak M., Physiological functions of CRAC channels. Annu. Rev. Physiol. 84, 355–379 (2022). - PubMed

LinkOut - more resources