. 2024 May 21;121(21):e2316799121.
doi: 10.1073/pnas.2316799121. Epub 2024 May 16.

Peripheral preprocessing in Drosophila facilitates odor classification

Affiliations

Peripheral preprocessing in Drosophila facilitates odor classification

Palka Puri et al. Proc Natl Acad Sci U S A. .

Abstract

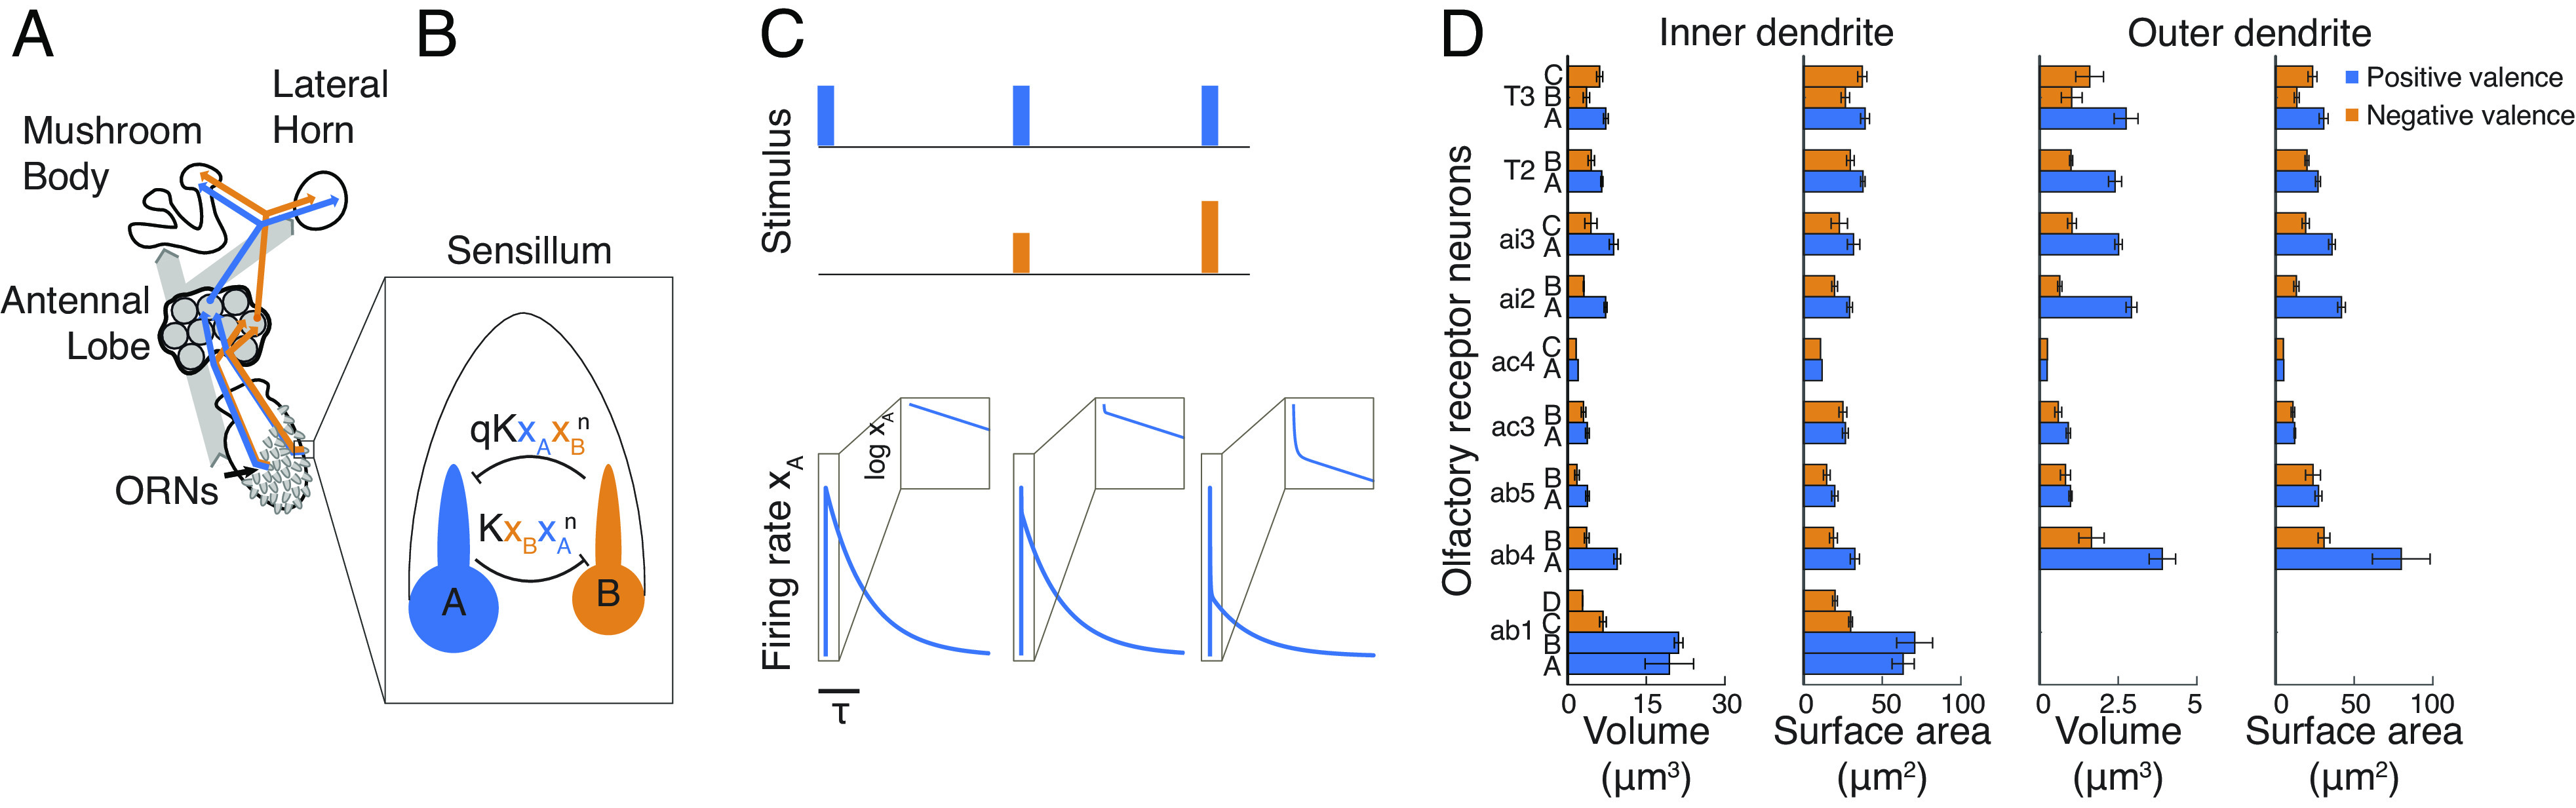
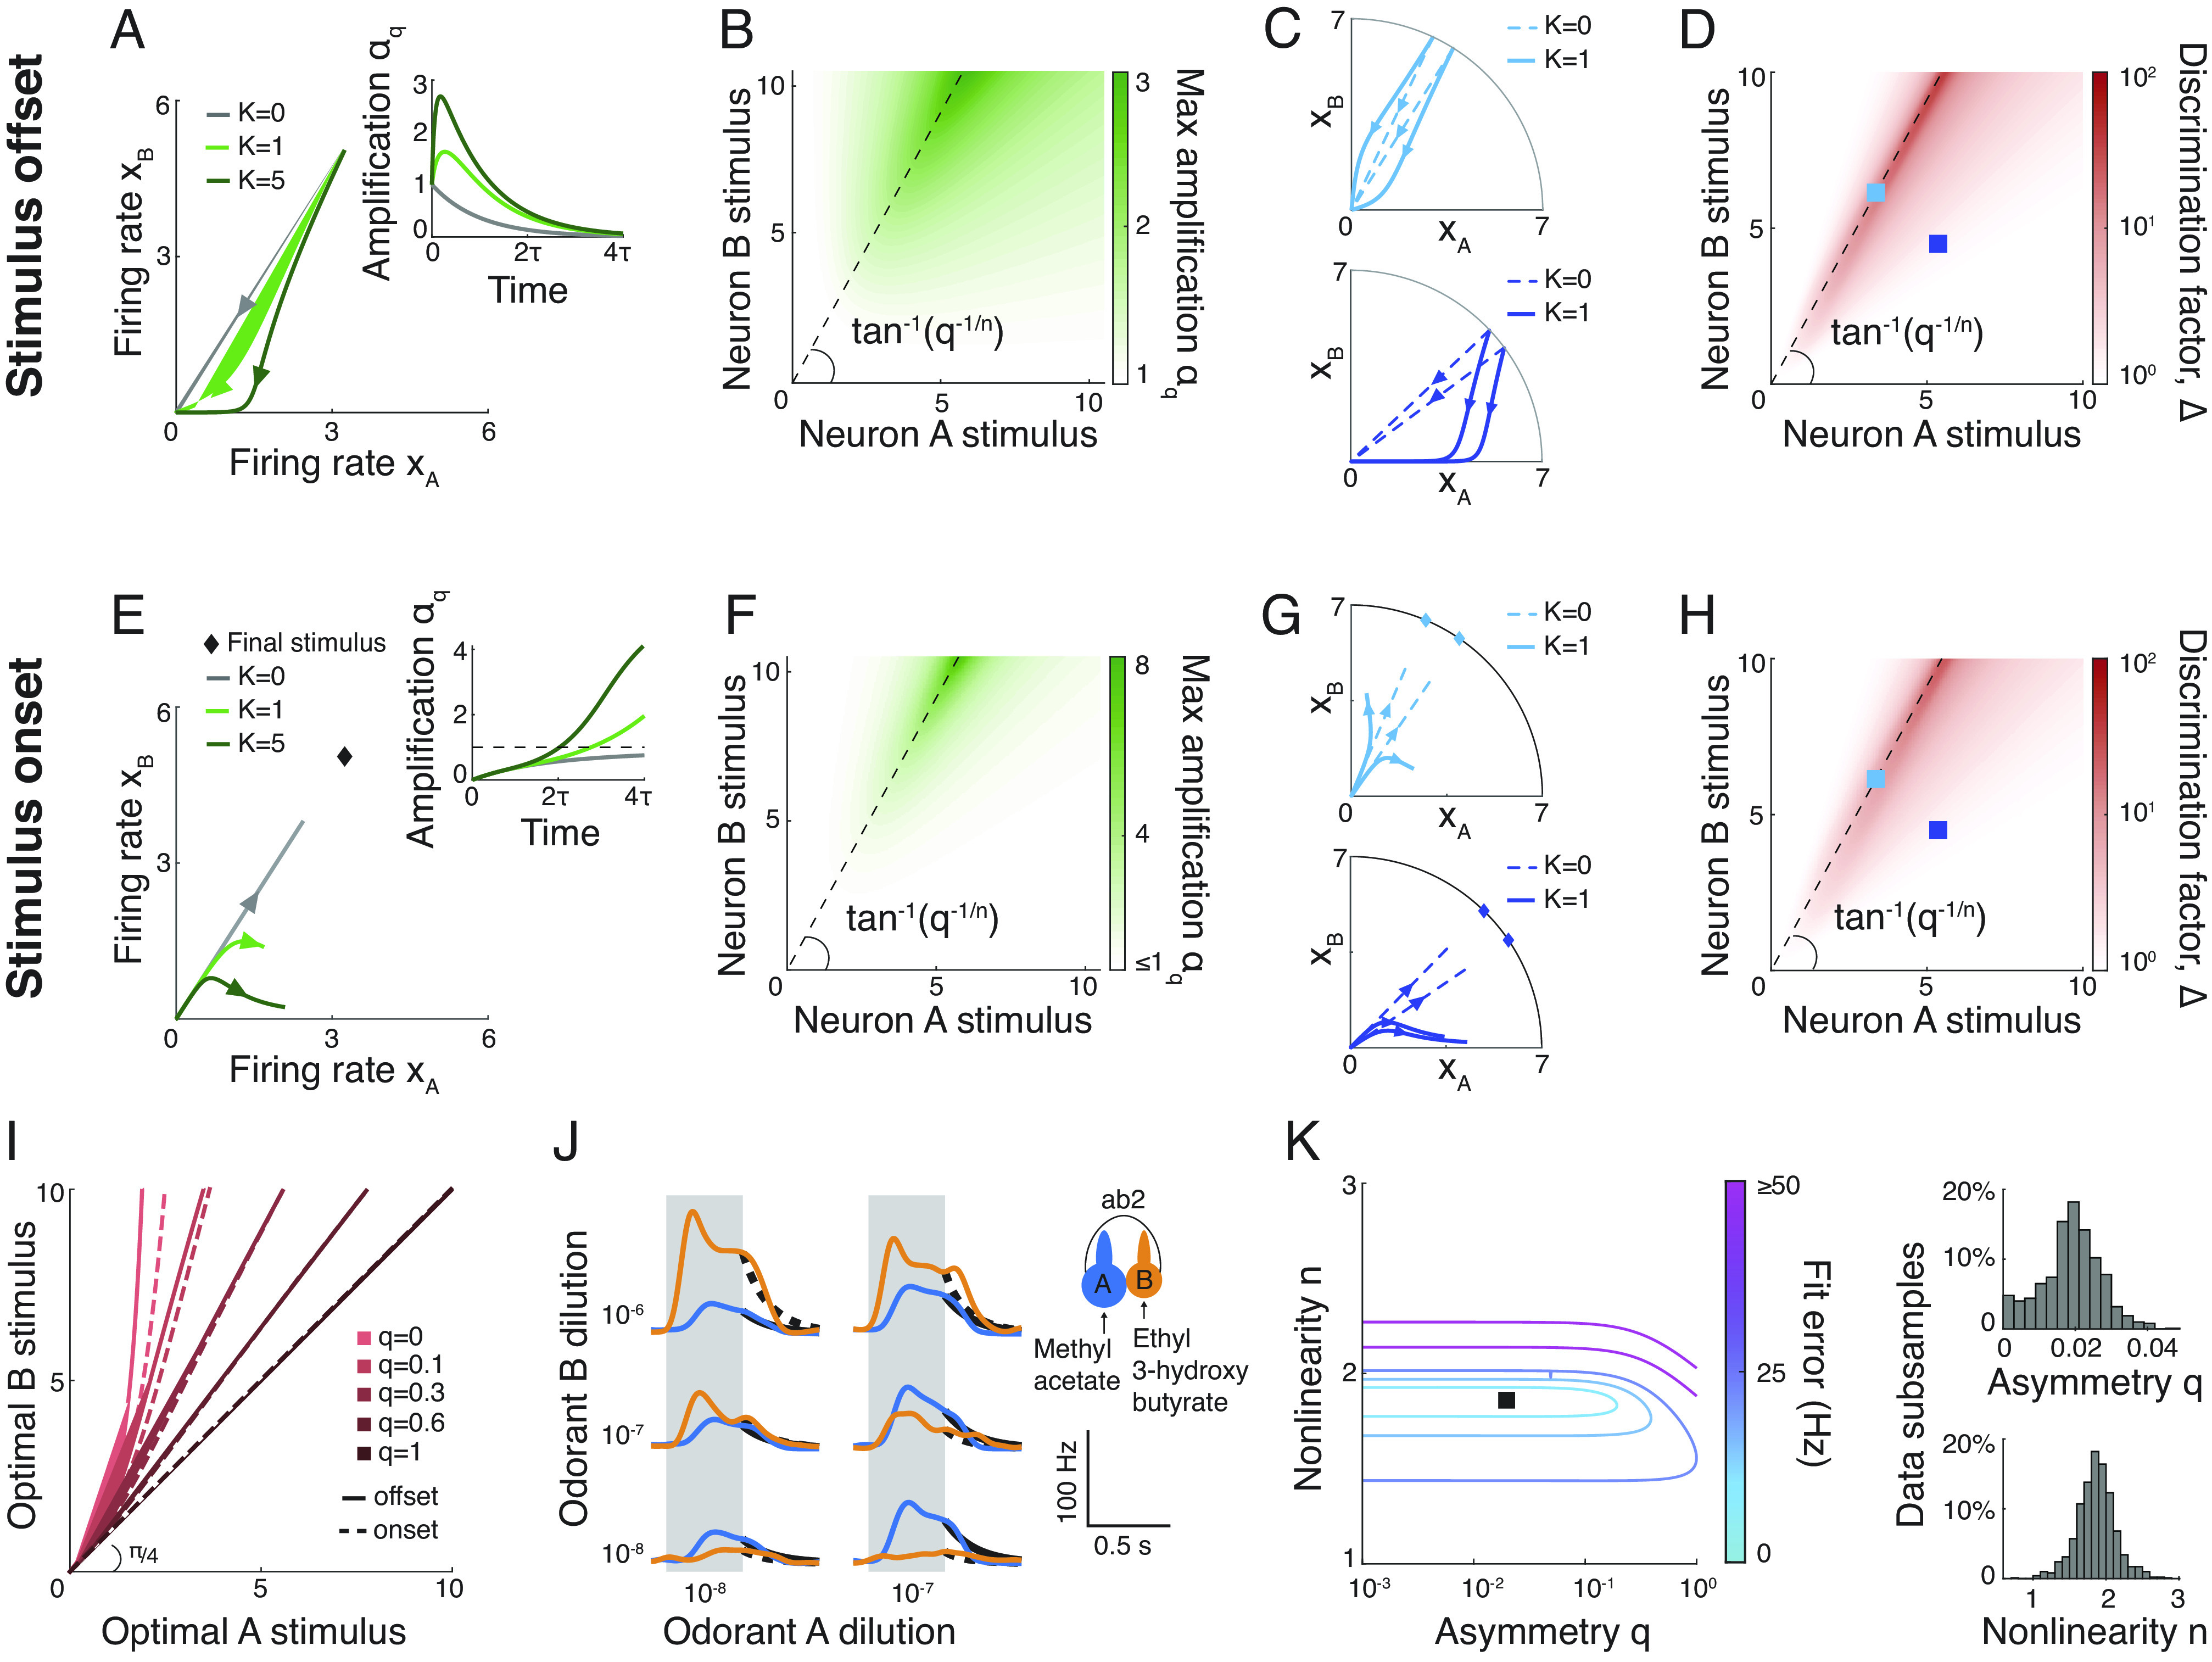
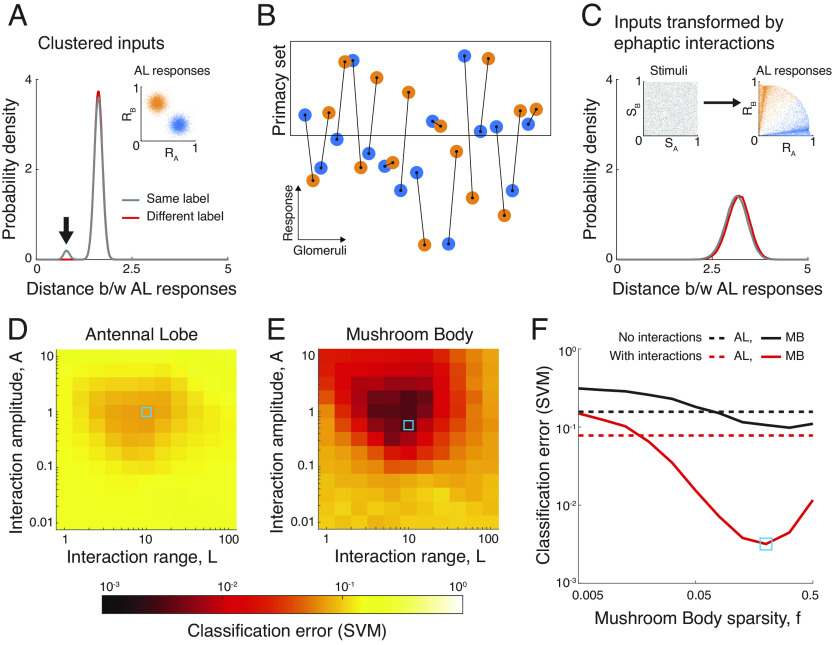
The mammalian brain implements sophisticated sensory processing algorithms along multilayered ("deep") neural networks. Strategies that insects use to meet similar computational demands, while relying on smaller nervous systems with shallow architectures, remain elusive. Using Drosophila as a model, we uncover the algorithmic role of odor preprocessing by a shallow network of compartmentalized olfactory receptor neurons. Each compartment operates as a ratiometric unit for specific odor-mixtures. This computation arises from a simple mechanism: electrical coupling between two differently sized neurons. We demonstrate that downstream synaptic connectivity is shaped to optimally leverage amplification of a hedonic value signal in the periphery. Furthermore, peripheral preprocessing is shown to markedly improve novel odor classification in a higher brain center. Together, our work highlights a far-reaching functional role of the sensory periphery for downstream processing. By elucidating the implementation of powerful computations by a shallow network, we provide insights into general principles of efficient sensory processing algorithms.

Keywords: Drosophila; connectome; olfaction; sensory periphery; shallow neural network.


Conflict of interest statement

Competing interests statement:The authors declare no competing interest.

Figures

Fig. 1.
Fig. 1.
Nonlinear model of peripheral ephaptic interactions. (A) Illustration of olfactory information flow in fruitflies. (B) Peripheral signal preprocessing is mediated by ephaptic interactions between cohoused ORNs, wherein the neuronal firing rates (xA,xB) are nonlinearly coupled. Model parameters K,q,n denote interaction strength, asymmetry, and nonlinearity, respectively. (C) Analytical solutions of the response of neuron A (Bottom) following offset of three different stimuli (Top). Here, the strength of the A odorant (blue) is constant, while the strength of the B odorant (orange) increases. Activating neuron B leads to suppression of neuron A’s response. Insets: Firing rate response on log scale illustrates a two-phase decay of the response to 0. (D) Valence (color) of cohoused ORNs matches the size asymmetry of their dendrites (adapted from ref. 14). Note that outer dendrite measurements for the ab1 sensillum were not performed in ref. .
Fig. 2.
Fig. 2.
Ephaptic interactions transiently amplify odor valence. (A) Firing-rate trajectories following stimulus offset for different values of interaction strength K. Inset: Corresponding valence amplification αq(t). In the presence of ephaptic interactions, valence is transiently amplified (αq(t)>1). (B) Magnitude of valence amplification following stimulus offset [peak of αq(t)] as a function of the stimuli SA,SB. Amplification is stimulus-specific: maximal amplification is achieved for stimuli close to neutral (dashed line). (C) Example firing-rate trajectories in the presence of ephaptic interactions (K=1, solid). Top: Stimuli close to neutral, i.e., “weak” valence signal (light blue). Bottom: strongly positive stimuli (dark blue). Firing rates follow straight lines in the absence of interactions (K=0, dashed). Light blue trajectories are transiently separated, while dark blue trajectories collapse onto each other. (D) Discrimination factor Δ (SI Appendix, §1.C) is maximal for neutral combinations of SA,SB (dashed line). Large Δ implies improvement in stimulus discriminability based on transient firing rates. Squares indicate stimuli in (C). (EH) Same as (AD), for stimulus onset (linear ramp up, final value at T=4τ indicated by diamond in panels E and G). (I) Curves of optimal stimuli (with largest Δ) for stimulus offset (solid) and onset (dashed). Optimal stimuli depend strongly on the interaction asymmetry q. (J) Electrophysiological recordings of ORNs in the ab2 sensillum, probed with different odorant mixtures (data from ref. 12) that were fit to the model (SI Appendix, §1.E). Gray shade: odor presentation epoch. Black lines (solid: ab2A, dashed: ab2B) show model predictions following stimulus offset. (K) Fitting error for ab2 as a function of interaction asymmetry and nonlinearity parameters (Left). Best-fit values, q=0.019±0.007,n=1.9±0.26 (mean ± SD, black square). SD obtained by subsampling trials (Right). For (AH), q=0.3, n=2, K=1 (in units of τn), unless noted otherwise.
Fig. 3.
Fig. 3.
AL-to-LH projections are structured to compute amplified stimulus valence. (A) Variance explained by principal components (PCs) of the empirical AL-to-LH connectivity matrix (red) and shuffles (black, error bars indicate 95% CI). Inset: PC1 coefficients of uPN-types, colored by the valence of their presynaptic ORN inputs (13). uPNs are ordered by the sensilla organization of the presynaptic ORNs (SI Appendix, Table S1). uPN-types 26–29 each innervate a single glomerulus which is postsynaptic to two ORN-types. (B) Left: Distributions of PC1 coefficients for positive- and negative-valence uPN-types, and the best-fit gamma distributions (black) for the empirical connectivity (SI Appendix, §2.C). Right: The average PC1 coefficient and gamma distribution shape parameter (κ) obtained from 100 subsamples of positive-valence, negative-valence, and randomly selected uPN-types (blue, orange, and gray, respectively; see SI Appendix, §2.C). Black lines show average over subsamples. The distribution of PC1 coefficients for negative- and positive-valence uPN-types respectively correspond to a shape parameter κ<1 and κ>1. P-values based on one-sided Student’s t test. (C) Same as (B) for PC1 coefficients obtained from type-1 shuffled connectivity matrices (104 shuffles, 100 subsamples each). The difference between the mean PC1 coefficient for positive- and negative-valence uPN-types is statistically significant but is two orders of magnitude smaller than that seen in the empirical data (SI Appendix, §2.C). The shape parameter κ>1 for all distributions. Overall, there is a lack of bias between positive and negative uPN-types in the shuffled connectivity. (D) Pearson’s χ2 independence test for PC1 coefficients of individual uPNs. PC1 coefficients of uPNs postsynaptic to coupled, behaviorally antagonistic ORNs (circles, n=124). Colors: Difference between the empirical and expected number of data points in each bin, used to calculate the χ2 statistic (SI Appendix, §2.E and Fig. S9 for other bin sizes). (E) Distribution of χ2 statistic obtained under the null hypothesis of statistical independence of PC1 coefficient pairs (SI Appendix, §2.E). The empirical χ2 statistic is significantly larger, indicating statistical dependencies between readout weights of uPNs postsynaptic to coupled ORNs. (F) Illustration of definition of PC1 readout angle θ. (G) PC1 readout angles of paired uPN-types versus ratios of three dendritic measurements of the corresponding ORN pairs, and a compound morphometric ratio (red, SI Appendix, §2.F). The quantities are positively correlated. Insets: Analogous correlation values for random pairs of positive- and negative-valence ORNs are significantly smaller than that for empirical ORN pairs (SI Appendix, §2.F). P-values computed using distribution percentiles. P < 0.05, ∗∗P < 0.01, ∗∗∗P < 0.001.
Fig. 4.
Fig. 4.
Ephaptic interactions improve odor classification in the MB. (A) Distance between stimuli (in N=50 dimensional response space) with the same (gray) or different (red) labels under the assumption of clustered AL responses. Stimuli with the same label are closer, as indicated by the peak in the gray distribution (black arrow). Inset: 2D illustration of clustered AL responses. (B) Model of primacy coding in the AL. Glomeruli with the largest responses constitute the primacy set for the stimulus, and determine the stimulus label. Black lines indicate glomeruli corresponding to ephaptically coupled ORNs. (C) Same as (A) for uniformly distributed stimuli that are transformed by ephaptic interactions and assigned a label based on the primacy set. Stimuli with the same or different labels have similar distance distributions (see also SI Appendix, Fig. S12). (D) Classification error of a support-vector machine (SVM) based on AL responses (SI Appendix, §3.D), as a function of the ephaptic interaction parameters. The optimal parameter combination leads to modest improvements. (E) Same as (D) for MB responses (i.e., following random expansion and sparsification, sparsity f=0.2). Here, ephaptic interactions result in marked improvements (note the logarithmic color scale). (F) SVM classification error as a function of the sparsity of MB responses f. In the absence of ephaptic interactions (black curves), expansion and sparsification in MB does not result in a significant improvement in classification performance. See SI Appendix for simulation details.

Update of

Similar articles

Cited by

References

    1. Celani A., Villermaux E., Vergassola M., Odor landscapes in turbulent environments. Phys. Rev. X 4, 041015 (2014).
    1. Reddy G., Murthy V. N., Vergassola M., Olfactory sensing and navigation in turbulent environments. Annu. Rev. Condens. Matter Phys. 13, 191–213 (2022).
    1. Merel J., Botvinick M., Wayne G., Hierarchical motor control in mammals and machines. Nat. Commun. 10, 5489 (2019). - PMC - PubMed
    1. Siegle J. H., et al. , Survey of spiking in the mouse visual system reveals functional hierarchy. Nature 592, 86–92 (2021). - PMC - PubMed
    1. Su C. Y., Menuz K., Reisert J., Carlson J. R., Non-synaptic inhibition between grouped neurons in an olfactory circuit. Nature 492, 66–71 (2012). - PMC - PubMed