. 2024 May 21;121(21):e2400679121.
doi: 10.1073/pnas.2400679121. Epub 2024 May 16.

How total mRNA influences cell growth

Affiliations

How total mRNA influences cell growth

Ludovico Calabrese et al. Proc Natl Acad Sci U S A. .

Abstract

Experimental observations tracing back to the 1960s imply that ribosome quantities play a prominent role in determining a cell's growth. Nevertheless, in biologically relevant scenarios, growth can also be influenced by the levels of mRNA and RNA polymerase. Here, we construct a quantitative model of biosynthesis providing testable scenarios for these situations. The model explores a theoretically motivated regime where RNA polymerases compete for genes and ribosomes for transcripts and gives general expressions relating growth rate, mRNA concentrations, ribosome, and RNA polymerase levels. On general grounds, the model predicts how the fraction of ribosomes in the proteome depends on total mRNA concentration and inspects an underexplored regime in which the trade-off between transcript levels and ribosome abundances sets the cellular growth rate. In particular, we show that the model predicts and clarifies three important experimental observations, in budding yeast and Escherichia coli bacteria: i) that the growth-rate cost of unneeded protein expression can be affected by mRNA levels, ii) that resource optimization leads to decreasing trends in mRNA levels at slow growth, and iii) that ribosome allocation may increase, stay constant, or decrease, in response to transcription-inhibiting antibiotics. Since the data indicate that a regime of joint limitation may apply in physiological conditions and not only to perturbations, we speculate that this regime is likely self-imposed.

Keywords: biosynthesis; cell growth; mRNA; transcription; translation.


Conflict of interest statement

Competing interests statement:The authors declare no competing interest.

Figures
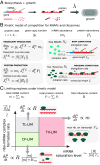
Fig. 1.
Fig. 1.
Illustration of the cell growth model including resource allocation and transcription. (A) The model predicts cellular growth rates taking into account translation and transcription. (B) In the model, transcription, and translation are treated on the same footing (transcript and protein production boxes). The core of the model is encoded in the transcript flux per gene and the protein flux per gene. These fluxes are determined by the respective initiation and elongation rates, which describe the recruitment of RNA polymerases and ribosomes. In the model, different gene types compete for recruiting free RNA polymerases (“RNAP competition” box) and transcripts compete for free ribosomes (ribosome competition box). Consequently, the synthesis of all proteins is coupled through the availability of RNA polymerases and ribosomes. (C) Qualitative sketch of the different expected regimes of growth. Our model focuses on the regime in which growth is driven by both ribosome levels and mRNA concentration (green region). In this regime, the formation of the ribosome–mRNA complex is the limiting step (complex-formation limiting regime, CF-LIM). Instead, if translation or transcription alone is the limiting step, protein production depends only on either the number of ribosomes (translation-limited regime TL-LIM) or the number of mRNAs (transcription-limited regime TX-LIM), according to the level of mRNA saturation by ribosomes (see gray and red regions).
Fig. 2.
Fig. 2.
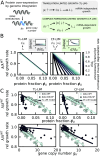
If formation of the ribosome–mRNA complex is limiting, mRNA levels contribute to the protein expression cost. (A) The expression cost of an unneeded protein was probed experimentally in refs. and by integrating into the genome highly expressed unnecessary genes (possibly in multiple copies), labeled by U. In the CF-LIM regime, mRNA concentration [m] can either increase or decrease, while the ribosomal protein fraction ϕR always decreases and the growth rate drops. (B) The model predicts a drop in growth rate (quantified by the relative growth rate λ/λWT) as a function of protein fraction ϕU of the unnecessary proteins, and how such trend changes as the degradation rate of the unnecessary transcript dU varies (Right panel, where d/dU is the inverse degradation rate of the unnecessary transcript normalized to the average degradation rate of the other transcripts). The Left panel shows the prediction in TL-LIM. The Right panel shows the prediction in the CF-LIM regime. Above the two plots, the shaded boxes show how the slopes of the curve λ/λWTϕU change with d/dU under translation limitation and complex-formation limitation respectively. (C) S. cerevisiae data from ref. falsify a scenario of translation-limited growth and show the trends predicted by the CF-LIM regime. The Left panel shows the comparison between the data (circles) and a TL-LIM model (solid lines) plotted both as a function of ϕU (Top) and gene copy number gU (Bottom). Light-gray circles represent data corresponding to stable transcripts (d/dU1). Dark-gray circles represent unstable transcripts (d/dU0.08). Dark- and light-gray lines are model curves for the two conditions. The light gray is obtained by fitting the model, while the light gray solid lines are a prediction of the model. The Right panels show the comparison between the data (circles) and our model of the complex-formation limiting regime (CF-LIM, solid lines), using the same color code. The gene copy-number predictions reported here refer to the presence of RNAP homeostasis; see SI Appendix, Fig. S4.
Fig. 3.
Fig. 3.
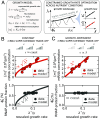
The mRNA levels that maximize growth rate vary across nutrient conditions. (A) The model predicts proteome composition and mRNA levels across nutrient conditions under the assumption that RNA polymerase (RNAP) allocation optimizes growth rate. The Left panel illustrates the basic mathematical ingredients of the model, including the dependency of the growth rate on ribosomes and RNAPs, as well as the flux-balance constraint between protein-precursors metabolism and the production of housekeeping proteins. The Right panel shows how the model ingredients lead to a nutrient-dependent growth “landscape” where the growth rate is a bell-shaped function of RNAP levels. By taking the maximum of the curve, the model predicts the optimal RNAP and mRNA levels. Such predictions can take the form of a growth law (10) by plotting such levels against the corresponding optimal growth rate. (B) Under growth-rate optimization and constant mRNA supply–demand trade-off ϵ across nutrient conditions, the model predicts that both the total mRNA concentration (Upper panel, orange solid line) and the fraction of RNAP proteins in the proteome (Lower panel, gray solid line) increase as the square root of the growth rate. (C) When growth-rate optimization is combined with the constraint of a trade-off parameter ϵ linearly increasing with growth rate (motivated by the data), the model predicts that the total mRNA concentration increases linearly with the growth rate (Upper panel, orange solid line) while the fraction of RNAP proteins remains constant (Lower panel, gray solid line). Both panels (B and C) show E. coli mRNA and RNAP data from ref. across nutrient conditions (orange and gray circles), validating the scenario of increasing transcriptional activity (panel C) for this model organism.
Fig. 4.
Fig. 4.
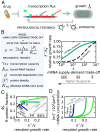
The predicted response to transcription-targeting drugs entails upregulation of the RNA polymerase sector, but not necessarily of ribosomes. All the predictions refer to the CF-LIM regime. (A) Transcription-targeting drugs affect growth directly, but the overall effect also depends on the physiological response of the cell to reduced transcriptional capacity. Our model predicts ribosome- and RNA polymerase- (RNAP) allocation rearrangements under transcription inhibitors. (B) The gray box illustrates the model expression for the transcription-translation trade-off ϵ, i.e., the ability of RNAP to produce mRNA (Fig. 3A). This effective parameter combines several quantities, including the transcription elongation rate of RNAP on genes, the fraction of gene-bound RNAPs, and the mean lifetime of transcripts. The model predicts that drugs attacking any of these parameters modify the way mRNA level affects growth rate only through changes in ϵ. The plot shows the growth rate reduction vs. ϵ under growth-optimized (continuous blue line) and nonoptimized (gray dashed line) conditions. Note that λ0 is the growth rate in the unperturbed condition. Proteome rearrangement optimizing growth rate “rescues” the growth rate decrease under transcription inhibition (reduction of ϵ). (C) The predicted ribosomal proteome fraction ϕR under growth optimization changes as transcription is inhibited (ϵ reduced). Solid lines of different colors indicate different nutrient conditions with darker colors representing poorer media. Importantly, the qualitative trend depends on the nutrient quality. Symbols are experimental data points from ref. . (D) The model prediction for mRNA concentration [m] changes as ϵ decreases under optimal allocation. Different solid lines indicate different nutrient conditions, with darker colors representing poorer media.

Similar articles

Cited by

References

    1. Neidhardt F. C., Magasanik B., Studies on the role of ribonucleic acid in the growth of bacteria. Biochim. Biophys. Acta 42, 99–116 (1960). - PubMed
    1. Koch A. L., Why can’t a cell grow infinitely fast? Can. J. Microbiol. 34, 421–426 (1988). - PubMed
    1. Zhu J., Thompson C. B., Metabolic regulation of cell growth and proliferation. Nat. Rev. Mol. Cell Biol. 20, 436–450 (2019). - PMC - PubMed
    1. Bremer H., Dennis P. P., Modulation of chemical composition and other parameters of the cell at different exponential growth rates. EcoSal Plus 3 (2008). - PubMed
    1. Dennis P. P., Bremer H., Macromolecular composition during steady-state growth of Escherichia coli B-r. J. Bacteriol. 119, 270–281 (1974). - PMC - PubMed

MeSH terms