. 2024 May 16;19(5):e0300787.
doi: 10.1371/journal.pone.0300787. eCollection 2024.

Muscle Psn gene combined with exercise contribute to healthy aging of skeletal muscle and lifespan by adaptively regulating Sirt1/PGC-1α and arm pathway

Affiliations

Muscle Psn gene combined with exercise contribute to healthy aging of skeletal muscle and lifespan by adaptively regulating Sirt1/PGC-1α and arm pathway

Ying-Hui Gao et al. PLoS One. .

Abstract

The Presenilin (Psn) gene is closely related to aging, but it is still unclear the role of Psn genes in skeletal muscle. Here, the Psn-UAS/Mhc-GAL4 system in Drosophila was used to regulate muscle Psn overexpression(MPO) and muscle Psn knockdown(MPK). Drosophila were subjected to endurance exercise from 4 weeks to 5 weeks old. The results showed that MPO and exercise significantly increased climbing speed, climbing endurance, lifespan, muscle SOD activity, Psn expression, Sirt1 expression, PGC-1α expression, and armadillo (arm) expression in aged Drosophila, and they significantly decreased muscle malondialdehyde levels. Interestingly, when the Psn gene is knockdown by 0.78 times, the PGC-1α expression and arm expression were also down-regulated, but the exercise capacity and lifespan were increased. Furthermore, exercise combined with MPO further improved the exercise capacity and lifespan. MPK combined with exercise further improves the exercise capacity and lifespan. Thus, current results confirmed that the muscle Psn gene was a vital gene that contributed to the healthy aging of skeletal muscle since whether it was overexpressed or knocked down, the aging progress of skeletal muscle structure and function was slowed down by regulating the activity homeostasis of Sirt1/PGC-1α pathway and Psn/arm pathway. Exercise enhanced the function of the Psn gene to delay skeletal muscle aging by up regulating the activity of the Sirt1/PGC-1α pathway and Psn/arm pathway.


Conflict of interest statement

The authors have declared that no competing interests exist.

Figures

Fig 1
Fig 1. Effects of MPO on muscle function and mean lifespan in Drosophila.
(A) Climbing height changed with age in Drosophila. (B) Climbing the height of 1-week-old Drosophila in 3 seconds. (C) Climbing the height of 3-week-old Drosophila in 3 seconds. (D) Climbing the height of 4-week-old Drosophila in 3 seconds. (E) Climbing the height of 5-week-old Drosophila in 3 seconds. (F) Time to fatigue changed with age in Drosophila. (G) Time to fatigue in 1-week-old Drosophila. (H) Time to fatigue in 3-week-old Drosophila. (I) Time to fatigue in 4-week-old Drosophila. (J) Time to fatigue in 5-week-old Drosophila. (K) The average lifespan. For the climbing index and climbing height measurement, the sample size was about 100 Drosophila for each group. For climbing endurance, the sample size was 15 Drosophila for each group. P-values for climbing endurance curves were calculated by the log-rank test. The 1-way analysis of variance (ANOVA) with least significant difference (LSD) tests was used to identify differences among the groups. Data are represented as means ± SEM. *P<0.05; **P <0.01; ***P <0.001; ns means no significant differences.
Fig 2
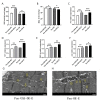
Fig 2. Effects of MPO on muscle function in Drosophila.
(A) SOD activity level. (B) MDA level. (C) The expression of the Psn gene in skeletal muscle. (D) The expression of the Sirt1 gene in skeletal muscle. (E) The expression of PGC-1αgene in skeletal muscle. (F) The expression of the arm gene in skeletal muscle. (G) Transmission electron microscopy of Psn-UAS-OE Drosophila muscle. (H) Transmission electron microscopy of Psn-OE Drosophila muscle. For RT-PCR measurement and ELISA measurement, the sample size was about 50/30 Drosophila’ skeletal muscle for each group. The 1-way analysis of variance (ANOVA) with least significant difference (LSD) tests was used to identify differences among the groups. Data are represented as means ± SEM. *P<0.05; **P <0.01; ***P <0.001; ns means no significant differences. Scale: white line represents 5 μm. Transmission electron microscopy images show that MPO increases the number of mitochondria and myogenic fibers. Yellow arrows indicate mitochondria and white arrows indictea myogenic fibers.
Fig 3
Fig 3. Effects of endurance exercise on muscle function and mean lifespan in Drosophila.
Climbing height changed with age in Drosophila. (B) Climbing the height of 4-week-old Drosophila in 3 seconds. (C) Climbing the height of 5-week-old Drosophila in 3 seconds. (D) Time to fatigue in 4-week-old Drosophila. (E) Time to fatigue in 5-week-old Drosophila. (F) The average lifespan. For the climbing index and climbing height measurement, the sample size was about 100 Drosophila for each group. For climbing endurance, the sample size was 15 Drosophila for each group. P-values for climbing endurance curves were calculated by the log-rank test. The 1-way analysis of variance (ANOVA) with least significant difference (LSD) tests was used to identify differences among the groups. Data are represented as means ± SEM. *P<0.05; **P <0.01; ***P <0.001; ns means no significant differences.
Fig 4
Fig 4. Effects of endurance exercise on muscle function in Drosophila.
SOD activity level. (B) MDA level. (C) The expression of the Psn gene in skeletal muscle. (D) The expression of the Sirt1 gene in skeletal muscle. (E) The expression of PGC-1αgene in skeletal muscle. (F) The expression of the arm gene in skeletal muscle. (G) Transmission electron microscopy of Psn-UAS-OE-E Drosophila muscle. (H) Transmission electron microscopy of Psn-OE-E Drosophila muscle. For the climbing index and climbing height measurement, the sample size was about 100 Drosophila for each group. For RT-PCR measurement and ELISA measurement, the sample size was about 50/30 Drosophila’ skeletal muscle for each group. The 1-way analysis of variance (ANOVA) with least significant difference (LSD) tests was used to identify differences among the groups. Data are represented as means ± SEM. *P<0.05; **P <0.01; ***P <0.001; ns means no significant differences. Scale: white line represents 5 μm. Transmission electron microscopy images show that endurance exercise increases the number of mitochondria and myogenic fibers. Yellow arrows indicate mitochondria and white arrows indicate myogenic fibers.
Fig 5
Fig 5. Effects of MPK on muscle function and mean lifespan in Drosophila.
(A) Climbing height changed with age in Drosophila. (B) Climbing the height of 1-week-old Drosophila in 3 seconds. (C) Climbing the height of 3-week-old Drosophila in 3 seconds. (D) Climbing the height of 4-week-old Drosophila in 3 seconds. (E) Climbing the height of 5-week-old Drosophila in 3 seconds. (F) Time to fatigue changed with age in Drosophila. (G) Time to fatigue in 1-week-old Drosophila. (H) Time to fatigue in 3-week-old Drosophila. (I) Time to fatigue in 4-week-old Drosophila. (J) Time to fatigue in 5-week-old Drosophila. (K) The average lifespan. For the climbing height and lifespan measurement, the sample size was about 100 Drosophila for each group. For climbing endurance, the sample size was 15 Drosophila for each group. P-values for climbing endurance curves were calculated by the log-rank test. The 1-way analysis of variance (ANOVA) with least significant difference (LSD) tests was used to identify differences among the groups. Data are represented as means ± SEM. *P<0.05; **P <0.01; ***P <0.001; ns means no significant differences.
Fig 6
Fig 6. Effects of MPK on muscle function in Drosophila.
(A) The expression of the Psn gene in skeletal muscle. (B) The expression of the Sirt1 gene in skeletal muscle. (C) The expression of PGC-1αgene in skeletal muscle. (D) The expression of the arm gene in skeletal muscle. (E) Transmission electron microscopy of Psn-UAS-RNAi Drosophila muscle. (F) Transmission electron microscopy of Psn-RNAi Drosophila muscle. For RT-PCR measurement, the sample size was about 50 Drosophila’ skeletal muscle for each group. The 1-way analysis of variance (ANOVA) with least significant difference (LSD) tests was used to identify differences among the groups. Data are represented as means ± SEM. *P<0.05; **P <0.01; ***P <0.001; ns means no significant differences. Scale: white line represents 5 μm. Transmission electron microscopy images show that MPO increases the number of mitochondria and myogenic fibers. Yellow arrows indicate mitochondria and white arrows indicate myogenic fibers.
Fig 7
Fig 7. Effects of endurance exercise on muscle function and mean lifespan in Drosophila.
(A) Climbing height changed with age in Drosophila. (B) Climbing the height of 4-week-old Drosophila in 3 seconds. (C) Climbing the height of 5-week-old Drosophila in 3 seconds. (D) Time to fatigue in 4-week-old Drosophila. (E) Time to fatigue in 5-week-old Drosophila. (F) The average lifespan. For the climbing height and lifespan measurement, the sample size was about 100 Drosophila for each group. For climbing endurance, the sample size was 15 Drosophila for each group. P-values for climbing endurance curves were calculated by the log-rank test. The 1-way analysis of variance (ANOVA) with least significant difference (LSD) tests was used to identify differences among the groups. Data are represented as means ± SEM. *P<0.05; **P <0.01; ***P <0.001; ns means no significant differences.
Fig 8
Fig 8. Effects of endurance exercise on muscle function in Drosophila.
(A)The expression of the Psn gene in skeletal muscle. (B) The expression of the Sirt1 gene in skeletal muscle. (C) The expression of PGC-1αgene in skeletal muscle. (D) The expression of the arm gene in skeletal muscle. (E) Transmission electron microscopy of Psn-UAS-RNAi+E Drosophila muscle. (F) Transmission electron microscopy of Psn-RNAi+E Drosophila muscle. For the climbing height and lifespan measurement, the sample size was about 100 Drosophila for each group. For RT-PCR measurement, the sample size was about 50 Drosophila’ skeletal muscle for each group. The 1-way analysis of variance (ANOVA) with least significant difference (LSD) tests was used to identify differences among the groups. Data are represented as means ± SEM. *P<0.05; **P <0.01; ***P <0.001; ns means no significant differences. Scale: white line represents 5 μm. Transmission electron microscopy images show that endurance exercise increases the number of mitochondria and myogenic fibers. Yellow arrows indicate mitochondria and white arrows indicate myogenic fibers.

Similar articles

Cited by

References

    1. Gao Y.H., Wen D.T., Wang S.J., Wang J.F., Presenilin and Alzheimer’s disease interactions with aging, exercise and high-fat diet: A systematic review, Biocell 47(1) (2023) 41–49.
    1. Vogelsang E.M., Raymo J.M., Liang J., Kobayashi E., Fukaya T., Population Aging and Health Trajectories at Older Ages, Journals of Gerontology Series B-Psychological Sciences and Social Sciences 74(7) (2019) 1245–1255. doi: 10.1093/geronb/gbx071 - DOI - PMC - PubMed
    1. Wilkinson D.J., Piasecki M., Atherton P.J., The age-related loss of skeletal muscle mass and function: Measurement and physiology of muscle fibre atrophy and muscle fibre loss in humans, Ageing Research Reviews 47 (2018) 123–132. doi: 10.1016/j.arr.2018.07.005 - DOI - PMC - PubMed
    1. Joanisse S., Nederveen J.P., Snijders T., McKay B.R., Parise G., Skeletal Muscle Regeneration, Repair and Remodelling in Aging: The Importance of Muscle Stem Cells and Vascularization, Gerontology 63(1) (2017) 91–100. doi: 10.1159/000450922 - DOI - PubMed
    1. Guo Y.Q., Livne-Bar I., Zhou L.L., Boulianne G.L., Drosophila presenilin is required for neuronal differentiation and affects notch subcellular localization and signaling, Journal of Neuroscience 19(19) (1999) 8435–8442. doi: 10.1523/JNEUROSCI.19-19-08435.1999 - DOI - PMC - PubMed

MeSH terms

Substances

LinkOut - more resources