A predictor-informed multi-subject bayesian approach for dynamic functional connectivity
- PMID: 38753655
- PMCID: PMC11098372
- DOI: 10.1371/journal.pone.0298651
A predictor-informed multi-subject bayesian approach for dynamic functional connectivity
Abstract
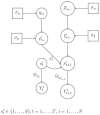
Dynamic functional connectivity investigates how the interactions among brain regions vary over the course of an fMRI experiment. Such transitions between different individual connectivity states can be modulated by changes in underlying physiological mechanisms that drive functional network dynamics, e.g., changes in attention or cognitive effort. In this paper, we develop a multi-subject Bayesian framework where the estimation of dynamic functional networks is informed by time-varying exogenous physiological covariates that are simultaneously recorded in each subject during the fMRI experiment. More specifically, we consider a dynamic Gaussian graphical model approach where a non-homogeneous hidden Markov model is employed to classify the fMRI time series into latent neurological states. We assume the state-transition probabilities to vary over time and across subjects as a function of the underlying covariates, allowing for the estimation of recurrent connectivity patterns and the sharing of networks among the subjects. We further assume sparsity in the network structures via shrinkage priors, and achieve edge selection in the estimated graph structures by introducing a multi-comparison procedure for shrinkage-based inferences with Bayesian false discovery rate control. We evaluate the performances of our method vs alternative approaches on synthetic data. We apply our modeling framework on a resting-state experiment where fMRI data have been collected concurrently with pupillometry measurements, as a proxy of cognitive processing, and assess the heterogeneity of the effects of changes in pupil dilation on the subjects' propensity to change connectivity states. The heterogeneity of state occupancy across subjects provides an understanding of the relationship between increased pupil dilation and transitions toward different cognitive states.
Copyright: © 2024 Lee et al. This is an open access article distributed under the terms of the Creative Commons Attribution License, which permits unrestricted use, distribution, and reproduction in any medium, provided the original author and source are credited.
Conflict of interest statement
The authors have declared that no competing interests exist.
Figures


Similar articles
-
Bayesian switching factor analysis for estimating time-varying functional connectivity in fMRI.Neuroimage. 2017 Jul 15;155:271-290. doi: 10.1016/j.neuroimage.2017.02.083. Epub 2017 Mar 4. Neuroimage. 2017. PMID: 28267626 Free PMC article.
-
A novel method for sparse dynamic functional connectivity analysis from resting-state fMRI.J Neurosci Methods. 2024 Nov;411:110275. doi: 10.1016/j.jneumeth.2024.110275. Epub 2024 Sep 4. J Neurosci Methods. 2024. PMID: 39241968
-
Improved state change estimation in dynamic functional connectivity using hidden semi-Markov models.Neuroimage. 2019 May 1;191:243-257. doi: 10.1016/j.neuroimage.2019.02.013. Epub 2019 Feb 10. Neuroimage. 2019. PMID: 30753927 Free PMC article.
-
Bayesian networks for fMRI: a primer.Neuroimage. 2014 Feb 1;86:573-82. doi: 10.1016/j.neuroimage.2013.10.020. Epub 2013 Oct 18. Neuroimage. 2014. PMID: 24140939 Review.
-
Spatio-temporal modeling of connectome-scale brain network interactions via time-evolving graphs.Neuroimage. 2018 Oct 15;180(Pt B):350-369. doi: 10.1016/j.neuroimage.2017.10.067. Epub 2017 Nov 10. Neuroimage. 2018. PMID: 29102809 Free PMC article. Review.
References
-
- Friston KJ, Jezzard P, Turner R. Analysis of Functional MRI Time-Series. Human Brain Mapping. 1994;1(2):153–171. doi: 10.1002/hbm.460010207 - DOI

