

Nonlinear modeling of oral glucose tolerance test response to evaluate associations with aging outcomes
- PMID: 38753665
- PMCID: PMC11098391
- DOI: 10.1371/journal.pone.0302381
Nonlinear modeling of oral glucose tolerance test response to evaluate associations with aging outcomes
Abstract
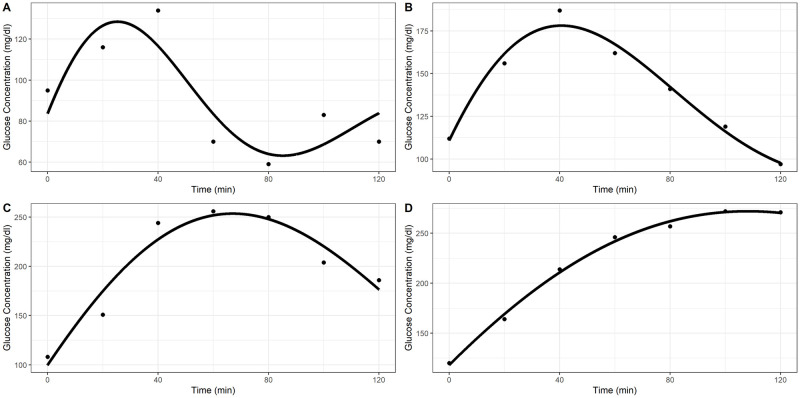
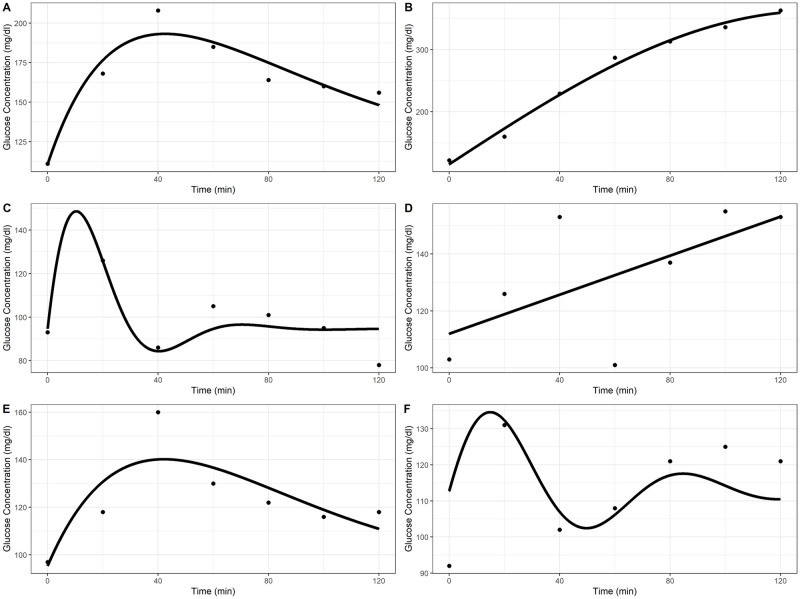
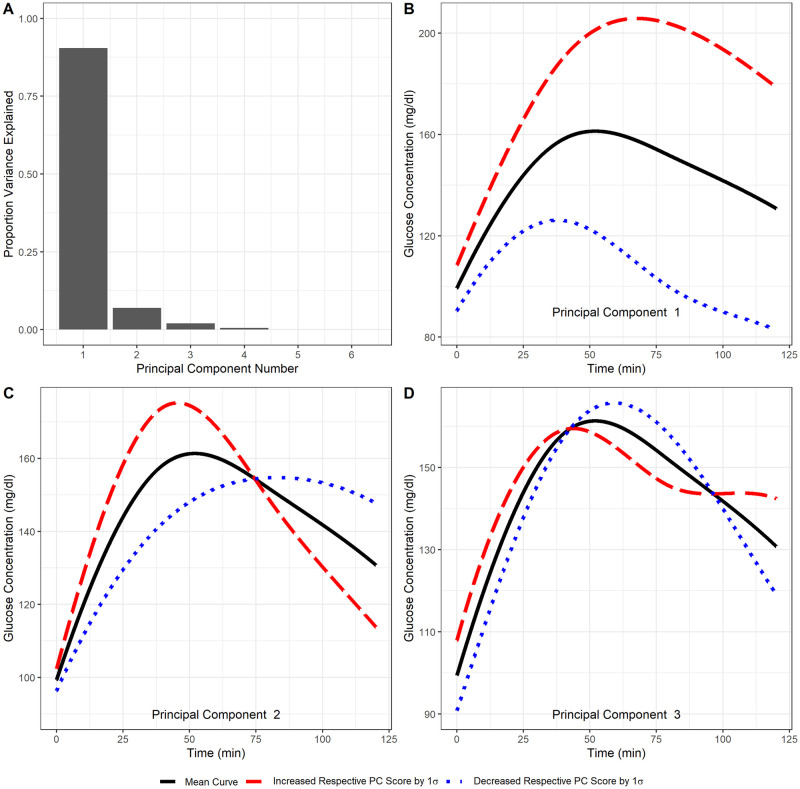
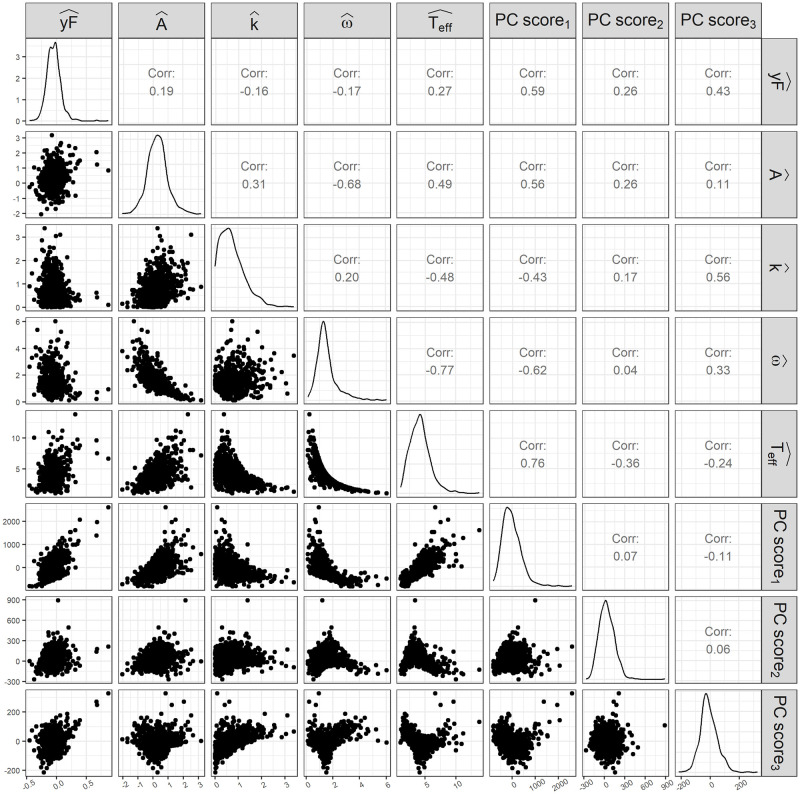
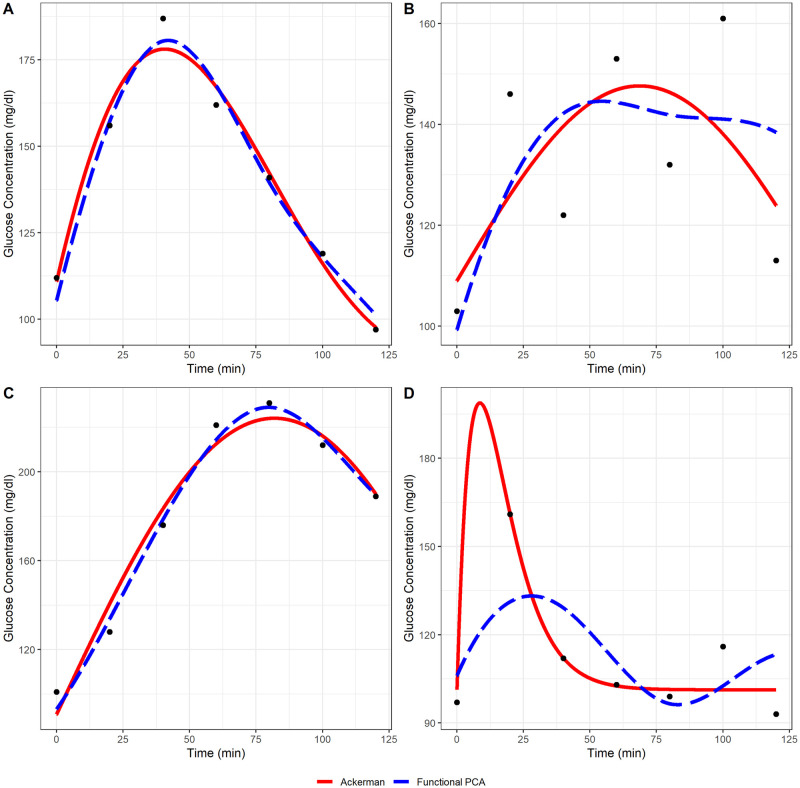
As people age, their ability to maintain homeostasis in response to stressors diminishes. Physical frailty, a syndrome characterized by loss of resilience to stressors, is thought to emerge due to dysregulation of and breakdowns in communication among key physiological systems. Dynamical systems modeling of these physiological systems aims to model the underlying processes that govern response to stressors. We hypothesize that dynamical systems model summaries are predictive of age-related declines in health and function. In this study, we analyze data obtained during 75-gram oral-glucose tolerance tests (OGTT) on 1,120 adults older than 50 years of age from the Baltimore Longitudinal Study on Aging. We adopt a two-stage modeling approach. First, we fit OGTT curves with the Ackerman model-a nonlinear, parametric model of the glucose-insulin system-and with functional principal components analysis. We then fit linear and Cox proportional hazards models to evaluate whether usual gait speed and survival are associated with the stage-one model summaries. We also develop recommendations for identifying inadequately-fitting nonlinear model fits in a cohort setting with numerous heterogeneous response curves. These recommendations include: (1) defining a constrained parameter space that ensures biologically plausible model fits, (2) evaluating the relative discrepancy between predicted and observed responses of biological interest, and (3) identifying model fits that have notably poor model fit summary measures, such as [Formula: see text], relative to other fits in the cohort. The Ackerman model was unable to adequately fit 36% of the OGTT curves. The stage-two regression analyses found no associations between Ackerman model summaries and usual gait speed, nor with survival. The second functional principal component score was associated with faster gait speed (p<0.01) and improved survival (p<0.01).
Copyright: This is an open access article, free of all copyright, and may be freely reproduced, distributed, transmitted, modified, built upon, or otherwise used by anyone for any lawful purpose. The work is made available under the Creative Commons CC0 public domain dedication.
Conflict of interest statement
The authors have declared that no competing interests exist.
Figures

Similar articles
-
To explain the variation of OGTT dynamics by biological mechanisms: a novel approach based on principal components analysis in women with history of GDM.Am J Physiol Regul Integr Comp Physiol. 2015 Jul 1;309(1):R13-21. doi: 10.1152/ajpregu.00059.2015. Epub 2015 Apr 29. Am J Physiol Regul Integr Comp Physiol. 2015. PMID: 25924879
-
Glucose and insulin measurements from the oral glucose tolerance test and relationship to muscle mass.J Gerontol A Biol Sci Med Sci. 2012 Jan;67(1):74-81. doi: 10.1093/gerona/glr022. Epub 2011 Feb 24. J Gerontol A Biol Sci Med Sci. 2012. PMID: 21350243 Free PMC article.
-
Modeling the oral glucose tolerance test in normal and impaired glucose tolerant states: a population approach.Curr Med Res Opin. 2017 Feb;33(2):305-313. doi: 10.1080/03007995.2016.1254607. Epub 2016 Dec 31. Curr Med Res Opin. 2017. PMID: 27794624
-
Assessment of beta-cell function during the oral glucose tolerance test by a minimal model of insulin secretion.Eur J Clin Invest. 2001 May;31(5):405-16. doi: 10.1046/j.1365-2362.2001.00827.x. Eur J Clin Invest. 2001. PMID: 11380592
-
Dietary glycation compounds - implications for human health.Crit Rev Toxicol. 2024 Sep;54(8):485-617. doi: 10.1080/10408444.2024.2362985. Epub 2024 Aug 16. Crit Rev Toxicol. 2024. PMID: 39150724
Cited by
-
Gerontologic Biostatistics and Data Science: Aging Research in the Era of Big Data.J Gerontol A Biol Sci Med Sci. 2024 Dec 11;80(1):glae269. doi: 10.1093/gerona/glae269. J Gerontol A Biol Sci Med Sci. 2024. PMID: 39500720 Review.
References
MeSH terms
Grants and funding
LinkOut - more resources
Full Text Sources
Medical
Research Materials
