. 2024 May 10;9(95):eadn0622.
doi: 10.1126/sciimmunol.adn0622. Epub 2024 May 16.

mRNA-LNP prime boost evolves precursors toward VRC01-like broadly neutralizing antibodies in preclinical humanized mouse models

Affiliations

mRNA-LNP prime boost evolves precursors toward VRC01-like broadly neutralizing antibodies in preclinical humanized mouse models

Xuesong Wang et al. Sci Immunol. .

Abstract

Germline-targeting (GT) protein immunogens to induce VRC01-class broadly neutralizing antibodies (bnAbs) to the CD4-binding site of the HIV envelope (Env) have shown promise in clinical trials. Here, we preclinically validated a lipid nanoparticle-encapsulated nucleoside mRNA (mRNA-LNP) encoding eOD-GT8 60mer as a soluble self-assembling nanoparticle in mouse models. In a model with three humanized B cell lineages bearing distinct VRC01-precursor B cell receptors (BCRs) with similar affinities for eOD-GT8, all lineages could be simultaneously primed and undergo diversification and affinity maturation without exclusionary competition. Boosts drove precursor B cell participation in germinal centers; the accumulation of somatic hypermutations, including in key VRC01-class positions; and affinity maturation to boost and native-like antigens in two of the three precursor lineages. We have preclinically validated a prime-boost regimen of soluble self-assembling nanoparticles encoded by mRNA-LNP, demonstrating that multiple lineages can be primed, boosted, and diversified along the bnAb pathway.


Conflict of interest statement

Competing interests: X.H., S.R., and W.R.S. are inventors on patent applications related to immunogens in this manuscript filed by Scripps and IAVI. S.H., A.C., X.H., and W.R.S. are employees of Moderna, Inc. F.D.B. has consultancy relationships with Adimab, Third Rock Ventures, and The EMBO Journal.

Figures

Fig. 1.
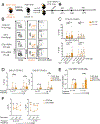
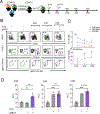
Fig. 1.. CLK19 B cell responses induced by eOD-GT8 60mer mRNA-LNP.
(A) Schematic: 8-week-old WT CD45.1 mice adoptively transferred with B cells from CLK19 CD45.2 mice to establish precursor frequencies of ~1 in 104 or 3 in 106 B cells. Mice were then immunized with eOD-GT8 60mer formulated with alum (15 μg), a CD4bs-knockout control (eOD-GT8-KO 60mer; 15 μg), or eOD-GT8 60mer mRNA-LNP (0.6 or 10 μg) 1 day post transfer (D0). Splenocytes or lymph nodes (LNs) were isolated on D14, D42, and D72. “mRNA” is used to mean “mRNA-LNP throughout, and “prot” for “protein.” (B) Flow cytometry of D14 LN from mice (1 in 104) as per (A). CD45.2-binder populations gated as Scatter/Singlet/Live (SSL+)/B220+/CD95+CD38/CD45.2+/Ag+. GC percentage (first column), CD45.2 in GC (second), and Ag+ CD45.2 (third). (C) D14 LN (upper) or spleen (lower) quantification. The x-axis represents immunization groups and y-axis the percent CD45.2 within GC. Circles represent one mouse. Two independent experiments were pooled for analysis. n=3–5 mice per independent group. (D) D42 quantification. The x-axis indicates treatment group and the y-axis the percentage of CD45.2 within GCs. Two independent experiments were pooled for analysis. n=3–4 mice per independent group. (E) Ag+ CD45.2 MBC frequencies from D42 splenocytes. The gating strategy is shown in fig. S1E. x-axis shows immunization group precursor frequencies and y-axis represents the percentage of Ag+ CD45.2 MBC among the B220+IgDlo GC population and starts at 0.0001. Two independent experiments were pooled for analysis; n=3–4 mice per independent group. Circles represent individual mice. (F) IgG titers from sera post immunization by eOD-GT8 60mer protein (15 μg) or mRNA-LNP (10 μg). n=3–10 mice in each group from two independent experiments. The x-axis indicates the day and the y-axis the change of area under curve (AUCcoated eOD-GT8−AUCcoated eOD-GT8 KO). Where shown, bars indicate geometric means and geometric SD of pooled groups and significance was calculated with Student’s t test (D–F) or one-way ANOVA (C): P>0.05 represents no significance (ns), *P<0.05, ***P<0.001, and ****P<0.0001.
Fig. 2.
Fig. 2.. GT8 60mer mRNA-LNP recruits and maintains diverse VRC01-class precursors in GCs.
(A) Schematic of adoptive transfer and immunization for CLK19, CLK09, and CLK21. Eight-week-old WT CD45.1 mice were singly adoptively transferred with B cells from CLK19/CLK09/CLK21 KI CD45.2 mice to establish precursor frequencies of ~2 in 105 B cells, then immunized with 10 μg of eOD-GT8 60mer mRNA-LNP (Day 0). Mice adoptively transferred with all CLKs were immunized with PBS as control. LN were isolated for analysis at days 14 and 36. (B and C) Frequency of CD45.2 antigen specific (Ag+) binders within GCs in individual CLK adoptively transferred mice (ATM) at days 14 (B) and 36 (C). Gated plots represent the percentage of GC (first column), and CD45.2 in GCs (second column) and the antigen specific fraction of that group (third column), respectively. (D and E) Quantification of the frequency of CD45.2 within GC in individual ATM. The graphs show the quantification of GC in B cells (left) and the CD45.2 frequency within GC (right) from lymph nodes at day 14 (D) and 36 (E). The x-axis indicates the cohort and the y-axis represents the percentage of GC out of B cells (left) or CD45.2 B cells within GC (right). Two independently repeated experiments were analyzed. n=3–5 mice per independent group. Bars indicate geometric means and geometric SD of mice from pooled groups.
Fig. 3.
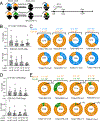
Fig. 3.. GC responses induced by mRNA-LNP in mice bearing two types of CLK BCRs.
(A) eOD-GT8 mRNA-LNP immunization of 8-week-old CD45.1 mice adoptively transferred with two CLK B cell lines at variable ratios. (B) Quantification of GC CD45.2 binders out of total B cells in CLK09–19 adoptive transfer recipients at days 14 (upper) and 36 (lower). The x-axis indicates the immunized group with varying CLK09/CLK19 precursor ratio and y-axis represents the percentage of GC CD45.2 binders out of B cells. Two independently repeated experiments were analyzed. n=3–4 mice per independent group. Bars indicate geometric means and geometric SD of mice from pooled groups. (C) Sequence frequency of CLK lineages at day 14 (top) and 36 (bottom). Antigen-specific CD45.2 were bulk-sorted for 10x sequencing analysis. Pie charts represent the frequency of CLK09 (blue) and CLK19 (orange) lineages from each immunized group with varying precursor ratios. Total: sequences per group; n: mice per group. (D) As in (B), but for CLK19–21. (E) As in (C), but for CLK19–21. (B and C) (i) both lines at 1 in 105 (both low); (ii) CLK09 at 1 in 105 and CLK19 at 5 in 105 (CLK19 high); (iii) CLK09 at 5 in 105 and CLK19 at 1 in 105 (CLK09 high); and (iv) both lines at 5 in 105 (both high). (D and E) identical ratios were established for CLK19 and CLK21. LNs were analyzed at days 14 and 36 after immunization.
Fig. 4.
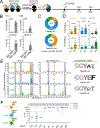
Fig. 4.. GC responses induced by eOD-GT8 60mer mRNA-LNP in CLK mice bearing human mini-B cell repertoire.
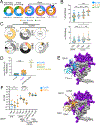
(A) Schematic: 8-week-old WT CD45.1 mice received B cells from CLK19, CLK09, and CLK21 KI CD45.2 mice in tandem to establish a mini-human repertoire with precursor frequencies of 2 in 105 B cells (approximately 6 in 106 each), then immunized with 10 μg of eOD-GT8 60mer mRNA-LNP one day post transfer. Mice adoptively transferred with all CLKs were immunized with PBS as control. LN were isolated on days 14 and 36 after immunization. (B) Quantification of GC B cells (upper) and GC CD45.2 B cells (lower) on days 14 (left) and 36 (right). The x-axis represents the immunized group and the y-axis represents the percentage. Two independent experiments were analyzed. n=3–5 mice per independent group. Bars indicate geometric means and geometric SD from mice in pooled groups. (C) Single cell–plate sequencing was performed for CD45.2 Ag+ binders from GCs at day 14 (upper) and 36 (lower). CLK09 (blue), CLK19 (orange), and CLK21 (green) sequences from paired heavy chain (HC) and light chain (LC) were used for sequence frequency analysis. Total: sequences per group; n: mice per group. (D) Percent amino acid (aa) change in IGHV (upper) and IGLV (lower) of CLK19, CLK09, and CLK21 lineages isolated from GC at days 14 and 36. Data from two independent experiments were analyzed. Each dot represents one sequence. Bars indicate geometric means and geometric SD of 12–63 sequences per group from pooled experiments. Significance was calculated with Student’s t test, *P<0.05, **P<0.01, ***P<0.001, and ****P<0.0001. (E) Mutation frequency was assessed via hotspot analysis for both heavy (left) and light (right) antibody chains; WebLogo (88) at right. (F) SPR affinity of post-prime mAbs for GT8-prime and g5- and g28-boost ligands. Top values are the geometric means of mAb affinity after priming. Left values are the geometric means of affinity for CLK GL mAbs to eOD-GT8 ligand. Each dot represents one mAb, 2–14 mAbs per group were analyzed from a single SPR experiment.
Fig. 5.
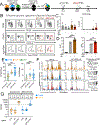
Fig. 5.. GC responses and sequence evolution triggered by g5 and g28 boosters.
(A) Schematic: mini-repertoire was established as in Fig. 4A. mRNA-LNP doses were 10 μg for prime and boost. (B) Representative flow cytometry plots of antigen-specific GC CD45.2 responses after prime–boost strategy. A probe including both g5 and g28 was used to detect CD45.2 binders from the GT8-prime group. Probes of g5 or g28 alone were used to detect binders after g5-prime–boost or g28-prime–boost, respectively. Ag+CD45.2 binders were gated on SSL+/B220+/CD95+CD38/CD45.2+/Ag+. GC percentage (upper row), CD45.2 (middle row), and Ag+CD45.2 (bottom row). (C) Quantification of GC B cells (left) and GC Ag+CD45.2 (right) at D78. The x-axis represents the immunized group and the y-axis represents the percentage of GC B cells (left) and Ag+CD45.2 within GCs (right). Circles represent one mouse. Two independently repeated experiments were pooled for analysis. n=3–7 mice per independent group. (D) ELISA-derived specific IgG titers post GT8/g5/g28-prime and post-g5 and g28 boost. Plates were coated with g5 (left) or g28 (right) ligands. Two independent experiments were pooled for analysis. n=3–5 mice per independent group. The x-axis represents the immunization groups and the y-axis AUC. (E) Percent aa SHM in IGHV (left) and IGLV (right) of CLK19 (orange), CLK09 (blue), and CLK21 (green) lineages from GT8-prime (36 days post prime; reproduced from Fig. 4C day 36 for comparison) and g5-or g28-boost (36 days post boost) groups. Each dot represents one sequence, 37–130 sequences per group from two independent experiments were pooled for analysis. (F) Mutations were assessed via hotspot analysis for HC (left) and LC (right). CLK19 (orange) and CLK09 (blue) lineages from GT8-prime only group (prime-only group reproduced from Fig. 4C day 36 for comparison); g5-boost (brown) and g28-boost (red). WebLogos at right (88). (G) Affinity of mAbs after boosting to GT8, g5 g28, or g28_N276+. Top values are the geometric means of mAb affinity. Each dot represents one mAb, 21–23 mAbs per group were analyzed from a single SPR experiment. Where used, bars indicate geometric means and geometric SD of pooled mice and significance was calculated with one-way ANOVA: ** P<0.01, ***P<0.001, and ****P<0.0001.
Fig. 6.
Fig. 6.. GC responses after g28v2 boosting.
(A) Schematic of mini-repertoire adoptive transfer to evaluate GT8 prime (Day 0) followed by g28v2 boost (Day 30). The mini-repertoire was established as in Fig. 4A, and the dosages of mRNA-LNP for both prime and boost are 10 μg. (B) Flow cytometry of CD45.2 binders within LN GCs over time after g28v2 boosting. g28v2 probe was used to detect CD45.2 binders. CD45.2 binder populations were gated on SSL+/B220+/CD95+CD38/CD45.2+/Ag+. Gated plots represent the percentage of GC (upper row), CD45.2 (middle row) and g28v2 specific CD45.2 (lower row). (C) Quantification of GC B cells (upper) and GC CD45.2 binders (lower) over time after g28v2 boosting. The x-axis represents the time points for boosting and the y-axis represents the percentage of GC B cells (upper) and GC CD45.2 binders (lower). Two independently repeated experiments with 3–5 mice per independent group were analyzed. Each circle or square with bars indicates geometric means and geometric SD from mice in pooled groups. (D) ELISA-derived specific IgG titers post GT8/g28v2-prime and g28v2 boost over time; Plates were coated with g28v2 ligands for ELISA detection. n=3–5 mice in a single experiment. Bars indicate geometric means and geometric SD. The x-axis represents the immunization groups and the y-axis represents the AUC. Significance was calculated with one-way ANOVA and shown as: ns P>0.05, *P<0.05, **P<0.01, ***P<0.001, and ****P<0.0001.
Fig. 7.
Fig. 7.. SHM and affinity maturation after g28v2 boosting.
(A) Sequence frequency of CLK lineages in GC. CLK09 (blue), CLK19 (orange), and CLK21 (green). Single-cell-plate sequencing was used as in Fig. 4C. Total: sequences per group; n: mice per group; prime data combines sequences from days 14 and 36 shown in Fig. 4C. (B) Percent aa SHM in IGHV (upper) and IGLV (lower) of CLK19 (orange), CLK09 (blue) and CLK21 (green) lineages from GT8-prime- (day 36 data reproduced from Fig. 4C) and g28v2-boost-groups. Each dot represents one sequence, and 118–240 sequences per group from two independent experiments were pooled for analysis. (C) Mutation frequency of key residues in CDRs of HC and LC after g28v2 boosting. Key mutations on D58 were analyzed referring to the mature VRC01-class bnAbs. Yellow indicates the aa is identical to bnAb VRC01 (14), whereas red signifies identity to bnAb N6 (27). (D) Key mutation frequency in post-boost HCs, in comparison to mature VRC01-class bnAbs. Each dot represents one mAb. The x-axis represents immunization group or a representative panel of 19 VRC01-class bnAbs (12A12, 12A21, N6, VRC27, N17, N60P1.1, N60P25.1, N60P23, PCIN63_71l, PCIN63_66B, PCIN63_71G, NIH45–46, VRC07b, VRC23, VRC01, VRC02, VRC18, VRC08, VRC-PG19) with minimal (≤ 3 aa) indels and the y-axis quantifies aa key mutations in HC. (E) Computational molecular modeling of mAb Fvs from CLK09 lineage at D58 (upper) and CLK19 lineage at D46 (lower) binding to g28v2 was performed by AlphaFold2 and Rosetta. Purple represents N-linked glycans, gray g28v2 peptide, dark blue and light blue (upper) represent the HC and LC of CLK09 Fv regions, respectively, orange and yellow (lower) represent the HC and LC of CLK19 Fv regions, respectively, and red represents the mutations from germline. Arrows denote key VRC01-class HC mutation. (F) Affinity of mAbs to ligands (GT8, g28v2, g28v2_N276+, 001428_N276Q trimer and 1HD2_N276Q trimer) after boosting over time. Black lines represent the geometric means of mAb affinity post-boost. Each dot represents one mAb, 9–14 mAbs per group from a single SPR experiment were analyzed. Significance was calculated with Student’s t test (D) or one-way-ANOVA (B and F) and shown as: ns P>0.05, *P<0.05, ***P<0.001, and ****P<0.0001.

References

    1. Burton DR, Hangartner L, Broadly Neutralizing Antibodies to HIV and Their Role in Vaccine Design. Annual Review of Immunology 34, 635–659 (2016). - PMC - PubMed
    1. Hoot S, McGuire AT, Cohen KW, Strong RK, Hangartner L, Klein F, Diskin R, Scheid JF, Sather DN, Burton DR, Stamatatos L, Recombinant HIV Envelope Proteins Fail to Engage Germline Versions of Anti-CD4bs bNAbs. PLOS Pathogens 9, e1003106 (2013). - PMC - PubMed
    1. Jardine JG, Julien J-P, Menis S, Ota T, Kalyuzhniy O, McGuire A, Sok D, Huang P-S, MacPherson S, Jones M, Nieusma T, Mathison J, Baker D, Ward AB, Burton DR, Stamatatos L, Nemazee D, Wilson IA, Schief WR, Rational HIV Immunogen Design to Target Specific Germline B Cell Receptors. Science 340, 711–716 (2013). - PMC - PubMed
    1. McGuire AT, Hoot S, Dreyer AM, Lippy A, Stuart A, Cohen KW, Jardine J, Menis S, Scheid JF, West AP, Schief WR, Stamatatos L, Engineering HIV envelope protein to activate germline B cell receptors of broadly neutralizing anti-CD4 binding site antibodies. J Exp Med 210, 655–663 (2013). - PMC - PubMed
    1. Xiao X, Chen W, Feng Y, Zhu Z, Prabakaran P, Wang Y, Zhang M-Y, Longo NS, Dimitrov DS, Germline-like predecessors of broadly neutralizing antibodies lack measurable binding to HIV-1 envelope glycoproteins: Implications for evasion of immune responses and design of vaccine immunogens. Biochem Biophys Res Commun 390, 404–409 (2009). - PMC - PubMed

Publication types

Substances