. 2024 May 16;20(5):e1012059.
doi: 10.1371/journal.pcbi.1012059. eCollection 2024 May.

Nuclear export is a limiting factor in eukaryotic mRNA metabolism

Affiliations

Nuclear export is a limiting factor in eukaryotic mRNA metabolism

Jason M Müller et al. PLoS Comput Biol. .

Abstract

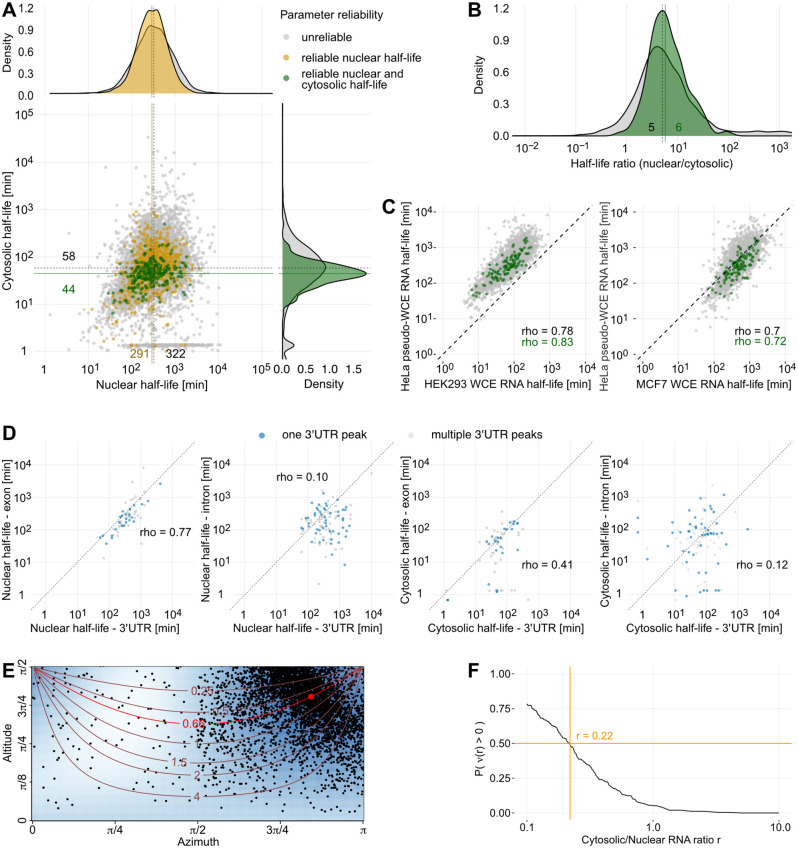
The eukaryotic mRNA life cycle includes transcription, nuclear mRNA export and degradation. To quantify all these processes simultaneously, we perform thiol-linked alkylation after metabolic labeling of RNA with 4-thiouridine (4sU), followed by sequencing of RNA (SLAM-seq) in the nuclear and cytosolic compartments of human cancer cells. We develop a model that reliably quantifies mRNA-specific synthesis, nuclear export, and nuclear and cytosolic degradation rates on a genome-wide scale. We find that nuclear degradation of polyadenylated mRNA is negligible and nuclear mRNA export is slow, while cytosolic mRNA degradation is comparatively fast. Consequently, an mRNA molecule generally spends most of its life in the nucleus. We also observe large differences in the nuclear export rates of different 3'UTR transcript isoforms. Furthermore, we identify genes whose expression is abruptly induced upon metabolic labeling. These transcripts are exported substantially faster than average mRNAs, suggesting the existence of alternative export pathways. Our results highlight nuclear mRNA export as a limiting factor in mRNA metabolism and gene regulation.


Conflict of interest statement

The authors have declared that no competing interests exist.

Figures

Fig 1
Fig 1. Experimental setup and computational modeling of RNA metabolism.
(A) Schematic representation of the experimental setup. SLAM-seq time series samples were generated from fractionated nuclear and the cytoplasmic fractions at t = 0, 15, 30, 45, 60, 90, 120, 180 min after addition of 500μM 4sU and preprocessed to obtain new and total reads. (B) Two compartment differential equation model of the nuclear RNA fraction (N = N(t)) and the cytosolic RNA fraction (C = C(t)). These fractions are described by 4 parameters, namely the synthesis rate μ, the nuclear degradation rate ν, the nuclear export rate τ, and the cytosolic degradation rate λ. (C) Parameter fitting of the nuclear removal rate ν + τ and the cytosolic degradation rate λ at the example of the 3’UTR of the MAFG gene using its new by total RNA ratios. (D) Measured newtotal RNA ratios, estimated newtotal RNA ratios and the respective residuals after parameter fitting for the nuclear (left) and cytoplasmic (right) fractions. Each row corresponds to one 3’UTR with reliable parameter estimates. (E) Heat scatterplot of a 2-dimensional MCMC sample of the nuclear and cytoplasmic transcript half-lives for the 3’UTR of the MAFG gene. The half-life distributions are given at the top and right hand side.
Fig 2
Fig 2. Nuclear RNA half-lives are longer than cytosolic half-lives.
(A) Nuclear and cytosolic RNA half-life estimates of 3’UTRs. Half-lives were averaged over both measured time series. Gray dots represent unreliable estimates, yellow dots correspond reliable estimates for nuclear half-life, and green dots portray reliable estimates for both nuclear and cytosolic compartment (see Methods for reliability criteria). The half-life estimate distributions are given at the top and right hand side, color representation as in scatterplot. The solid and dashed lines indicate median half-life estimates of reliable and all 3’UTRs, respectively. (B) Nuclear by cytosolic half-life ratios of all 3’UTRs (gray) and 3’UTRs with reliable half-life estimates (green) for both compartments. The solid and dashed lines indicate median half-life ratios of reliable and all 3’UTRs, respectively. (C) Comparison between half-life estimates by our two-compartment model and whole-cell extract half-life measurements from Schueler et al. (2014) [38]. Our nuclear and cytosolic RNA estimates were summed to generate pseudo-whole-cell estimates. Gray dots represent unreliable estimates, green points represent reliable estimates. (D) Correlation of half-lives between 3’UTRs and exonic or intronic peaks of the same gene. Only 3’UTRs and peaks that had one unique gene annotation were considered. Data points are colored by whether the 3’UTR harbors one (gray) or multiple (blue) expressed 3’UTR peaks. (E) Estimation of the cytnuc RNA ratio using a spherical median. Each dot represents the angular coordinates of a 3d unit vector, which in turn is determined as the normal vector of a plane spanned by three triplets (tgi,-ngi,-cgi) of three randomly sampled 3’UTRs gi, i = 1, 2, 3. Contour lines show locations of constant cytnuc RNA ratio. The red dot is the spherical median of the sampled normal vectors and corresponds to a ratio of 0.66. Azimuth angles ψ ∈ [π, 2π] correspond to normal vectors v in which not all entries are positive and are omitted. (F) Fraction of non-negative nuclear degradation rate estimates as a function of the cytnuc RNA ratio. Assuming at least 50% positive estimates (orange horizontal line) leads to a maximum admissible ratio of 0.2 (orange vertical line).
Fig 3
Fig 3. Factors correlating with nuclear and cytosolic half-lives.
(A) Correlation of half-life estimates with gene-specific parameters. Shown are the nuclear and cytosolic half-lives plotted against the 3’UTR lengths and the CDS lengths per gene. All 3’UTRs are shown in gray and 3’UTRs with reliable half-life estimates are shown in green with corresponding regression lines. (B) Comparison between RNA half-lives of short and long isoforms of a 3’UTR region (242 peaks from 118 3’UTRs). The medians are indicated by the violet lines with corresponding text labels. (C) Nuclear half-lives differ between different RBP-bound transcripts. Density plots show the distribution of nuclear half-life fold-changes (FC) relative to the global median (all bound and unbound transcript half-lives) for selected RBP-bound transcripts (eCLIP data retrieved from ENCODE). Distribution densities with median fold-change above or below the global median are colored in blue and red, respectively. Black bars indicate the median of the respective distribution. The number of bound and unbound transcripts is given for each RBP. (D) Violin plot of the nuclear half-life distributions of transcripts that are either bound (red) or unbound (gray) by RBM15 (p < 0.05, Wilcoxon test; eCLIP data retrieved from ENCODE). (E) Nuclear and cytosolic RNA half-life estimates of lncRNAs. Blue dots represent lncRNA estimates and gray dots portray all other 3’UTRs. The blue lines indicate the median half-lives of the lncRNAs, the black lines indicate the median half-lives of all quantified 3’UTRs, respectively. (F) Expression level and newtotal RNA ratios of the ‘supernova’ gene SGK1.
Fig 4
Fig 4. Potential biases of the two-compartment model estimates.
(A) Nuclear and cytosolic RNA half-life estimates of ER-translated transcripts according to gene ontology annotation. Blue dots represent estimates for ER-translated transcripts and gray dots portray all other 3’UTRs. The blue and black lines with corresponding text labels indicate the median half-lives of ER-translated transcripts and all other 3’UTRs, respectively. (B) Line plot showing the percentage of retained transcripts for a range of postulated nuclear degradation rates. A transcript was defined as retained if its nuclear retained fraction was at least 5%. (C) Correlation of a simple exponential cytosolic decay model fit results with cytosolic half-lives obtained through SLAM-seq on the cytosolic fraction of MCF7 cells [47]. Gray dots represent expressed 3’UTRs and green dots portray 3’UTRs that passed our reliability criteria for the cytosolic compartment.

Similar articles

Cited by

References

    1. Bahar Halpern K, Caspi I, Lemze D, Levy M, Landen S, Elinav E, et al.. Nuclear Retention of mRNA in Mammalian Tissues. Cell Reports. 2015;13(12):2653–2662. doi: 10.1016/j.celrep.2015.11.036 - DOI - PMC - PubMed
    1. Battich N, Beumer J, de Barbanson B, Krenning L, Baron CS, Tanenbaum ME, et al.. Sequencing metabolically labeled transcripts in single cells reveals mRNA turnover strategies. Science. 2020;367(6482):1151–1156. doi: 10.1126/science.aax3072 - DOI - PubMed
    1. Boehringer A, Bowser R. RNA Nucleocytoplasmic Transport Defects in Neurodegenerative Diseases. In: Sattler R, Donnelly CJ, editors. RNA Metabolism in Neurodegenerative Diseases. Advances in Neurobiology. Cham: Springer International Publishing; 2018. p. 85–101. Available from: 10.1007/978-3-319-89689-2_4 - DOI - PubMed
    1. Garland W, Jensen TH. Nuclear sorting of RNA. WIREs RNA. 2020;11(2):e1572. doi: 10.1002/wrna.1572 - DOI - PubMed
    1. Cougot N, Babajko S, Séraphin B. Cytoplasmic foci are sites of mRNA decay in human cells. Journal of Cell Biology. 2004;165(1):31–40. doi: 10.1083/jcb.200309008 - DOI - PMC - PubMed