

Associations of street-view greenspace with Parkinson's disease hospitalizations in an open cohort of elderly US Medicare beneficiaries
- PMID: 38754245
- PMCID: PMC11199351
- DOI: 10.1016/j.envint.2024.108739
Associations of street-view greenspace with Parkinson's disease hospitalizations in an open cohort of elderly US Medicare beneficiaries
Abstract
Introduction: Protective associations of greenspace with Parkinson's disease (PD) have been observed in some studies. Visual exposure to greenspace seems to be important for some of the proposed pathways underlying these associations. However, most studies use overhead-view measures (e.g., satellite imagery, land-classification data) that do not capture street-view greenspace and cannot distinguish between specific greenspace types. We aimed to evaluate associations of street-view greenspace measures with hospitalizations with a PD diagnosis code (PD-involved hospitalization).
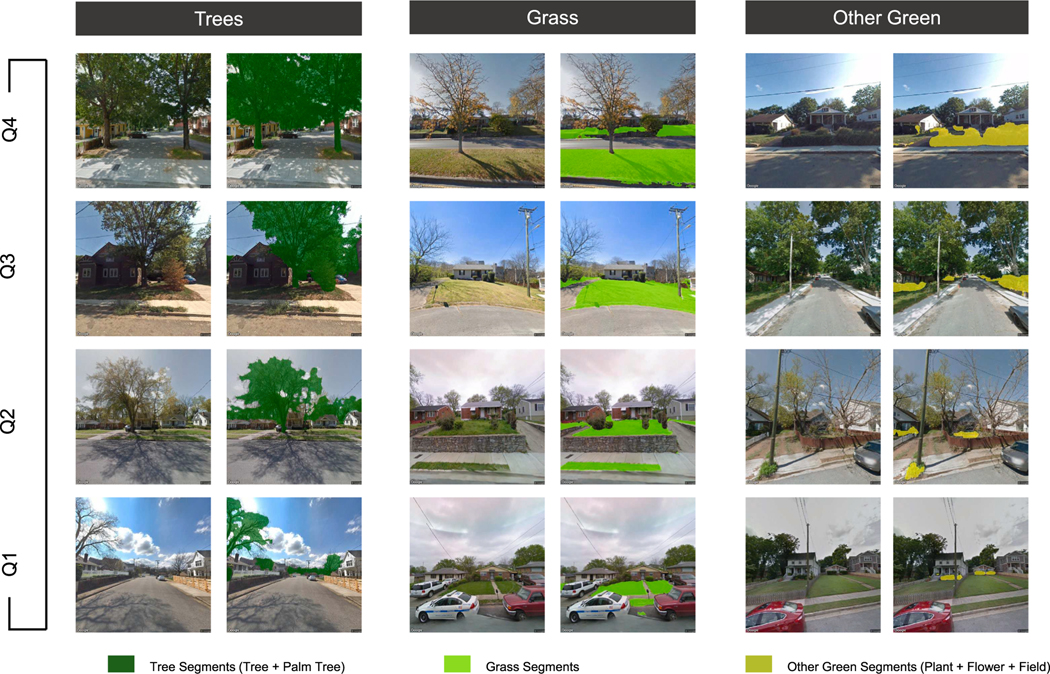
Methods: We created an open cohort of about 45.6 million Medicare fee-for-service beneficiaries aged 65 + years living in core based statistical areas (i.e. non-rural areas) in the contiguous US (2007-2016). We obtained 350 million Google Street View images across the US and applied deep learning algorithms to identify percentages of specific greenspace features in each image, including trees, grass, and other green features (i.e., plants, flowers, fields). We assessed yearly average street-view greenspace features for each ZIP code. A Cox-equivalent re-parameterized Poisson model adjusted for potential confounders (i.e. age, race/ethnicity, socioeconomic status) was used to evaluate associations with first PD-involved hospitalization.
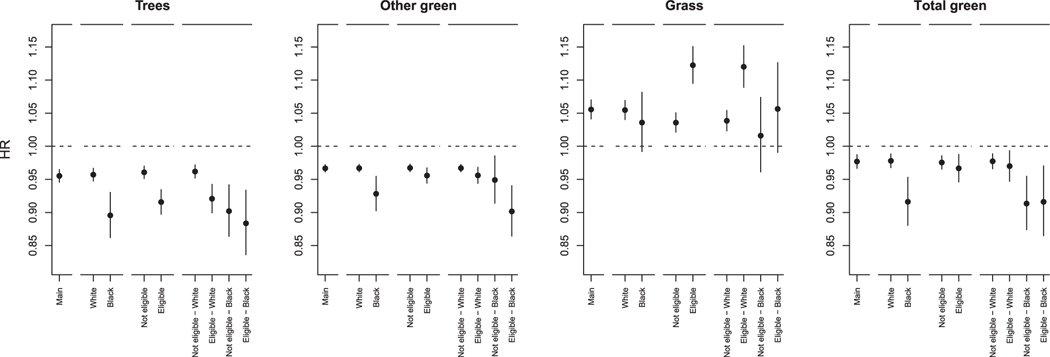
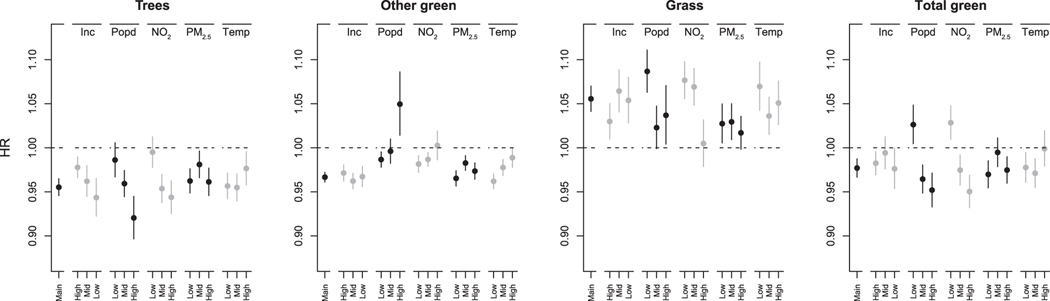
Results: There were 506,899 first PD-involved hospitalizations over 254,917,192 person-years of follow-up. We found a hazard ratio (95% confidence interval) of 0.96 (0.95, 0.96) per interquartile range (IQR) increase for trees and a HR of 0.97 (0.96, 0.97) per IQR increase for other green features. In contrast, we found a HR of 1.06 (1.04, 1.07) per IQR increase for grass. Associations of trees were generally stronger for low-income (i.e. Medicaid eligible) individuals, Black individuals, and in areas with a lower median household income and a higher population density.
Conclusion: Increasing exposure to trees and other green features may reduce PD-involved hospitalizations, while increasing exposure to grass may increase hospitalizations. The protective associations may be stronger for marginalized individuals and individuals living in densely populated areas.
Keywords: Built Environment; Neurological Disorders; Parkinson’s Disease; Street-View Greenspace; Visual Exposure.
Copyright © 2024 The Authors. Published by Elsevier Ltd.. All rights reserved.
Conflict of interest statement
Declaration of competing interest The authors declare that they have no known competing financial interests or personal relationships that could have appeared to influence the work reported in this paper.
Figures
Similar articles
-
Assessing greenspace and cardiovascular health through deep-learning analysis of street-view imagery in a cohort of US children.Environ Res. 2025 Jan 15;265:120459. doi: 10.1016/j.envres.2024.120459. Epub 2024 Nov 26. Environ Res. 2025. PMID: 39603586
-
Associations of Greenness, Parks, and Blue Space With Neurodegenerative Disease Hospitalizations Among Older US Adults.JAMA Netw Open. 2022 Dec 1;5(12):e2247664. doi: 10.1001/jamanetworkopen.2022.47664. JAMA Netw Open. 2022. PMID: 36538329 Free PMC article.
-
Street-view greenspace exposure and objective sleep characteristics among children.Environ Res. 2022 Nov;214(Pt 1):113744. doi: 10.1016/j.envres.2022.113744. Epub 2022 Jun 25. Environ Res. 2022. PMID: 35760115 Free PMC article.
-
Long-term effects of PM2·5 on neurological disorders in the American Medicare population: a longitudinal cohort study.Lancet Planet Health. 2020 Dec;4(12):e557-e565. doi: 10.1016/S2542-5196(20)30227-8. Epub 2020 Oct 19. Lancet Planet Health. 2020. PMID: 33091388 Free PMC article.
-
Associations of parks, greenness, and blue space with cardiovascular and respiratory disease hospitalization in the US Medicare cohort.Environ Pollut. 2022 Nov 1;312:120046. doi: 10.1016/j.envpol.2022.120046. Epub 2022 Aug 29. Environ Pollut. 2022. PMID: 36049575 Free PMC article.
Cited by
-
Association Between Residential Greenness and Risk of Stroke by Ecoregions: The REGARDS Study.J Am Heart Assoc. 2025 Apr 15;14(8):e037866. doi: 10.1161/JAHA.124.037866. Epub 2025 Apr 10. J Am Heart Assoc. 2025. PMID: 40207510 Free PMC article.
-
Does greenspace influence the associations between ambient temperature and violent crime? An observational study.Environ Res Lett. 2025 Aug 1;20(8):084064. doi: 10.1088/1748-9326/adef6a. Epub 2025 Jul 24. Environ Res Lett. 2025. PMID: 40717740 Free PMC article.
-
GPS-based street-view greenspace exposure and wearable assessed physical activity in a prospective cohort of US women.Int J Behav Nutr Phys Act. 2025 Jul 6;22(1):92. doi: 10.1186/s12966-025-01795-8. Int J Behav Nutr Phys Act. 2025. PMID: 40619433 Free PMC article.
-
Satellite-Based and Street-View Green Space and Adiposity in US Children.JAMA Netw Open. 2024 Dec 2;7(12):e2449113. doi: 10.1001/jamanetworkopen.2024.49113. JAMA Netw Open. 2024. PMID: 39636637 Free PMC article.
-
Assessing greenspace and cardiovascular health through deep-learning analysis of street-view imagery in a cohort of US children.Environ Res. 2025 Jan 15;265:120459. doi: 10.1016/j.envres.2024.120459. Epub 2024 Nov 26. Environ Res. 2025. PMID: 39603586
References
-
- Abatzoglou JT, 2013. Development of gridded surface meteorological data for ecological applications and modelling. Int. J. Climatol 33 (1), 121–131. 10.1002/joc.3413. - DOI
-
- Awaya A, Kuroiwa Y, 2022. Relationship between annual airborne pollen levels and occurrence of parkinson disease, amyotrophic lateral sclerosis, myasthenia gravis, multiple sclerosis, spinocerebellar degeneration, huntington’s disease, shy-drager syndrome, moyamoya disease. Med. Clin. Sci. Curr. Arch. About 4 (4).
-
- Bickel PJ, Gotze F, van Zwet WR, 1997. Resampling fewer than n observations: gains, losses and remedies for losses. Stat Sin. 7, 1–31. 10.1007/978-1-4614-1314-1_17. - DOI
