. 2024:42:103614.
doi: 10.1016/j.nicl.2024.103614. Epub 2024 May 4.

Neurodevelopment of children exposed to prolonged anesthesia in infancy: GABA study interim analysis of resting-state brain networks at 2, 4, and 10-months old

Affiliations

Neurodevelopment of children exposed to prolonged anesthesia in infancy: GABA study interim analysis of resting-state brain networks at 2, 4, and 10-months old

Adela Desowska et al. Neuroimage Clin. 2024.

Abstract

Background: Previous studies have raised concerns regarding neurodevelopmental impacts of early exposures to general anesthesia and surgery. Electroencephalography (EEG) can be used to study ontogeny of brain networks during infancy. As a substudy of an ongoing study, we examined measures of functional connectivity in awake infants with prior early and prolonged anesthetic exposures and in control infants.

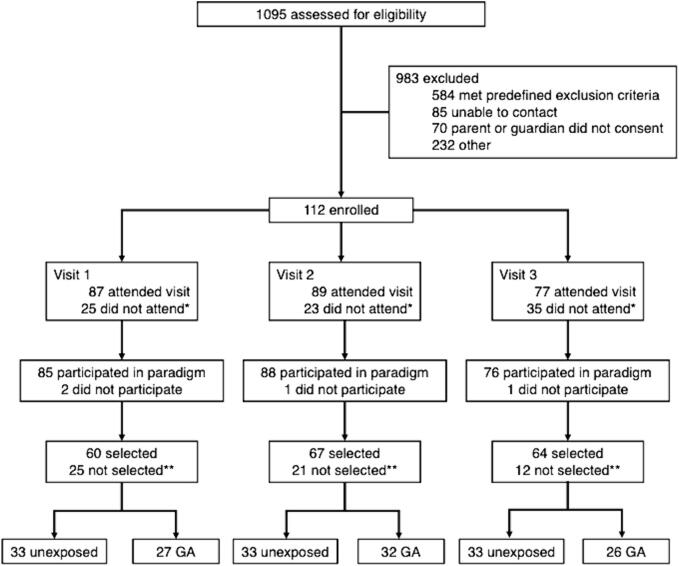
Methods: EEG functional connectivity was assessed using debiased weighted phase lag index at source and sensor levels and graph theoretical measures for resting state activity in awake infants in the early anesthesia (n = 26 at 10 month visit, median duration of anesthesia = 4 [2, 7 h]) and control (n = 38 at 10 month visit) groups at ages approximately 2, 4 and 10 months. Theta and low alpha frequency bands were of primary interest. Linear mixed models incorporated impact of age and cumulative hours of general anesthesia exposure.

Results: Models showed no significant impact of cumulative hours of general anesthesia exposure on debiased weighted phase lag index, characteristic path length, clustering coefficient or small-worldness (conditional R2 0.05-0.34). An effect of age was apparent in many of these measures.

Conclusions: We could not demonstrate significant impact of general anesthesia in the first months of life on early development of resting state brain networks over the first postnatal year. Future studies will explore these networks as these infants grow older.

Keywords: Electroencephalography; Functional connectivity; General anesthesia; Infant; Network; Neurodevelopment.


Conflict of interest statement

Declaration of Competing Interest The authors declare that they have no known competing financial interests or personal relationships that could have appeared to influence the work reported in this paper.

Figures

Fig. 1
Fig. 1
Flow of participants throughout the study. *Reasons for not attending study visit include, but are not limited to, restrictions surrounding the COVID-19 pandemic, illness, and/or no-show. **Reasons for not being selected include, but are not limited to, not enough clean data collected, too many bad channels, and/or otherwise unusable data.
Fig. 2
Fig. 2
Global resting-state functional connectivity strength (dwPLI) across all frequencies in GA-exposed and Unexposed infants at the sensor-level. Two participant groups defined for illustration purposes are ‘unexposed’ with no exposure to anesthesia and GA – participants with any exposure to anesthesia at the time point tested. Dependent measure– dwPLI averaged over all electrodes per each frequency point. There was no significant difference between the groups at any frequency point. Red line represents participants exposed to general anesthesia, blue – unexposed. The shaded field represents standard error. (For interpretation of the references to colour in this figure legend, the reader is referred to the web version of this article.)
Fig. 3
Fig. 3
Global resting-state functional connectivity strength (dwPLI) in theta and low-alpha frequencies during the first year of life in GA-exposed and Unexposed infants at the sensor-level. Scatter plots represent dwPLI averaged over all electrodes at each age point. The groups were not discernable at any age point. Red points represent participants exposed to general anesthesia, blue – unexposed. (For interpretation of the references to colour in this figure legend, the reader is referred to the web version of this article.)
Fig. 4
Fig. 4
Topographic maps of resting-state theta connectivity (dwPLI) in GA-exposed and Unexposed infants at the sensor level. Topoplots represent average dwPLI at each electrode to all other electrodes. Pairwise functional connectivity is depicted for each group accompanying the topoplots. There were no differences between groups at any electrode. The scale is the same for both topoplots and heatmaps.
Fig. 5
Fig. 5
Topographic maps of resting-state low alpha connectivity (dwPLI) in GA-exposed and Unexposed infants at the sensor level. Topoplots represent average dwPLI at each electrode to all other electrodes. Pairwise functional connectivity is depicted for each group accompanying the topoplots. There were no differences between groups at any electrode. The scale is the same for both topoplots and heatmaps.
Fig. 6
Fig. 6
Resting-state functional connectivity strength (dwPLI) across all frequencies in GA-exposed and Unexposed infants at the source level.(For interpretation of the references to colour in this figure legend, the reader is referred to the web version of this article.)
Fig. 7
Fig. 7
Functional connectivity by age at the source level. (For interpretation of the references to colour in this figure legend, the reader is referred to the web version of this article.)
Fig. 8
Fig. 8
Theta functional connectivity matrices in age groups between 1 and 12 months in GA-exposed (B, D, F) and Unexposed (A. C, E) infants. Pairwise functional connectivity between ROI pairs is presented for each age and exposure group accompanying. There were no differences between participants exposed and unexposed to general anesthesia at any ROI.
Fig. 9
Fig. 9
Low alpha functional connectivity matrices in age groups between 1 and 12 months in GA-exposed (B, D, F) and Unexposed (A, C, E) infants. Pairwise functional connectivity between ROI pairs is presented for each age and exposure group accompanying. There were no differences between participants exposed and unexposed to general anesthesia at any ROI.
Fig. 10
Fig. 10
Small-worldness by age at the sensor level. Scatter plots represent the area under the curve in a range of sparsity thresholds (10% to 50% in 5% steps), calculated for whole brain networks in frequency bands of interest. Sigma – small worldness, AUC – area under the curve, mo – months.
Fig. 11
Fig. 11
Small-worldness by age at the source level.

References

    1. Bach A.M., Xie W., Piazzoli L., Jensen S.K.G., Afreen S., Haque R., Petri W.A., Nelson C.A. Systemic inflammation during the first year of life is associated with brain functional connectivity and future cognitive outcomes. Dev. Cogn. Neurosci. 2022;53 doi: 10.1016/j.dcn.2021.101041. - DOI - PMC - PubMed
    1. Barton, K. (2015). MuMIn: Multi-model inference. R package version 1.9.13. Version, 1.
    1. Bastos A.M., Schoffelen J.-M. A Tutorial Review of Functional Connectivity Analysis Methods and Their Interpretational Pitfalls. Front. Syst. Neurosci. 2016;9 doi: 10.3389/fnsys.2015.00175. - DOI - PMC - PubMed
    1. Bates, D., Maechler, M., Bolker, B., & Walker, S. (2014). Lme4: Linear mixed-effects models using S4 classes. R package version 1.1-6. R.
    1. Bathelt J., O’Reilly H., Clayden J.D., Cross J.H., De Haan M. Functional brain network organisation of children between 2 and 5years derived from reconstructed activity of cortical sources of high-density EEG recordings. Neuroimage. 2013;82:595–604. doi: 10.1016/j.neuroimage.2013.06.003. - DOI - PubMed

Publication types