

Gut microbial β-glucuronidases influence endobiotic homeostasis and are modulated by diverse therapeutics
- PMID: 38754417
- PMCID: PMC11176022
- DOI: 10.1016/j.chom.2024.04.018
Gut microbial β-glucuronidases influence endobiotic homeostasis and are modulated by diverse therapeutics
Abstract
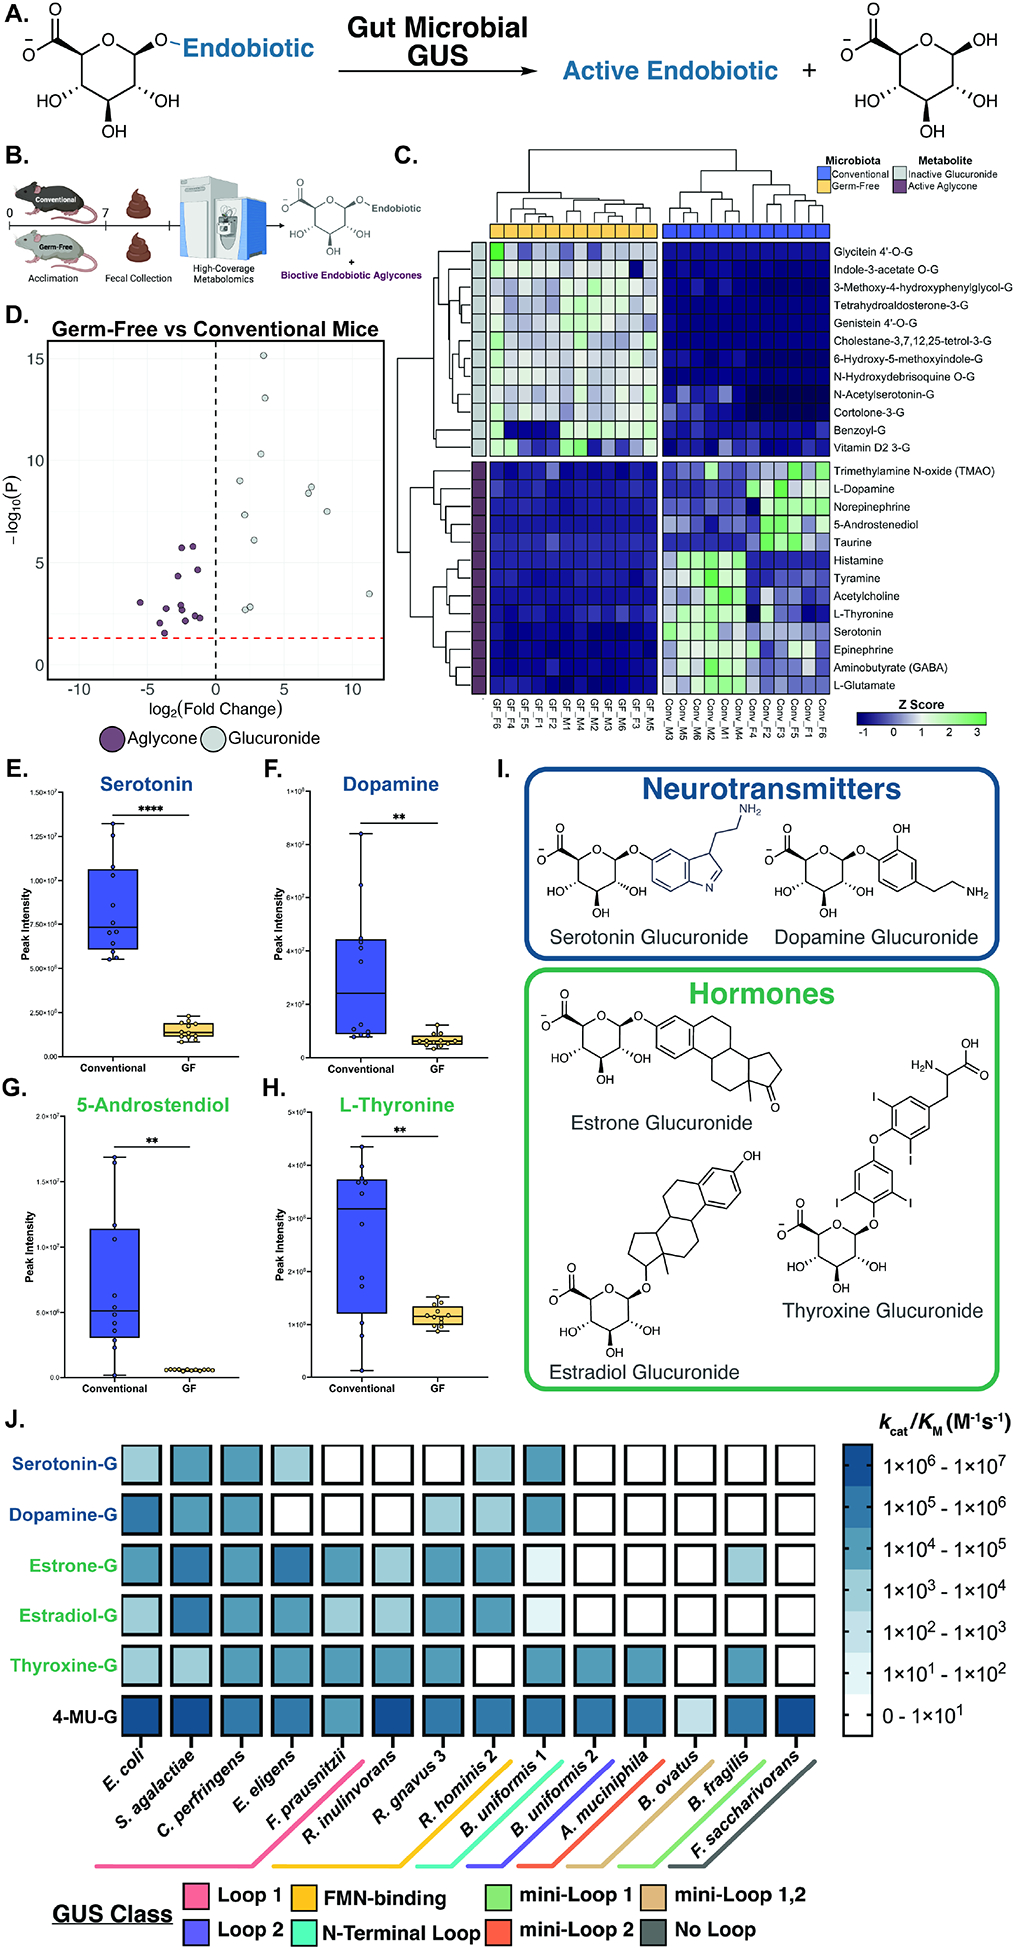
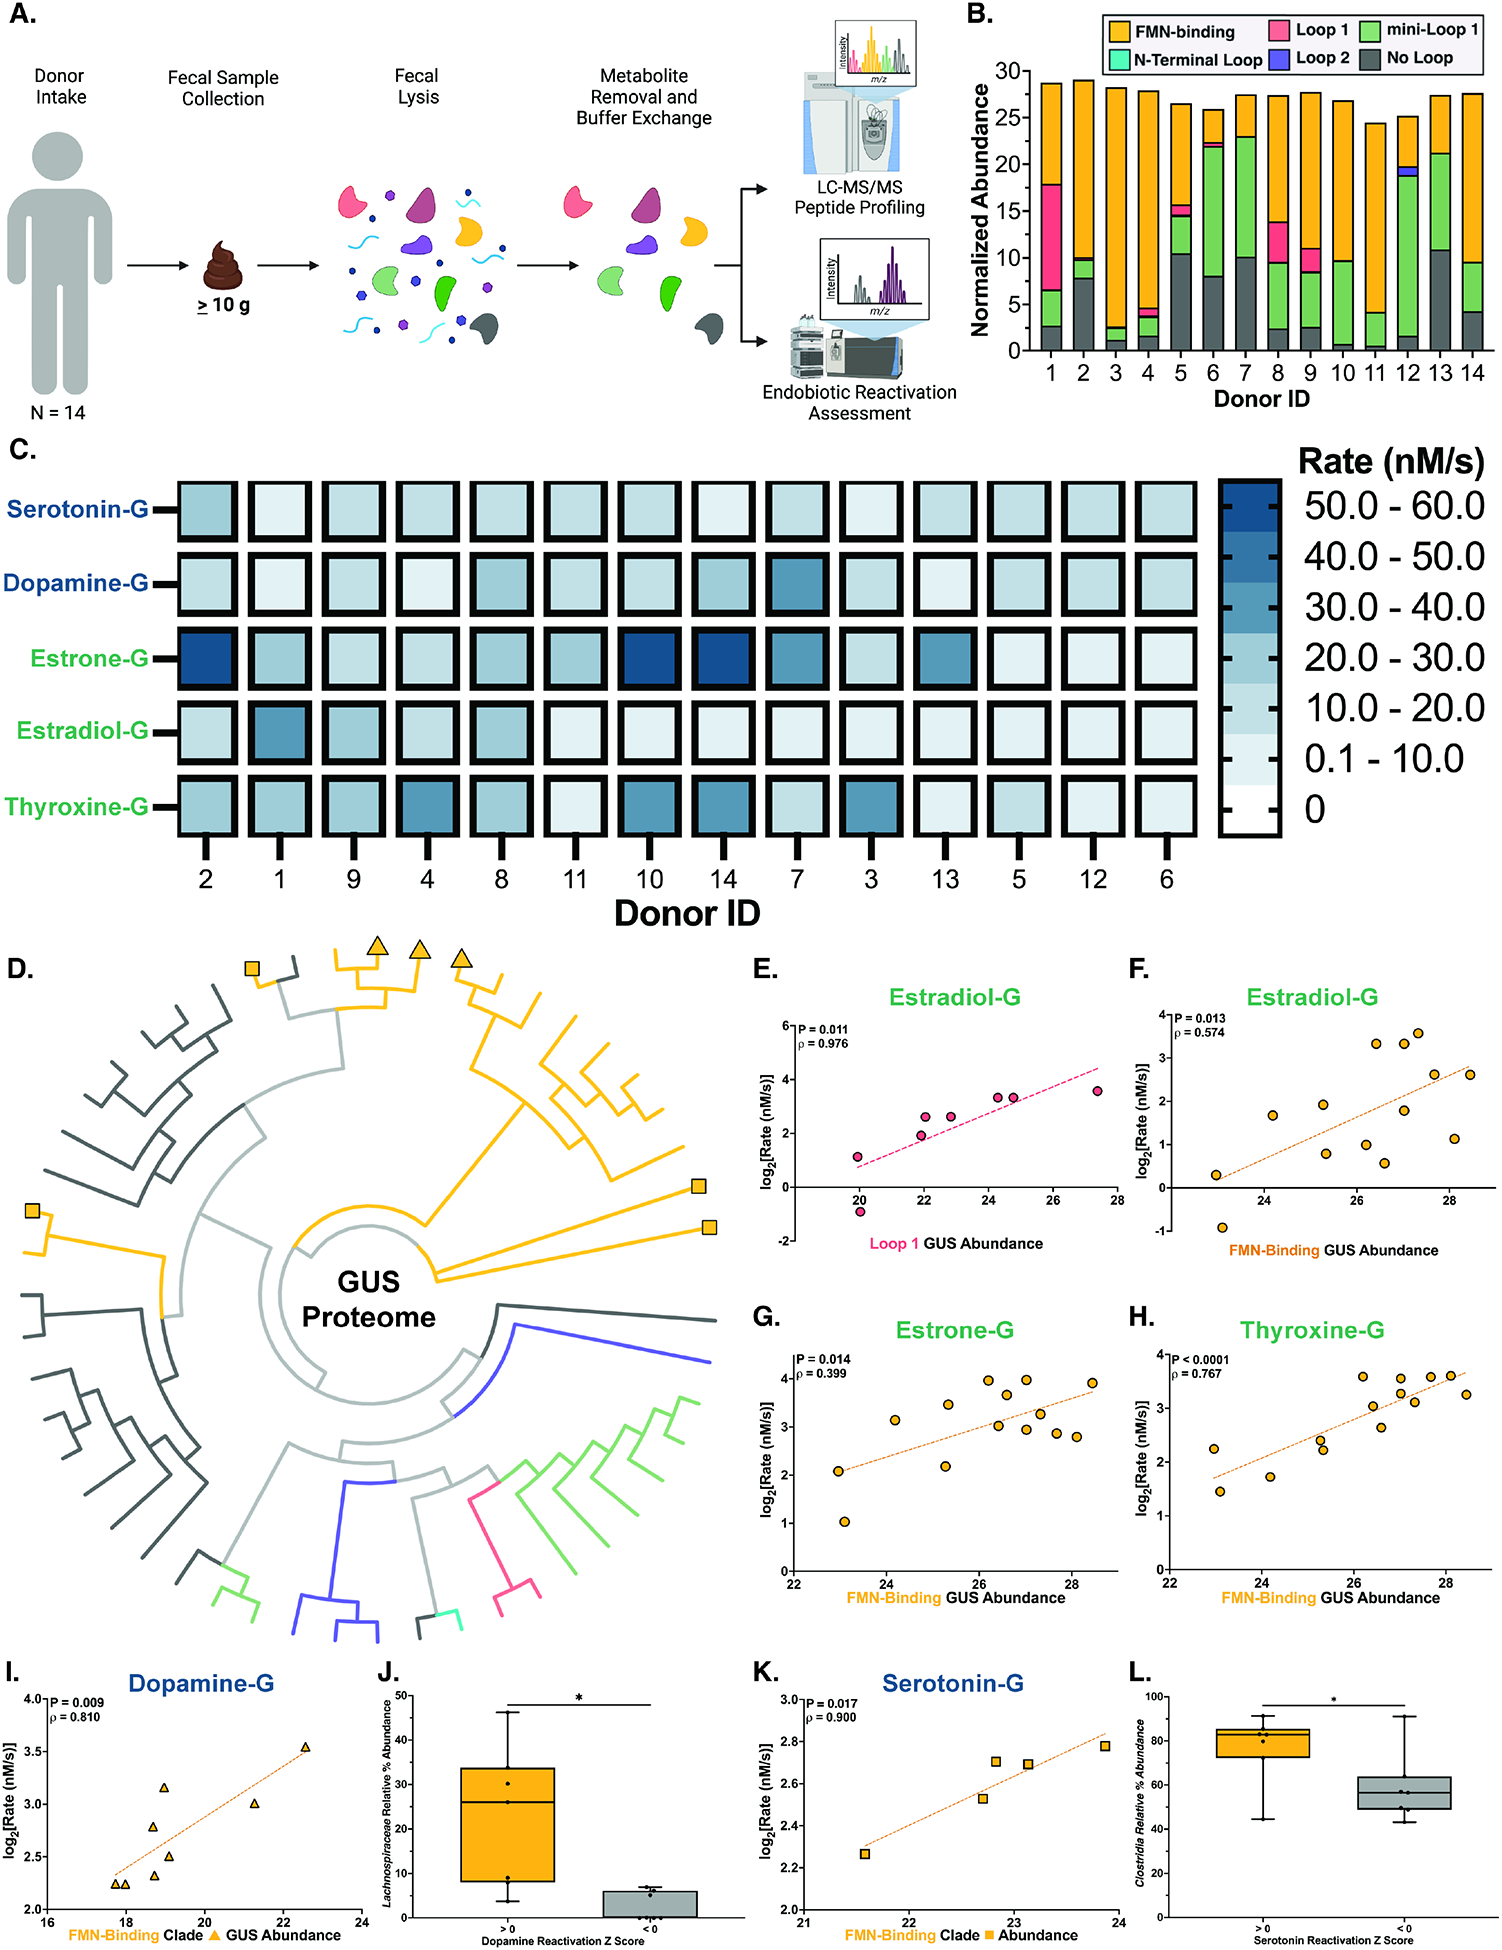
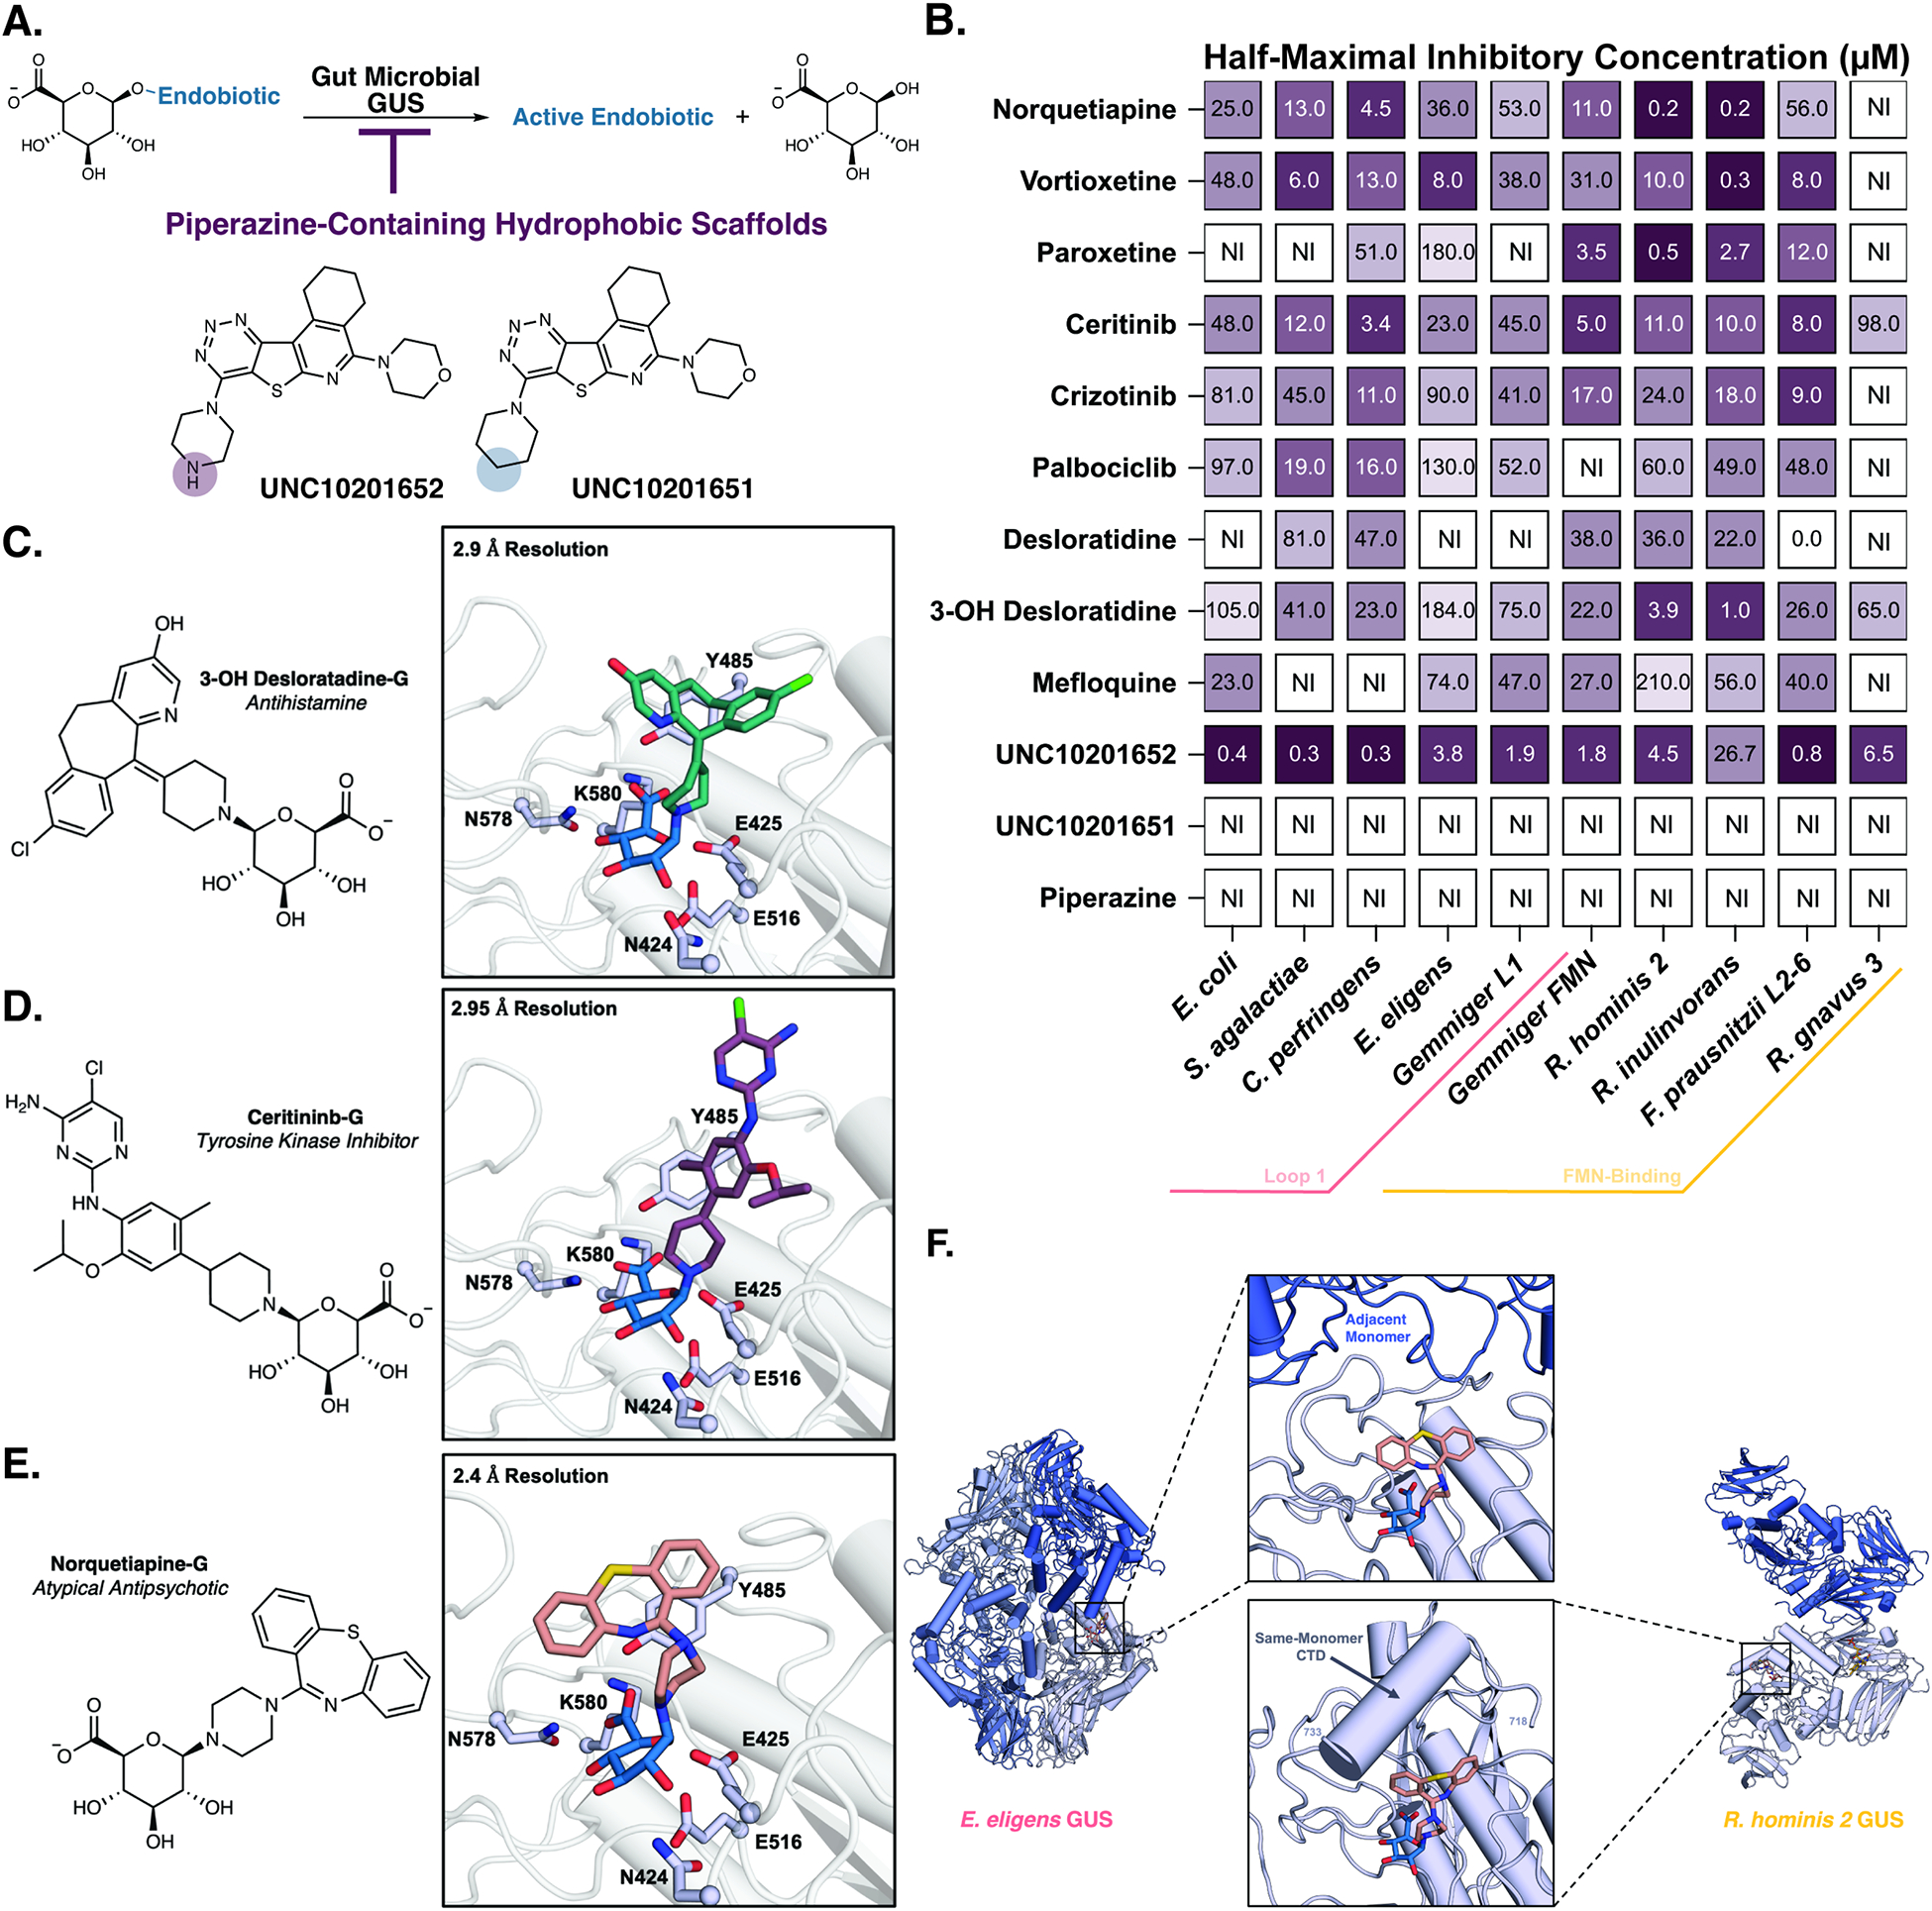
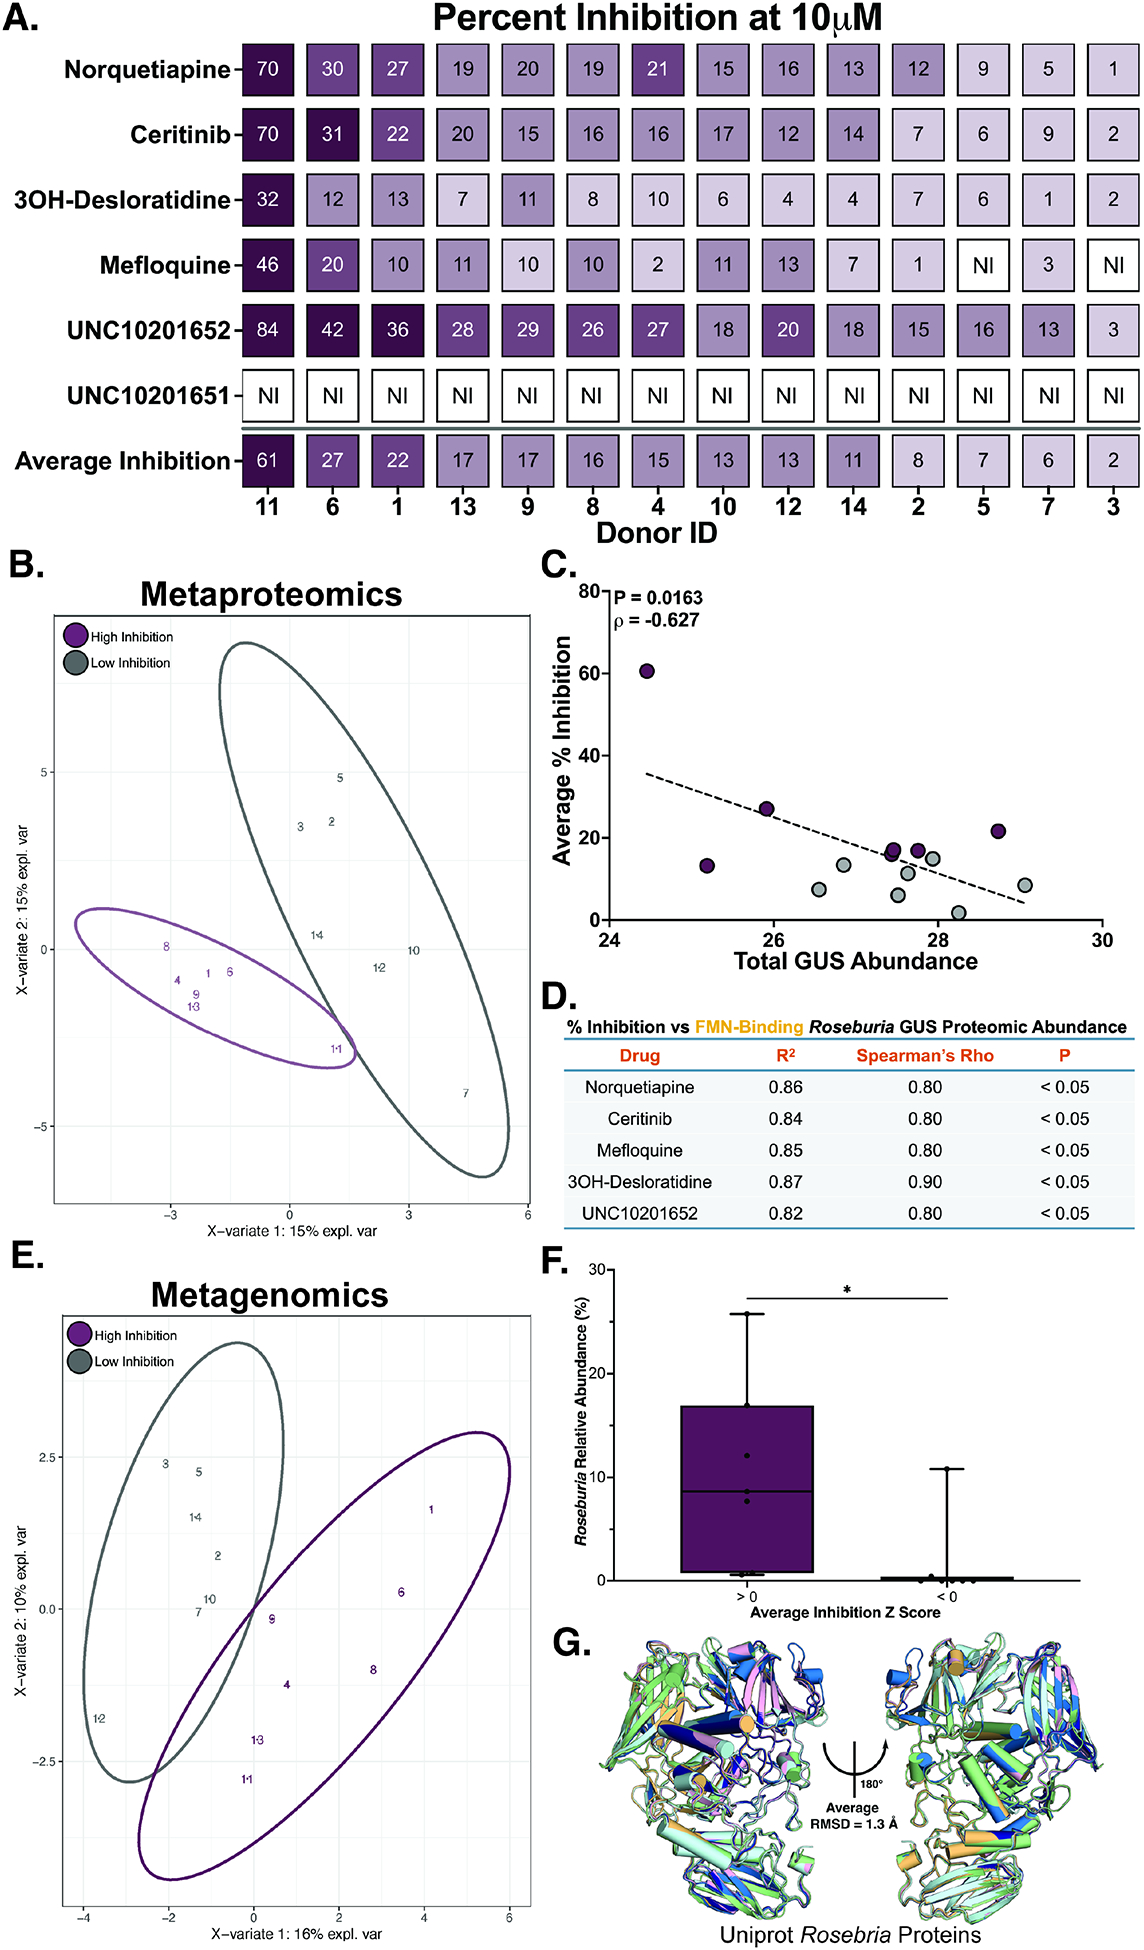
Hormones and neurotransmitters are essential to homeostasis, and their disruptions are connected to diseases ranging from cancer to anxiety. The differential reactivation of endobiotic glucuronides by gut microbial β-glucuronidase (GUS) enzymes may influence interindividual differences in the onset and treatment of disease. Using multi-omic, in vitro, and in vivo approaches, we show that germ-free mice have reduced levels of active endobiotics and that distinct gut microbial Loop 1 and FMN GUS enzymes drive hormone and neurotransmitter reactivation. We demonstrate that a range of FDA-approved drugs prevent this reactivation by intercepting the catalytic cycle of the enzymes in a conserved fashion. Finally, we find that inhibiting GUS in conventional mice reduces free serotonin and increases its inactive glucuronide in the serum and intestines. Our results illuminate the indispensability of gut microbial enzymes in sustaining endobiotic homeostasis and indicate that therapeutic disruptions of this metabolism promote interindividual response variabilities.
Keywords: FDA-approved drugs; X-ray crystallography; hormones; interindividual response variability; metabolism; metagenomics; metaproteomics; multi-omics; neurotransmitters; β-glucuronidase.
Copyright © 2024 The Author(s). Published by Elsevier Inc. All rights reserved.
Conflict of interest statement
Declaration of interests M.R.R. is a founder of Symberix, Inc., which is developing microbiome-targeted therapeutics. M.R.R. has also received research funding from Eli Lilly.
Figures
Similar articles
-
Gut microbial β-glucuronidases reactivate estrogens as components of the estrobolome that reactivate estrogens.J Biol Chem. 2019 Dec 6;294(49):18586-18599. doi: 10.1074/jbc.RA119.010950. Epub 2019 Oct 21. J Biol Chem. 2019. PMID: 31636122 Free PMC article.
-
Structure, function, and inhibition of drug reactivating human gut microbial β-glucuronidases.Sci Rep. 2019 Jan 29;9(1):825. doi: 10.1038/s41598-018-36069-w. Sci Rep. 2019. PMID: 30696850 Free PMC article.
-
Impact of host and environmental factors on β-glucuronidase enzymatic activity: implications for gastrointestinal serotonin.Am J Physiol Gastrointest Liver Physiol. 2020 Apr 1;318(4):G816-G826. doi: 10.1152/ajpgi.00026.2020. Epub 2020 Mar 9. Am J Physiol Gastrointest Liver Physiol. 2020. PMID: 32146834
-
Glucuronides in the gut: Sugar-driven symbioses between microbe and host.J Biol Chem. 2017 May 26;292(21):8569-8576. doi: 10.1074/jbc.R116.767434. Epub 2017 Apr 7. J Biol Chem. 2017. PMID: 28389557 Free PMC article. Review.
-
The role of gut microbial β-glucuronidases in carcinogenesis and cancer treatment: a scoping review.J Cancer Res Clin Oncol. 2024 Nov 13;150(11):495. doi: 10.1007/s00432-024-06028-2. J Cancer Res Clin Oncol. 2024. PMID: 39537966 Free PMC article.
Cited by
-
Gut Microbiota Disruption in Hematologic Cancer Therapy: Molecular Insights and Implications for Treatment Efficacy.Int J Mol Sci. 2024 Sep 24;25(19):10255. doi: 10.3390/ijms251910255. Int J Mol Sci. 2024. PMID: 39408584 Free PMC article. Review.
-
Improving breast cancer treatments using pharmacomicrobiomics.mBio. 2025 Feb 5;16(2):e0342224. doi: 10.1128/mbio.03422-24. Epub 2025 Jan 17. mBio. 2025. PMID: 39818941 Free PMC article.
-
The gut microbiota-immune-brain axis: Therapeutic implications.Cell Rep Med. 2025 Mar 18;6(3):101982. doi: 10.1016/j.xcrm.2025.101982. Epub 2025 Mar 6. Cell Rep Med. 2025. PMID: 40054458 Free PMC article. Review.
-
Activity-based metaproteomics driven discovery and enzymological characterization of potential α-galactosidases in the mouse gut microbiome.Commun Chem. 2024 Aug 16;7(1):184. doi: 10.1038/s42004-024-01273-5. Commun Chem. 2024. PMID: 39152233 Free PMC article.
-
The microbiota-gut-brain axis and central nervous system diseases: from mechanisms of pathogenesis to therapeutic strategies.Front Microbiol. 2025 Jun 13;16:1583562. doi: 10.3389/fmicb.2025.1583562. eCollection 2025. Front Microbiol. 2025. PMID: 40584038 Free PMC article. Review.
References
-
- Sun W, Guo Y, Zhang S, Chen Z, Wu K, Liu Q, Liu K, Wen L, Wei Y, Wang B, Chen D. 2018. Fecal Microbiota Transplantation Can Alleviate Gastrointestinal Transit in Rats with High-Fat Diet-Induced Obesity via Regulation of Serotonin Biosynthesis. Biomed Res Int. 2018. doi: 10.1155/2018/8308671 - DOI - PMC - PubMed
MeSH terms
Substances
Grants and funding
LinkOut - more resources
Full Text Sources
