. 2024 Jun 18;5(6):101572.
doi: 10.1016/j.xcrm.2024.101572. Epub 2024 May 15.

CD37 is a safe chimeric antigen receptor target to treat acute myeloid leukemia

Affiliations

CD37 is a safe chimeric antigen receptor target to treat acute myeloid leukemia

Benjamin Caulier et al. Cell Rep Med. .

Abstract

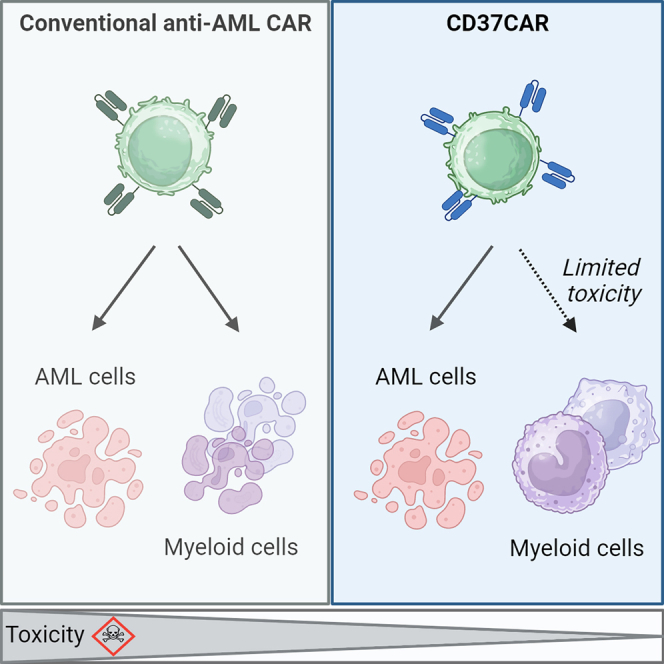
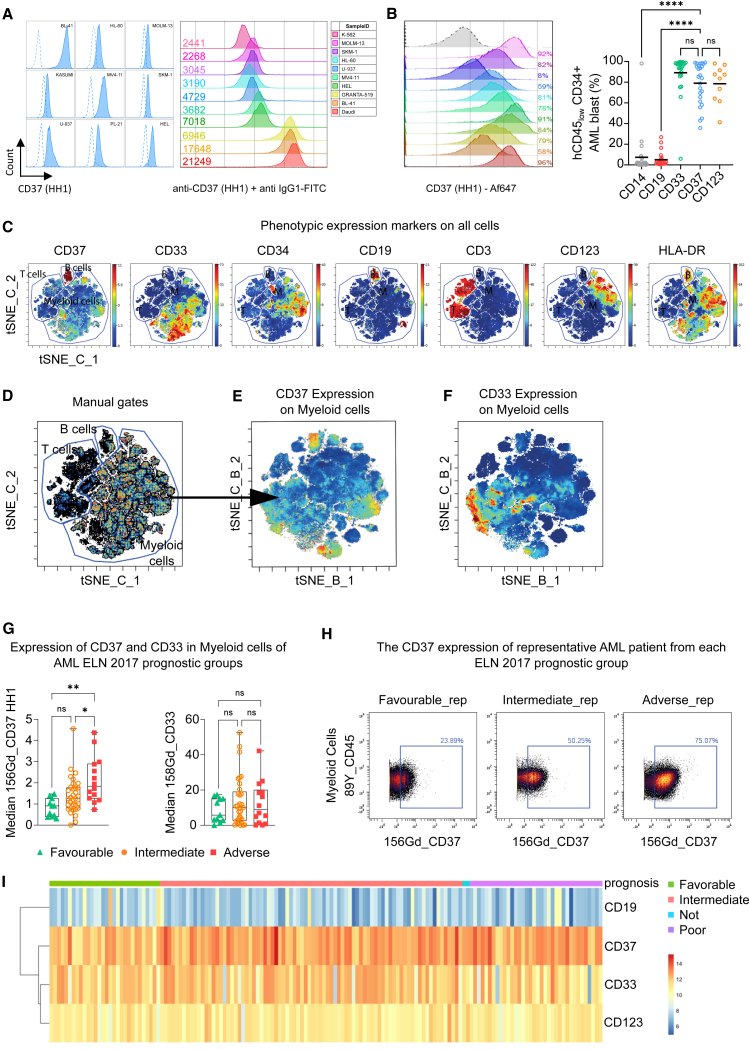
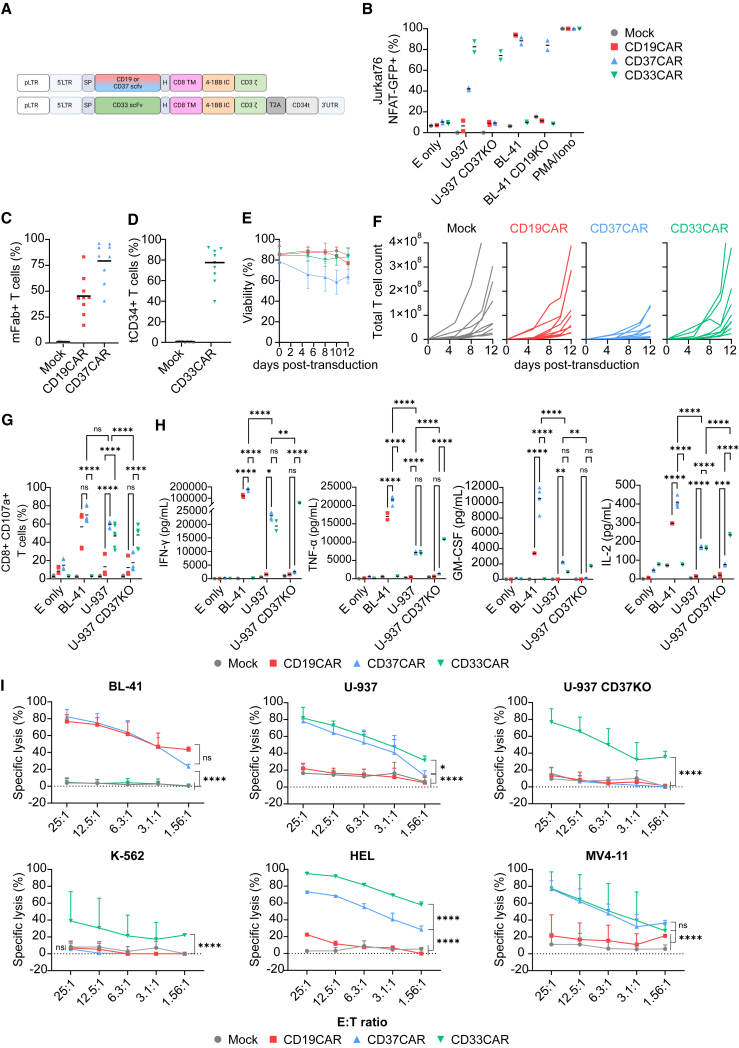
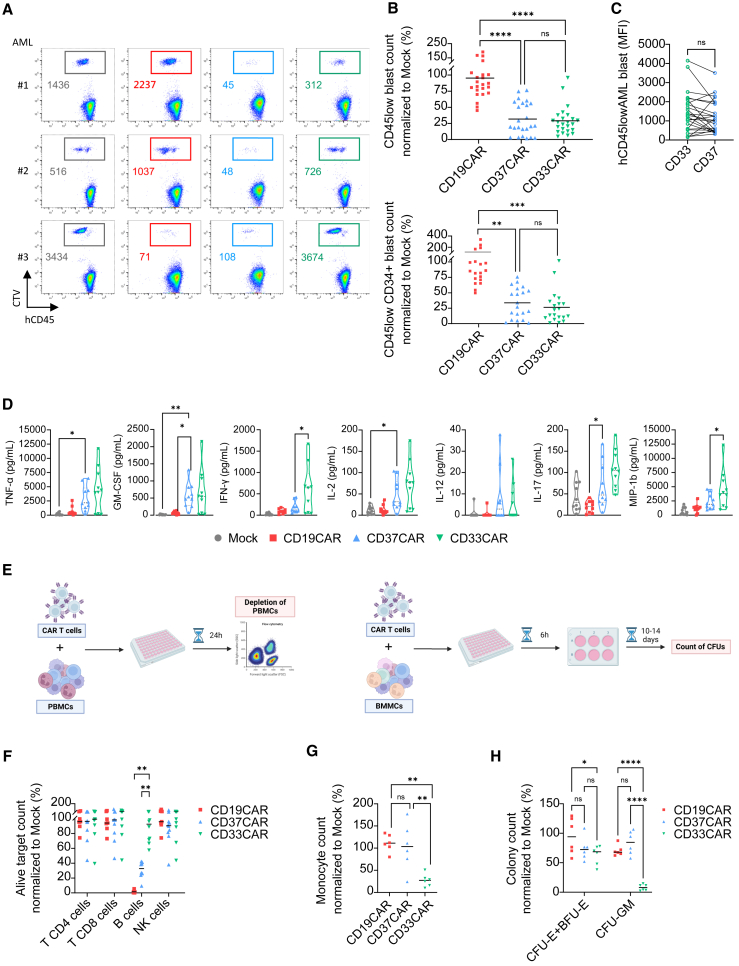
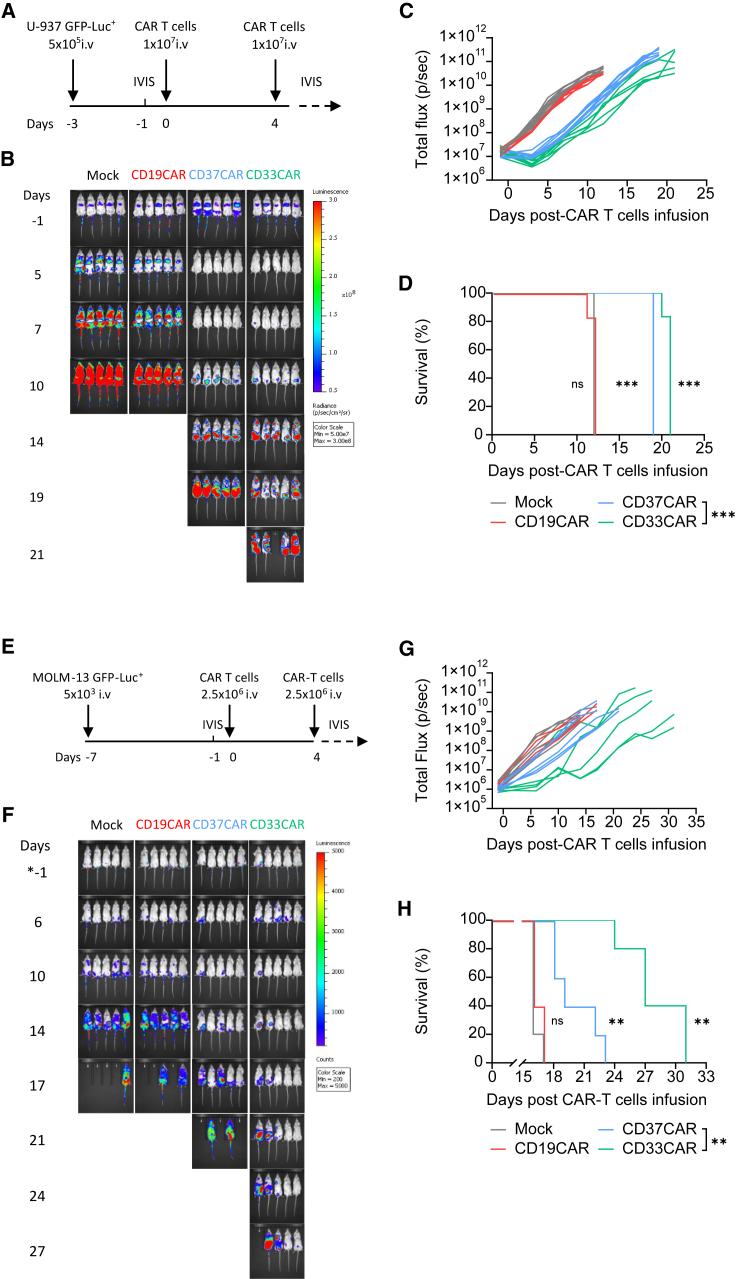
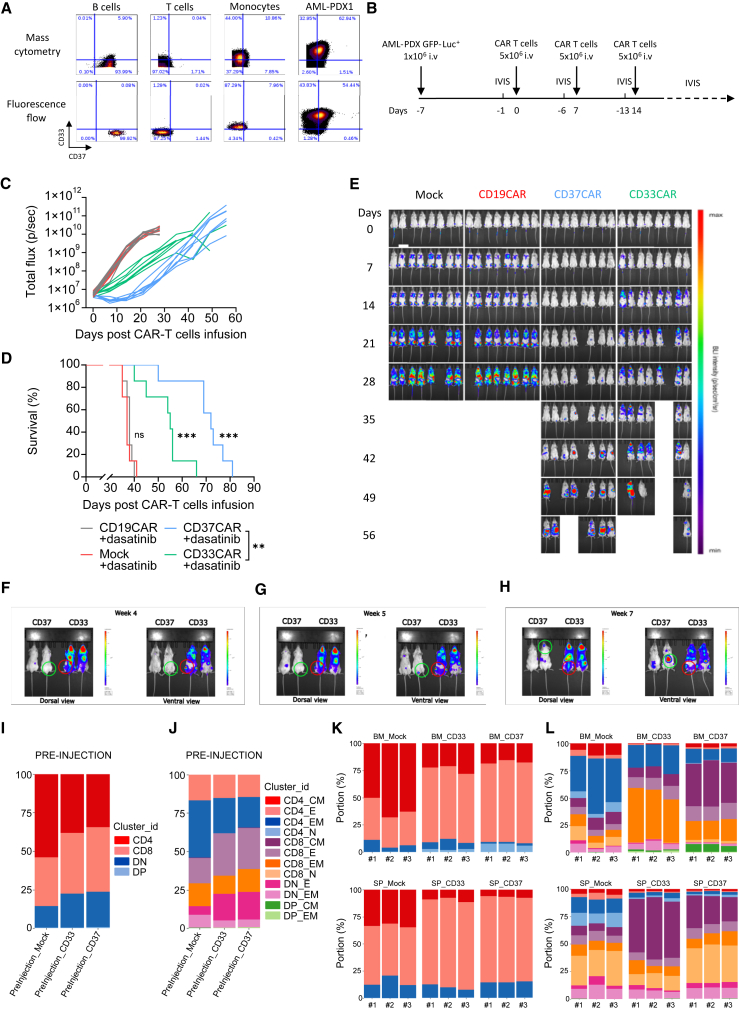
Acute myeloid leukemia (AML) is characterized by the accumulation of immature myeloid cells in the bone marrow and the peripheral blood. Nearly half of the AML patients relapse after standard induction therapy, and new forms of therapy are urgently needed. Chimeric antigen receptor (CAR) T therapy has so far not been successful in AML due to lack of efficacy and safety. Indeed, the most attractive antigen targets are stem cell markers such as CD33 or CD123. We demonstrate that CD37, a mature B cell marker, is expressed in AML samples, and its presence correlates with the European LeukemiaNet (ELN) 2017 risk stratification. We repurpose the anti-lymphoma CD37CAR for the treatment of AML and show that CD37CAR T cells specifically kill AML cells, secrete proinflammatory cytokines, and control cancer progression in vivo. Importantly, CD37CAR T cells display no toxicity toward hematopoietic stem cells. Thus, CD37 is a promising and safe CAR T cell AML target.

Keywords: AML; CAR T cell; CD37; acute myeloid leukemia; chimeric antigen receptor; hematopoietic stem cell; immunotherapy; patient-derived xenograft.


Conflict of interest statement

Declaration of interests The CD37CAR construct has been patented (WO2017118745A1) and E.M.I., G.K., and S.W. are listed among the inventors. S.K. has received honoraria from TCR2 Inc., Miltenyi, Novartis, BMS, and GSK. S.K. is inventor of several patents in the field of immuno-oncology. S.K. received license fees from TCR2 Inc. and Carina Biotech. S.K. received research support from TCR2 Inc., Plectonic GmBH, Tabby Therapeutics, and Arcus Bioscience for work unrelated to this manuscript. The funding agencies had no role in the conduction and management of the presented research and were not involved in the preparation of this manuscript.

Figures

None
Graphical abstract
Figure 1
Figure 1
CD37 expression on AML (A) CD37 staining of different AML cell lines and BL-41 (B cell lymphoma) HH1 antibody. The dotted line represents the corresponding murine IgG1 isotype control (left). Surface CD37 protein quantification of K-562 (CML), U-937, MV4-11, MOLM-13, HEL (AML), and BL-41 (B cell lymphoma) (right). The murine IgG1 anti-CD37 mAb clone HH1 was used for the detection. A murine IgG1 isotype was used to set the background. The numbers indicate the amount of CD37 molecules per cell. (B) CD37 staining in primary samples. (Left) Percentage of hCD45+ CD37+ cells in primary AML samples used as PDX models (n = 11). The anti-CD37 HH1 was used, and the dotted line represents the isotype control. (Right) Percentage of CD14, CD19, CD33, CD37, and CD123 surface proteins on hCD45low CD34+ AML blast population from primary BM samples (n = 25). Black bar represents the mean. One-way ANOVA followed by Dunnett’s multiple comparison tests is displayed, ∗∗∗∗p < 0.0001, ns = not significant. (C) Expression of CD37, CD33, CD34, CD19, CD3, CD123, and HLA-DR are shown as heat dot plot on tSNE-Cuda (tSNE_C) of concatenated AML patients (n = 59). The markers shown are indicative of cell subset , B cells (CD19), T cells (CD3), and AML (CD33, CD34, CD123, and HLA-DR). Manual gates are annotated. (D) The tSNE-Cuda here with manual gates drawn guided by CD3 and CD19. Further analysis was made with the myeloid cell gate. (E) The expression of CD37 in myeloid cells here shown as heat on the tSNE-Cuda of the myeloid cell gate from (B). (F) The expression of CD33 in myeloid cells here shown as heat on the tSNE-Cuda of the myeloid cell gate from (D). (G) The raw median expression intensity of CD37 and CD33 in myeloid cells grouped according to ELN 2017 risk stratification (n = 59). One-way ANOVA multiple comparison test identified that the expression of CD37 was found to be significantly increased for the adverse patient group in comparison to the good (p = 0.0011) and intermediate (p = 0.0247) patient group. No significant correlation of CD33. One-way ANOVA found no significance when investigating the expression of CD33 between ELN 2017 risk groups. (H) Bi-axial plots of CD45 vs. CD37 expression on myeloid cells of a patient representative from each ELN 2017 risk group showing a 25% stepwise increase between the risk groups. The tSNE-Cuda of the concatenated AML patients (n = 59) using only myeloid cells colored by population annotated as MC. (I) CD19, CD37, CD33, and CD123 (IL3RA) gene expression analysis from RNA-seq dataset (TCGA-LAML, n = 150). The heatmap shows the normalized RNA-seq counts (DESeq2) for the four genes and each column represents a patient. Patient clustering was performed according to the prognosis (favorable, intermediate, poor).
Figure 2
Figure 2
CD37CAR T cells against AML (A) Design of retrovirus vectors encoding second-generation CARs comprising a murine anti-human single-chain variable fragment (scFv), the CD8a hinge and transmembrane domains, the cytoplasmic domain of 4-1BB costimulatory molecule, and the CD3ζ subunit of the TCR. Sequences are provided in Figure S6. (B) Percentage of activation of J76NFAT-GFP cells transduced with either mock, CD19, CD37, or CD33CAR and co-cultured for 24 h with the indicated cell lines or left alone (E only). E:T = 1:2 (n = 2 independent experiments, mean). (C–F) Percentage of CAR expression (C) and (D), viability (E), and expansion in total T cell count (F) of T cell donors bearing the CAR constructs (n = 9) for 12 days post transduction. The CAR expression was detected using an anti-murine fragment antigen-binding (Fab) antibody for CD19 and CD37CAR and an anti-CD34 mAb for CD33CAR, at day 4 post-transduction. The black bar represents the mean. (G) Percentage of CD8+ CD107a+ T cells upon 6 h of co-culture with the indicated cell lines or left alone (E only). E:T = 1:2 (n = 3 donors in duplicates, mean). One-way ANOVA followed by Dunnett’s multiple comparison tests is displayed, ∗∗∗∗p < 0.0001, ns = not significant. (H) Secretion (pg/mL) of IFN-γ, TNF-α, IL-2, and GM-CSF in the supernatant of T cell co-culture with the indicated cell lines or left alone (E only) after 24 h. E:T = 1:2 (n = 2 donors except CD37CAR n = 4, mean), ∗∗p < 0.01, ∗∗∗p < 0.001, ∗∗∗∗p < 0.0001, ns = not significant. (I) Specific cytotoxicity of T cells incubated for 4 h with BL-41; 6 h with U-937, U-937 CD37KO, K-562, and HEL; or 7 h with MV4-11. Different E:T ratios (n = 4 donors except HEL = 2, mean ± SD). Two-way ANOVA followed by Tukey’s (G) and (H) or Dunnett’s (I) multiple comparisons tests. Comparisons versus CD37CAR are displayed, ∗∗∗∗p < 0.0001, ns = not significant.
Figure 3
Figure 3
CD37CAR is as efficient but safer than CD33CAR (A) Flow cytometry-based, depletion killing assay of two AML(#1 and #2) and one B-ALL (#3) patients’ BMMCs labeled with CTV and co-cultured with T cells for 24 h at E:T = 5:1. Remining live cells are gated using color code corresponding to the construct expressed by T cells, mock = black, CD19CAR = red, CD37CAR = blue, and CD33CAR = green. Numbers are event count. (B) Same as in (A), counts of live AML patients’ CD45low blasts (n = 24) and CD45low CD34+ blasts (n = 20) normalized to mock (%) after 24 h of co-culture. One-way ANOVA followed by Tukey’s multiple comparisons tests, bars are mean, ∗∗p < 0.01, ∗∗∗p < 0.001, ∗∗∗∗p < 0.0001, ns = not significant. (C) Geometric median fluorescent intensity of CD33 and CD37 staining on AML patients (n = 24). Paired t test was used for statistical analysis, ns = not significant. (D) Cytokine secretion (pg/mL) of TNF-α, IFN-γ, GM-CSF, G-CSF, IL-2, IL-12, IL-15, IL-17, and MIP-1b in the supernatant of (A) and (B) after 24 h of co-culture. E:T = 1:2 (n = 2 T cell donors co-cultured with five AML samples each; mean). One-way ANOVA followed by Dunnett’s multiple comparisons tests. Only significant comparisons to CD37CAR are displayed, ∗p < 0.05, ∗∗ = p < 0.01. (E) Evaluation of CAR T cell toxicity toward healthy blood and hematopoiesis. Healthy donors’ PBMCs (labeled CTV) (right) and BMMCs (containing CD34+) (left) were co-incubated with autologous T cells. After 24 h of co-culture, PBMCs were then analyzed by flow cytometry for depletion killing. After 6 h of co-culture, BMMCs were further cultured for 10 days in a colony-forming unit (CFU) assay. (F) Counts of CD45+ CD3+ CD4+ T cells alive, CD45+ CD3+ CD8+ T cells, CD45+ CD19+ B cells, CD45+ CD3 CD19 CD56+ natural killer (NK) cells, and CD45+ CD14+ monocytes normalized to mock (%) after 24 h of co-culture (n = 7 donors for CD19CAR and n = 10 donors for CD37and CD33CAR; mean). Bars are mean, two-way ANOVA followed by Tukey’s multiple comparisons tests. Only significant comparisons are displayed, ∗∗p < 0.01. (G) Counts of CD45+ CD11b+ monocytes alive normalized to mock (%) after 24 h of co-culture with CD19CAR, CD37CAR, and CD33CAR (n = 6 donors). Bars represent means, one-way ANOVA followed by Tukey’s multiple comparisons tests, ∗∗p < 0.01, ns = not significant. (H) CFU counts of erythroid colonies (CFU-erythroid and burst-forming unit-erythroid) and myeloid colonies (CFU-granulocyte macrophage) normalized to mock (%) (n = 2 donors, triplicates, mean). Two-way ANOVA followed by Tukey’s multiple comparisons tests, ∗p < 0.05, ∗∗∗∗p < 0.0001, ns = not significant.
Figure 4
Figure 4
CD37CAR T cells have potent anti-AML activity in vivo (A) Schematic of the U-937-based in vivo experimental design. Three days before T cell injection, 5 × 105 U-937 GFP-Luc+ cells were inoculated intravenously (i.v.) in NXG mice. In vivo imaging system (IVIS) was performed 1 day before T cell injection to confirm tumor establishment and randomize the mice. On day 0 and day 4, 1 × 107 mock, CD19, CD37, or CD33CAR T cells were injected i.v. The percentage of CAR-expressing population was adjusted between the groups to 50% using mock cells. Tumor growth was tracked two times a week using IVIS. (B) Representative bioluminescence images. (C) Bioluminescence kinetics of U-937 GFP-Luc+ cells growth in NXG mice treated with CAR T cells (n = 6 mice per group). (D) Kaplan-Meier survival curves of NXG mice bearing U-937 GFP-Luc+ cells and treated with CAR T cells (n = 6 mice per group). Comparisons of survival curves were determined by log rank test. (E) Schematic of the MOLM-13-based in vivo experimental design. Seven days before T cell injection, 5 × 103 MOLM-13 GFP-Luc+ cells were inoculated i.v. in NXG mice. IVIS was performed 1 day before T cell injection to confirm tumor establishment and randomize the mice. On day 0 and day 4, 2.5 × 106 mock, CD19, CD37, or CD33CAR T cells were injected i.v. The percentage of the CAR-expressing population was adjusted between the groups to 40% using mock cells. Tumor growth was tracked two times a week using IVIS. (F) Representative bioluminescence images. (G) Bioluminescence kinetics of MOLM-13 GFP-Luc+ cells growth in NXG mice treated with CAR T cells (n = 5 mice per group). (H) Kaplan-Meier survival curves of NXG mice bearing MOLM-13 GFP-Luc+ cells and treated with CAR T cells (n = 5 mice per group). Comparisons of survival curves were determined by log rank test, ∗∗∗p < 0.001, ns = not significant.
Figure 5
Figure 5
CD37CAR T cells control AML-PDX model (A) Detection of CD37 and CD33 in AML-PDX1 cells and healthy donor cells by mass cytometry and flow cytometry. (B) Schematic representation of the PDX in vivo experimental design. Seven days before the first T cell injection, 1 × 106 AML-PDX GFP-Luc+ cells (F2) were inoculated i.v. in NOD scid gamma (NSG) mice. IVIS was performed 1 day before T cell injection to confirm tumor establishment and randomize the mice, and 5 × 106 mock, CD19, CD37, or CD33CAR T cells expanded with dasatinib were injected i.v. on day 0, 7, and 14. The percentage of CAR-expressing population was adjusted between the groups to 50% using mock cells. Tumor growth was tracked weekly using IVIS for 6 weeks after T cell injection. (C) Bioluminescence kinetics of the AML-PDX GFP-Luc+ cells growth in NSG mice treated with CAR T cells (n = 7 mice per group). (D) Kaplan-Meier survival curves of NSG mice bearing AML-PDX GFP-Luc+ cells and treated with CAR T cells (n = 7 mice per group). Comparisons of survival curves were determined by log rank test, ∗∗∗p < 0.001, ns = not significant. (E) Representative bioluminescence images. (F) Representative bioluminescence images of close-up BM area of mice treated with CD33CAR or CD37CAR. Dorsal and ventral view comparing the bioluminescence at week 4. The green circle (CD37CAR-treated mice) and the red circle (CD33CAR-treated mice) emphasize the re-growth of AML cancer cells in the mice. (G) Same as in (F) at week 5. (H) Same as in (F) at week 7. (I) MC of group CAR T cell at pre-injection using level 1 depth characterization. Pool of three mice per group. (J) MC of group CAR T cell at pre-injection using level 2 depth characterization. Pool of three mice per group. (K) MC of CAR T cells from three mice per group (#1, #2, #3) at day 6 after CAR T injection, grouped by anatomical site using level 1 depth characterization. (L) MC of CAR T cells from three mice per group (#1, #2, #3) at day 6 after CAR T injection, grouped by anatomical site using level 2 depth characterization.

Similar articles

Cited by

References

    1. Dohner H., Weisdorf D.J., Bloomfield C.D. Acute Myeloid Leukemia. N. Engl. J. Med. 2015;373:1136–1152. doi: 10.1056/NEJMra1406184. - DOI - PubMed
    1. Dohner H., Wei A.H., Appelbaum F.R., Craddock C., DiNardo C.D., Dombret H., Ebert B.L., Fenaux P., Godley L.A., Hasserjian R.P., et al. Diagnosis and management of AML in adults: 2022 recommendations from an international expert panel on behalf of the ELN. Blood. 2022;140:1345–1377. doi: 10.1182/blood.2022016867. - DOI - PubMed
    1. Döhner H., Estey E., Grimwade D., Amadori S., Appelbaum F.R., Büchner T., Dombret H., Ebert B.L., Fenaux P., Larson R.A., et al. Diagnosis and management of AML in adults: 2017 ELN recommendations from an international expert panel. Blood. 2017;129:424–447. doi: 10.1182/blood-2016-08-733196. - DOI - PMC - PubMed
    1. Williams B.A., Law A., Hunyadkurti J., Desilets S., Leyton J.V., Keating A. Antibody Therapies for Acute Myeloid Leukemia: Unconjugated, Toxin-Conjugated, Radio-Conjugated and Multivalent Formats. J. Clin. Med. 2019;8 doi: 10.3390/jcm8081261. - DOI - PMC - PubMed
    1. Boddu P., Kantarjian H., Garcia-Manero G., Allison J., Sharma P., Daver N. The emerging role of immune checkpoint based approaches in AML and MDS. Leuk. Lymphoma. 2018;59:790–802. doi: 10.1080/10428194.2017.1344905. - DOI - PMC - PubMed

MeSH terms