. 2024 Jul 5;31(7):1020-1037.e9.
doi: 10.1016/j.stem.2024.04.020. Epub 2024 May 15.

Autophagy counters inflammation-driven glycolytic impairment in aging hematopoietic stem cells

Affiliations

Autophagy counters inflammation-driven glycolytic impairment in aging hematopoietic stem cells

Paul V Dellorusso et al. Cell Stem Cell. .

Abstract

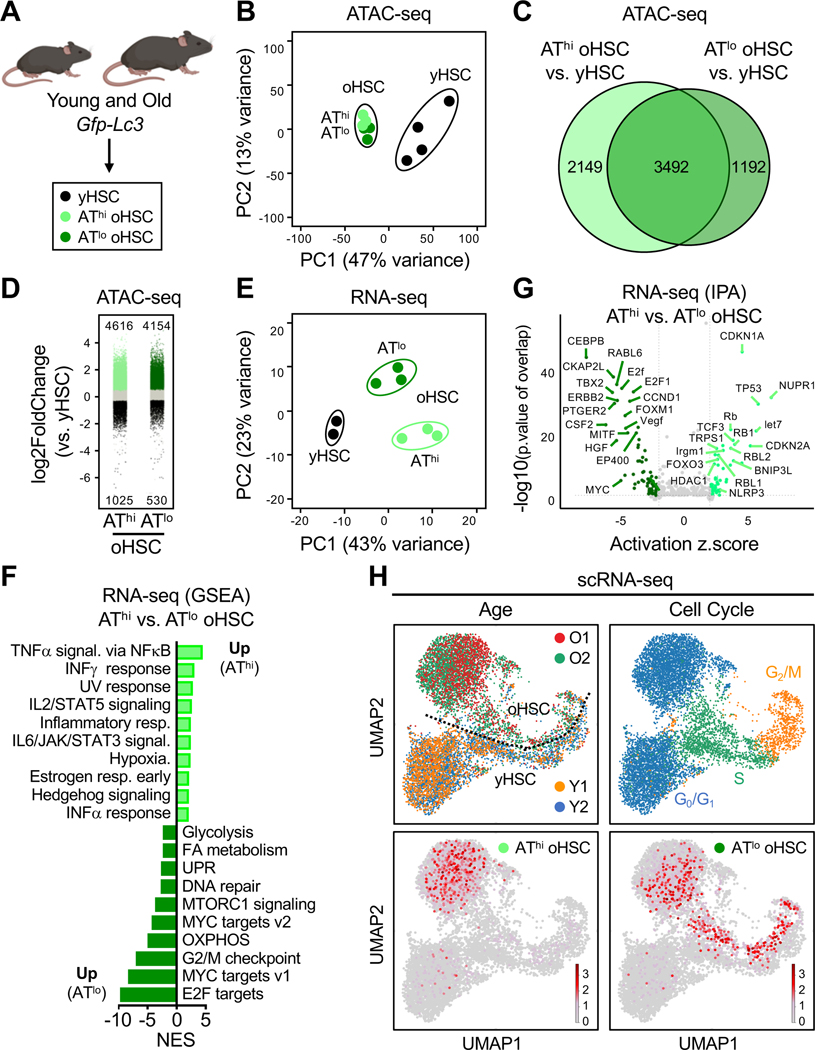
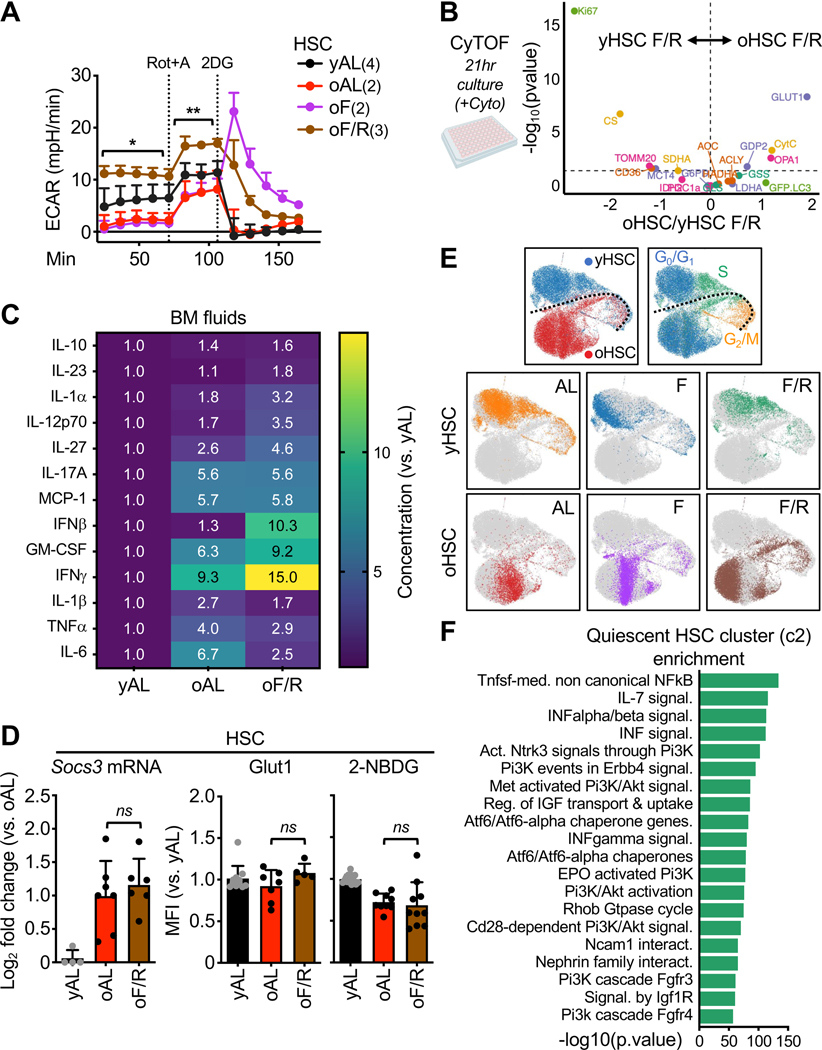
Autophagy is central to the benefits of longevity signaling programs and to hematopoietic stem cell (HSC) response to nutrient stress. With age, a subset of HSCs increases autophagy flux and preserves regenerative capacity, but the signals triggering autophagy and maintaining the functionality of autophagy-activated old HSCs (oHSCs) remain unknown. Here, we demonstrate that autophagy is an adaptive cytoprotective response to chronic inflammation in the aging murine bone marrow (BM) niche. We find that inflammation impairs glucose uptake and suppresses glycolysis in oHSCs through Socs3-mediated inhibition of AKT/FoxO-dependent signaling, with inflammation-mediated autophagy engagement preserving functional quiescence by enabling metabolic adaptation to glycolytic impairment. Moreover, we show that transient autophagy induction via a short-term fasting/refeeding paradigm normalizes glycolytic flux and significantly boosts oHSC regenerative potential. Our results identify inflammation-driven glucose hypometabolism as a key driver of HSC dysfunction with age and establish autophagy as a targetable node to reset oHSC regenerative capacity.

Keywords: aging; autophagy; hematopoietic stem cells; inflammation; metabolism; regeneration.


Conflict of interest statement

Declaration of interests E.P. is a member of the Cell Stem Cell advisory board.

Figures

Figure 1.
Figure 1.. Autophagy activation in old HSCs is associated with quiescence maintenance despite a molecular inflammation response signature.
A) HSC isolation strategy from young (2–3 months) and old Gfp-Lc3 (24–28 months) mice. B) Principal component (PC) analysis of ATAC-seq peaks at all genomic loci from yHSC, AThi oHSC, and ATlo oHSC. C) Venn diagram of differentially accessible (DA) peaks (LFC >=1 or <=−1, padj < 0.05) between AThi oHSC vs. yHSC and ATlo oHSC vs. yHSC. D) Directionality of DA peaks between AThi and ATlo oHSC vs. yHSC. Results show promoter proximal peaks within 1,000 bp of the transcriptional start site called by the MACS2 software. E) PC analysis of RNA-seq counts from yHSC, AThi oHSC, and ATlo oHSC. F) Gene set enrichment analysis (GSEA) of AThi vs. ATlo oHSC differentially expressed (DE) genes visualizing top 10 enriched and suppressed pathways by normalized enrichment score (NES) with FDR q-val <0.05. G) Ingenuity Pathway Analysis (IPA) upstream regulators enriched from DE genes (LFC >=1 or <=−1, padj < 0.05) in AThi vs. ATlo oHSC. Enriched regulators defined as Zscore >= 2 or <= −2 and p-val of overlap <0.05. H) Uniform manifold approximation and projection (UMAP) of yHSC and oHSC 10X Genomics scRNA-seq analyses from two biological replicates (top left) with cell cycle annotation (top right). Projection of index-sorted AThi (bottom left) and ATlo oHSCs (bottom right) transcriptomes from SMART-Seq2 scRNA-seq onto 10X Genomics UMAP. See also Figures S1 and S2.
Figure 2.
Figure 2.. Inflammatory stimuli activate a protective autophagy program in HSC.
A) Experimental scheme for acute IFNγ treatment (aIFN) in Gfp-Lc3 mice (top) with representative FACS plot of GFP-LC3 levels in HSCs (bottom). B) Normalized GFP-LC3 mean fluorescence intensity (MFI, top) and Dapi/Ki67 cell cycle status (bottom) at the indicated timepoints following IFNγ injection. C) HSC cellularity at 96hr following IFNγ injection in Atg12cKO (cKO) and control (Ctrl) mice. D) Changes in cell number and cleaved caspase 3/7 (CC3/7) levels in Atg12cKO and control HSCs ± 1μg/ml IFNγ. E) Experimental scheme for chronic IL-1β treatment (cIL1) in Gfp-Lc3 mice (top) with representative FACS plot of GFP-LC3 levels (middle) and quantification of GFP-LC3 MFI (bottom) in HSCs. F) Regenerative capacity of the indicated HSC populations following transplantation (Tplx) into lethally irradiated (IR) recipients. Results show overall engraftment in the peripheral blood (PB) over time (left) and HSC chimerism in donor bone marrow (BM) at 4 months (mo) post-Tplx (right). Data are means ± S.D. except for overall engraftment data (F) (± S.E.M.); *p ≤ 0.05, **p ≤ 0.01, ***p ≤ 0.001; ns, not significant. See also Figure S3.
Figure 3.
Figure 3.. Chronic inflammation suppresses PI3K/AKT/FoxO signaling and impairs glycolytic activity in HSCs.
A) Representative FACS plots and quantification of pAkt (T308), pFoxO1/3a (T24), and pFoxO1 (S256) MFI in vehicle (Veh) or chronic IL-1β (cIL1) treated young HSCs (top), and young and old HSCs (bottom). B) In vivo 2-NBDG uptake in young and old HSCs with scheme (left), representative FACS plot (middle) and quantification (right). C) Extracellular acidification rate (ECAR) measured by Seahorse glycolytic rate assay in yHSCs and oHSCs; Rot+A, rotenone + antimycin; 2DG: 2-deoxy-glucose. D) Representative immunofluorescent image of Glut1 expression in young and old HSCs (scale bar, 10 μm) E) Representative FACS plot and quantification of Glut1 surface expression in young and old HSCs. F) ECAR measured by Seahorse glycolytic rate assay in Veh and cIL1 HSC-enriched Lin-/c-Kit+/Sca-1+ (LSK) BM cells. Data are means ± S.D. except for Seahorse results (C,E) (± S.E.M.); *p ≤ 0.05, **p ≤ 0.01, ***p ≤ 0.001; ns, not significant. See also Figures S4.
Figure 4.
Figure 4.. Socs3 mediates the effect of chronic inflammation on HSC function.
A) Volcano plot of DE genes in oHSC vs. yHSC bulk RNA-seq highlighting Socs3 and AP-1 genes upregulation in oHSCs. B) qRT-PCR confirmation of Socs3 expression in oHSCs; nd, not detected. C) Survival of Ctrl and Socs3cKO mice following 20 days of chronic IL-1β (cIL1) treatment. D) Characterization of cIL1-exposed Ctrl and Socs3cKO mice for BM and HSC cellularity, pFoxO1S256 levels and Glut1 surface expression. E) Schematic of the mixed Ctrl and Socs3cKO BM chimera used for acute TNFα (aTNF) treatment. Lethally irradiated (IR) recipients were reconstituted with the indicated 1:1 mix of wild type (WT) competitor and GFP+ donor BM cells, treated with poly(IC) to induce Socs3 deletion at 1 month (star), and exposed to TNFα at 2 months post-transplantation (tplx). F) Characterization of aTNF-exposed donor Ctrl and Socs3cKO cells for BM and HSC cellularity, and autophagy engagement by normalized GFP-LC3 mean fluorescence intensity (MFI). G) Proposed model for the impact of chronic old BM niche inflammation on the AKT-FoxO phosphorylation cascade with consequences for glucose uptake, glycolytic capacity, and autophagy induction in old HSCs. Data are means ± S.D.; *p ≤ 0.05, **p ≤ 0.01, ***p ≤ 0.001; ns, not significant. See also Figures S5.
Figure 5.
Figure 5.. Metabolic profiling of yHSCs, AThi oHSCs, and ATlo oHSCs.
A) Heatmap of differentially expressed genes in AThi oHSC vs. ATlo oHSC or yHSC bulk RNA-seq showing fold change in selected metabolic enzymes and transcriptional regulators involved in nutrient metabolism. B) Differentially abundant metabolites for the indicated pairwise comparisons following low-input shotgun metabolomics. Results are shown with an exploratory threshold of logarithmic fold change (LFC) ≥ 0.6 and p < 0.10; LC-MS, Liquid chromatography-mass spectrometry. C) Levels of acetyl-CoA, alpha-ketoglutarate (αKG), and NAD+/NADH ratio in the indicated HSC populations following targeted metabolomics profiling. Data are means ± S.D.; *p ≤ 0.05. D) Principal component (PC) loadings of mass cytometry (CyTOF) metabolic regulome panel (left) and expression density highlighting the major metabolic pathway over-represented in yHSC, AThi oHSC, and ATlo oHSC (right). Metabolic pathway classification of protein targets in different biological (Biol.) systems is indicated. Glycol., glycolysis; Ferment., fermentation; Mito., mitochondria; AA, amino acid; FA, fatty acid. See also Figures S6
Figure 6.
Figure 6.. Fasting refeeding restores the regenerative capacity of old HSCs.
A) Schematic of fasting and refeeding intervals in young and old Gfp-Lc3 mice (top) with representative FACS plots of GFP-LC3 levels in HSCs in different feeding conditions (middle), and transplantation approach into lethally irradiated (IR) recipients (bottom). B) Quantification of HSC frequency (top) and GFP-LC3 MFI (bottom) in ad libitum (AL), fasted (F) and fast/refed (F/R) states. C) Regenerative capacity of the indicated young and old HSC populations showing engraftment in PB over time (left) as well as lineage distribution (middle) and HSC chimerism (right) at 4 months (mo) post-transplantation (tplx). D) Regenerative capacity of young and old Becn1 knockin (KI) and control (Ctrl) HSCs showing engraftment in PB over time. E) Constitutive autophagy activation in HSCS from rapamycin (Ra) feed vs. Ad Libitum (AL) feed old mice showing engraftment in PB over time. Data are means ± S.D. except for overall engraftment data (C, D, and E, ± S.E.M.); *p ≤ 0.05, **p ≤ 0.01, ***p ≤ 0.001; ns, not significant. See also Figures S7.
Figure 7.
Figure 7.. Fasting refeeding reset the glycolytic capacity of old HSCs.
A) Extracellular acidification rates (ECAR) as measured by Seahorse glycolytic rate assay in the indicated ad libitum (AL), fasted (F) and fast/refed (F/R) young and old HSC populations. Rot+A, rotenone + antimycin; 2DG: 2-deoxy-glucose. B) CyTOF analyses showing differentially expressed metabolic proteins in F/R yHSC vs. F/R oHSC following 21-hour culture in full cytokine media. C) Mouse 13-Plex cytokine bead array measurement in BM fluids of young and old mice from the indicated feeding conditions. D) HSC response to indicated feeding conditions: qRT-PCR quantification of Socs3 mRNA levels (left), normalized Glut1 surface expression (middle), and 2-NBDG uptake (right). E) UMAP of 10X Genomics scRNA-seq analyses of yHSC and oHSC from the indicated feeding conditions with cell cycle annotation. F) GSEA results for Reactome pathway analyses of quiescent stem-like cluster 2 cells (c2 vs. all). The full list of GSEA results per cluster is presented in Table S2. Data are means ± S.D. except for overall engraftment data (C) and Seahorse results (D) (± S.E.M.); *p ≤ 0.05, **p ≤ 0.01, ***p ≤ 0.001; ns, not significant. See also Figures S7.

Update of

References

    1. López-Otín C, Blasco MA, Partridge L, Serrano M, and Kroemer G. (2013). The hallmarks of aging. Cell 153, 1194–1217. - PMC - PubMed
    1. Kasbekar M, Mitchell CA, Proven MA, and Passegué E. (2023). Hematopoietic stem cells through the ages: A lifetime of adaptation to organismal demands. Cell Stem Cell 30, 1403–1420. - PMC - PubMed
    1. Ho YH et al. (2019). Remodeling of bone marrow hematopoietic stem cell niches promotes myeloid cell expansion during premature or physiological aging. Cell Stem Cell 25, 407–418. - PMC - PubMed
    1. Mitchell CA et al. (2023). Stromal niche inflammation mediated by IL-1 signaling is a targetable driver of haematopoietic ageing. Nat Cell Biol 25, 30–41. - PMC - PubMed
    1. Verovskaya EV, Dellorusso PV, Passegué E. (2019). Losing Sense of Self and Surroundings: Hematopoietic Stem Cell Aging and Leukemic Transformation. Trends Mol Med 25:494–515. - PMC - PubMed

Substances

LinkOut - more resources