. 2024 Aug 8;73(9):1489-1508.
doi: 10.1136/gutjnl-2023-330995.

The Peptidoglycan Recognition Protein 1 confers immune evasive properties on pancreatic cancer stem cells

Affiliations

The Peptidoglycan Recognition Protein 1 confers immune evasive properties on pancreatic cancer stem cells

Juan Carlos López-Gil et al. Gut. .

Erratum in

Abstract

Objective: Pancreatic ductal adenocarcinoma (PDAC) has limited therapeutic options, particularly with immune checkpoint inhibitors. Highly chemoresistant 'stem-like' cells, known as cancer stem cells (CSCs), are implicated in PDAC aggressiveness. Thus, comprehending how this subset of cells evades the immune system is crucial for advancing novel therapies.

Design: We used the KPC mouse model (LSL-KrasG12D/+; LSL-Trp53R172H/+; Pdx-1-Cre) and primary tumour cell lines to investigate putative CSC populations. Transcriptomic analyses were conducted to pinpoint new genes involved in immune evasion. Overexpressing and knockout cell lines were established with lentiviral vectors. Subsequent in vitro coculture assays, in vivo mouse and zebrafish tumorigenesis studies, and in silico database approaches were performed.

Results: Using the KPC mouse model, we functionally confirmed a population of cells marked by EpCAM, Sca-1 and CD133 as authentic CSCs and investigated their transcriptional profile. Immune evasion signatures/genes, notably the gene peptidoglycan recognition protein 1 (PGLYRP1), were significantly overexpressed in these CSCs. Modulating PGLYRP1 impacted CSC immune evasion, affecting their resistance to macrophage-mediated and T-cell-mediated killing and their tumourigenesis in immunocompetent mice. Mechanistically, tumour necrosis factor alpha (TNFα)-regulated PGLYRP1 expression interferes with the immune tumour microenvironment (TME) landscape, promoting myeloid cell-derived immunosuppression and activated T-cell death. Importantly, these findings were not only replicated in human models, but clinically, secreted PGLYRP1 levels were significantly elevated in patients with PDAC.

Conclusions: This study establishes PGLYRP1 as a novel CSC-associated marker crucial for immune evasion, particularly against macrophage phagocytosis and T-cell killing, presenting it as a promising target for PDAC immunotherapy.

Keywords: CANCER IMMUNOBIOLOGY; IMMUNE RESPONSE; PANCREATIC CANCER; STEM CELLS.


Conflict of interest statement

Competing interests: None declared.

Figures

Figure 1
Figure 1
Isolation of pancreatic populations with stemness features. (A) Top panel: representative flow cytometry plot showing the gating strategy for isolation of pancreatic cell populations after lineage depletion from an 8-week-old C57Bl/6J mouse. Cells were stained with anti-CD45 and anti-CD31 (lineage cocktail). Bottom panel: lineage depleted cells were stained with anti-EpCAM and anti-Sca-1 resulting into four populations. (B–C) Quantification of organoid forming capacity in Matrigel (B) or spheroid forming efficiency (C) for the different pancreatic cell subsets identified in (A). Shown are mean organoid numbers/10 000 cells±STDEV or mean spheroid numbers/10 000 cells±STDEV (n=4, p values determined by one-way analysis of variance (ANOVA), with Dunnett’s test). (D) Representative confocal images of normal murine pancreatic tissue showing rare cells positive for EpCAM (red), Sca-1 (green) and DAPI (nuclear marker, blue). Arrows indicate EpCAM+Sca-1+ populations. Scale=50 µm. (E) Representative confocal images of EpCAM+Sca-1+ cell-derived spheroids after 10 days of culture. Spheroids were stained with antibodies against pancreatic lineage markers amylase, Hes1, insulin and cytokeratin 19 (CK19) (all in green) and DAPI (nuclear marker, blue). (F–G) Mean spheroid numbers/10 000 cells±STDEV (F) or mean organoids/10 000 cells±STDEV (G) and representative bright field images (bottom) of spheroids or organoids (in Matrigel) generated from sorted EpCAM+Sca-1+CD133+ and EpCAM+Sca-1+CD133 cells after 10 days of culture (n=4, p values as determined by unpaired t-test). (H) Mean spheroid numbers/10 000 cells±STDEV of EpCAM+Sca-1+CD133- and EpCAM+Sca-1+CD133+ cell-derived spheroids across serial passages (top) (n=4, p values determined by unpaired t-test). Representative bright field images (bottom) show EpCAM+Sca-1+CD133+ cell-derived spheroids at each passage. DAPI, 4',6-diamidino-2-phenylindole; EpCAM, epithelial adhesion cell adhesion molecule; Sca-1, stem cell antigen 1; STDEV, standard deviation.
Figure 2
Figure 2
EpCAM+Sca-1+CD133+ cells possess CSC properties and expand during tumour progression. (A) Left panel: representative flow cytometry plot showing Lin- pancreatic cells stained with EpCAM and Sca-1 from 8-week-old control LSL-KrasG12D/+; LSL-Trp53R172H/+ mice (KP) versus LSL-KrasG12D/+; LSL-Trp53R172H/+; Pdx-1-Cre mice (KPC). Right panel: histogram plot showing the mean±SEM percentage of EpCAM+Sca-1+ cells in control KP and KPC animals (n=6, p values determined by unpaired t-test). (B) Left panel: representative flow cytometry plot displaying EpCAM and Sca-1 expression in Lin- cells from a KPC mouse tumour at 16 weeks and corresponding pancreata from a control KP mouse. Right panel: histogram plot showing the mean±SEM percentage of EpCAM+Sca-1+ cells in KP and KPC groups (n=6, p values determined by unpaired t-test). (C) Representative flow cytometry plot showing the expression of CD133 within the EpCAM+Sca-1+ gate in a KP and KPC mouse at 16 weeks. (D) Mean±SEM of the number of spheroids/10 000 cells generated by the indicated populations after 10 days in sphere culture conditions. Cells were sorted from the pancreata of 16-week-old KPC mice (n=4, p values determined by one-way analysis of variance (ANOVA), with Dunnett’s test). (E) Panel detailing the tumorigenic potential (number of tumours formed/number of injections) of the indicated number of EpCAM+Sca-1+ cells injected in the flanks of athymic nude mice. Cells were sorted from KPC tumours and segregated by CD133 expression. Predicted frequency (freq.) of CSCs as a function of the evaluated dilutions are shown (p values determined by χ2 analysis obtained using ELDA software). (F) Panel detailing secondary engraftment potential of EpCAM+Sca-1+CD133+ and EpCAM+Sca-1+CD133- tumour cells isolated from parental tumours generated in (E). Predicted CSC frequencies (freq.) as a function of the evaluated dilutions are shown (no. of injections >5, p values determined by χ2 analysis obtained by ELDA software). (G) Representative confocal images showing triple staining with antibodies against EpCAM (red), Sca-1 (green), CD133 (grey) and DAPI (nuclear marker, blue). Top panel: pancreata from a KPC mouse at 8 weeks where acinar-ductal metaplasia (ADM) can be observed. Bottom panel: tumour (PDAC) from a 16-week-old KPC mouse. Arrowheads indicate the triple-positive population. Scale=80 µm. (H) Left panel: UMAP representing the clusters from the lineage tracing single-cell RNA sequencing (scRNA-seq) dataset from Schlesinger et al. Middle panel: the metaplastic cell cluster is amplified with Epcam+Ly6a+Prom1+ cells highlighted in blue, and the percentage of triple-positive cells is indicated. Right panel: expression of the markers in the metaplastic population. (I) Left panels: UMAP corresponding to the different states of early tumorigenesis included in this dataset. Middle panels: amplification of the different states in early tumour evolution. Triple-positive cells are highlighted in blue. Right panels: violin plots showing the levels of expression of the indicated genes in the populations displayed. (J) Histogram representing the percentage of early metaplastic, late metaplastic and tumour cells expressing the three markers from the total in each population. CSC, cancer stem cell; ELDA, extreme limiting dilution assay; EpCAM, epithelial adhesion cell adhesion molecule; Ly6a, lymphocyte antigen 6A; PDAC, pancreatic ductal adenocarcinoma; Prom1, prominin-1; Sca-1, stem cell antigen 1; STDEV, standard deviation; UMAP, Uniform Manifold Approximation and Projection.
Figure 3
Figure 3
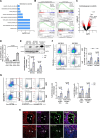
Transcriptomic analysis of triple-positive CSCs and validation of PGLYRP1 as a CSC marker. (A) Gene sets enriched in the transcriptional profile of the EpCAM+Sca-1+CD133+ population (CSCs) versus the rest of populations (non-CSC), showing an enrichment in stem cell signatures. Shown are the -log(FDR q-val) values for each pathway using the indicated published gene signatures, nominal p<0.05, FDR <15% (n=3 biological replicates). (B) GSEA plots showing enrichment of indicated signatures in the EpCAM+Sca-1+CD133+ population (CSC) versus all other tumour cells (non-CSC). (C) Volcano plot showing the significantly enriched genes (in red) in EpCAM+Sca-1+CD133+ CSCs versus all other tumour cells (n=3 biological replicates). (D) Quantification of PGLYRP1+ cells in the indicated populations in KPC PDAC tumours detected by flow cytometry, represented as percentage±SEM (n=7, p values determined by one-way ANOVA with Dunnett’s test). (E) Top panel: representative western blot of PGLYRP1 levels from protein extracts derived from adherent (ADH) and spheroid (SPH) cultures. GAPDH was used as an internal loading control. Bottom panel: mean fold change of PGLYRP1/GAPDH densitometric ratios±STDEV, with ADH set as 1.0 (n=3, p values determined by unpaired t-test). (F) Left panel: representative flow cytometry plots showing the percentage of PGLYRP1-FITC expressing cells in both cell lines cultured as ADH and SPH. Right panel: quantification represented as the mean fold change±SEM, with ADH set as 1.0 (n=6, p values determined by unpaired t-test). (G) Left panel: representative flow cytometry plots showing the expansion of the EpCAM+Sca-1+CD133+ CSC and triple-positive PGLYRP1+ compartments in KPC cell lines cultured as ADH and SPH. Right panels: frequency of triple-positive and PGLYRP1+ triple-positive cells in the indicated cell cultures. Data are represented as the mean fold change in the percentage of the indicated populations±SEM, with ADH set as 1.0 (n=6, p values determined by unpaired t-test). (H) Representative confocal images showing CSC marker expressing cells. EpCAM or Sca-1 (red), CD133 (pink), PGLYRP1 (green) and DAPI (nuclear marker, blue). Arrowheads indicate the CSC population. ANOVA, analysis of variance; CSCs, cancer stem cells; EpCAM, epithelial adhesion cell adhesion molecule; FDR, false discovery rate; FITC, fluorescein isothiocyanate; GAPDH, glyceraldehyde-3-phosphate dehydrogenase; GSEA, gene set enrichment analysis; PDAC, pancreatic ductal adenocarcinoma; PGLYRP1, peptidoglycan recognition protein 1; Sca-1, stem cell antigen 1; STDEV, standard deviation.
Figure 4
Figure 4
PGLYRP1 expression during tumour evolution. Representative H&E-stained images and confocal microscopy images of PanCK (pink), PGLYRP1 (green), EpCAM (red) and DAPI (nuclear marker, blue) in (A) a mouse healthy pancreata, (B) pancreatic tissue following cerulein-induced pancreatitis, (C) in the pancreas of a 10-week, 24-week and 35-week-old KPC mice and (D) in a lung metastasis (PGLYRP1 colocalises with EpCAM+PanCK+ lesions; PGLYRP1 staining can also be found in surrounding immune cells). For all images, brightness and contrast were adjusted with ImageJ. Scale bar=60 µm (H&E images) and scale bar=100 µm (fluorescence images). (E) Quantification of PGLYRP1 expression, comparing the mean grey value of the PGLYRP1 staining signal, shown as the mean fold change±STDEV, with healthy pancreas set as 1.0 (n=3, p values determined by one-way ANOVA with post hoc Tukey test). (F) Left panels: UMAPs showing Pglyrp1 expression in the Schlesinger et al dataset in early metaplastic (EM), late metaplastic (LM) and tumour cell (T) states. Right panel: histogram representing the percentage of Pglyrp1 expressing cells for each state. (G) Left panels: UMAPs showing Pglyrp1 expression in the triple-positive population in the Schlesinger et al dataset in early metaplastic (EM), late metaplastic (LM) and tumour cell (T) states. Right panel: histogram representing the percentage of Pglyrp1 expressing cells in triple-positive cell population for each state. ANOVA, analysis of variance; CSCs, cancer stem cells; DAPI, 4',6-diamidino-2-phenylindole; EpCAM, epithelial adhesion cell adhesion molecule; PanCK, pan-cytokeratin; PGLYRP1, peptidoglycan recognition protein 1; STDEV, standard deviation.
Figure 5
Figure 5
Tumorigenic and metastatic potential of PGLYRP1 knockout and overexpression models. (A) Left panel: representative western blot of intracellular PGLYRP1 levels in protein lysates from wild-type (WT) and CRISPR knockout (KO) KPC ID11 and ID95 cell lines. GAPDH was used as an internal loading control. Right panel: mean fold change of the PGLYRP1/GAPDH densitometric ratios±STDEV, with each WT set as 1.0 (n=3, p values determined by unpaired t-test). (B) Left panel: representative flow cytometry plots of PGLYRP1 expression in both WT and KO cell lines. Right panel: mean fold change in PGLYRP1 expressing cells±SEM, with WT set as 1.0 (n=5, p values determined by unpaired t-test). (C) Left panel: images of tumours obtained from a subcutaneous extreme limiting dilution assay (ELDA). Shown are tumours extracted from immunocompetent C57Bl/6J mice 3 weeks postinjection of 100 000 WT, PGLYRP1 overexpressing (OE) or KO cells derived from the ID11 cell line. Right panel: mean tumour weights (mg)±SEM (no. of injections=8, p values determined by one-way ANOVA with post hoc Tukey test). (D) Growth curves indicating the mean tumour volume (mm3)±SEM over 20 days following injection of 100 000, 10 000 or 1000 ID11 wild-type (WT), PGLYRP1 OE or KO cells. The slopes for each group were compared using the ‘comparing slopes tool’ (GraphPad v8), and the p value presented was calculated by comparing all slopes. P values to compare between groups were calculated by two-way ANOVA. (E) Panels detailing the tumorigenic potential of the indicated numbers of injected ID11 and ID95 WT, PGLYRP1 OE or KO cells in immunocompetent C57Bl/6J mice. Each column shows the number of tumours formed/number of injections. (F) Proliferation (no. cells) of KPC ID11 and ID95 WT and PGLYRP1 KO at 24, 48 and 72 hours (h) after seeding, represented as the mean fold change±STDEV with WT 24 hours set as 1.0 (n=3, per condition and time, p values determined by unpaired t-test). (G) Images of tumours at the time of sacrifice from orthotopic injection of 104 ID11 or ID95 WT or OE cells in immunocompetent C57Bl/6J mice. KO cells did not succeed in forming tumours. (H) Mean pancreata weight (mg)±SEM (n=6, p values determined by one-way ANOVA with post hoc Tukey test). (I) Representative H&E-stained sections of orthotopic tumours and pancreata from (G). Scale=60 µm. (J) Mean fold change in the percentage of mCherry+ tumour cells in digested livers±STDEV, with WT set as 1.0, as detected by flow cytometry (n=4 for ID11 and n=6 for ID95, p values determined by unpaired t-test). (K) Left panel: images of the lungs at the time of sacrifice from intravenous injection of 106 KPC WT, PGLYRP1 OE or KO cells in immunocompetent C57Bl/6J mice. Right panel: Mean lung weight (mg)±SEM (n=5, p values as determined by one-way ANOVA with post hoc Tukey test). (L) Representative H&E-stained sections of lung metastases from (K). Left images: zoom 10× (scale=1000 µm or 200 µm). Right images: zoom 40× (scale=80 µm). ANOVA, analysis of variance; GAPDH, glyceraldehyde-3-phosphate dehydrogenase; PGLYRP1, peptidoglycan recognition protein 1; STDEV, standard deviation.
Figure 6
Figure 6
PGLYRP1 promotes immune evasion and alters immune infiltration. (A) Representative flow cytometry plots of PD-L1 and CD86 expression in PGLYRP1- or PGLYRP1+ populations. (B) Violin plots representing the quantification of the mean percentage of PD-L1+ and CD86+ cells in the PGLYRP1- or PGLYRP1+ populations for the ID11 cell line (left) and the ID95 cell line (right) determined by flow cytometry (n=9, p values determined by unpaired t-test). (C) Quantification of MΦ-phagocytosed cells (ID11, left; ID95, right), determined by flow cytometry as double-positive (mCherry/BFP+ and CD11b+) live cells, represented as mean fold change±SEM, with WT set as 1.0 (n=14 for ID11 and n=6 for ID95, p values determined by one-way ANOVA with post hoc Tukey test). Bone marrow-derived primary MΦs were obtained from three different donor mice. (D) Quantification of MΦ-phagocytosed PGLYRP1 WT cells (Ctrl) without or with anti-PGLYRP1 (αPGLYRP1) treatment (0.5 µg/mL; 24 hours), determined by flow cytometry as double-positive (EpCAM+ and CD11b+) live cells, represented as mean fold change±SEM, with Ctrl set as 1.0 (n=19, p values determined by unpaired t-test). (E) Quantification of dead cells (TO-PRO-3+) in the tumour population (mCherry+/BFP+) for ID11 (left) and ID95 (right) cells, determined by flow cytometry and represented as mean fold change±SEM, with WT set as 1.0 (n=12 for ID11 and n=6 for ID95, p values determined by one-way ANOVA with post hoc Tukey test). T cells were obtained from lymph nodes and spleen of three different donor mice. (F) Percentage of the different indicated immune cell populations in the TME from WT or OE tumours, determined by flow cytometry and represented as box plots (n=3 mice per condition and cell line, p values determined by unpaired t-test). (G) Percentage of the different indicated immune cell populations in the pancreata microenvironment from control or KO-cell-injected pancreata, determined by flow cytometry and represented as box plots (n=3 mice per condition, p values as determined by unpaired t-test). (H) Left panel: representative images of PGLYRP1low and PGLYRP1high tumour areas from spontaneous KPC tumours obtained by 3D quantitative confocal microscopy. Top images show a conventional IF staining, while bottom images show a postprocessed image where neutrophils (light blue) and macrophages (burgundy) are annotated through Imaris spots function for quantification. Right panels: number of indicated immune cells±SEM (neutrophils or macrophages) per µm3 in both tumour areas based on PGLYRP1 expression (low or high) (n=9 tumours for neutrophils and n=3 tumours for macrophages, p values determined by unpaired t-test). ANOVA, analysis of variance; EpCAM, epithelial adhesion cell adhesion molecule; IF, immunofluorescence; KO, knockout; MΦ, macrophage; OE, overexpressing; PD-L1, programmed cell death ligand 1; PGLYRP1, peptidoglycan recognition protein 1; TME, tumour microenvironment; WT, wild type.
Figure 7
Figure 7
TNFα induces PGLYRP1 expression, protecting CSCs from immune clearance. (A) GSEA plot representing enrichment of the TNF-TNFR signalling pathway from transcriptomic data generated from tumour-isolated triple-positive CSCs versus non-CSCs. (B) RT-qPCR analysis of Tnf mRNA expression in KPC cells in adherent monolayer (ADH) or spheroid (SPH) culture conditions. Shown is the mean fold change±SEM, with ADH set as 1.0 (n=4 for ADH and n=5 for SPH, p values determined by unpaired t-test). (C) RT-qPCR analysis of Tnfrsf1a mRNA expression in KPC ADH or SPH cultures. Shown is the mean fold change±SEM, with ADH set as 1.0 (n=3, p values determined by unpaired t-test). (D) Box plots representing the mean levels of soluble TNFα (pg/ml) as determined by ELISA comparing KPC ADH versus SPH cell conditioned medium (n=6, p values determined by unpaired t-test). (E) Quantification of flow cytometric analyses of TNFR1+ KPC cells grown in ADH or SPH conditions. Shown is the mean fold change±SEM, with ADH set as 1.0 (n=7, p values determined by unpaired t-test). (F) Correlation dot plot of TNF and PGLYRP1 expression in the TCGA database. P value and r were calculated employing Pearson’s correlation. (G) RT-qPCR analysis of Pglyrp1 mRNA expression in KPC cells after recombinant (r)TNFα stimulation (20 ng/mL) for 6 hours. Shown is the mean fold change±SEM, with Ctrl set as 1.0 (n=6 for controls and n=12 for TNFα treated, p values determined by unpaired t-test). (H) Quantification by flow cytometry of PGLYRP1+ cells after treatment with rTNFα (20 ng/mL, 6 hours). Shown is the mean fold change±SEM, with Ctrl set as 1.0 (n=6 for control and n=12 for rTNFα treated, p values determined by unpaired t-test). (I) Quantification by flow cytometry of PGLYRP1+ triple-positive CSCs after treatment with rTNFα (20 ng/mL; 6 hours) and rTNFα + rPGLYRP1 (20 ng/mL+1 µg/mL; 6 hours). Shown is the mean fold change±STDEV, with Ctrl set as 1.0 (n=3 for controls and n=4 for treated group, p values determined by one-way ANOVA with post hoc Tukey test). (J) Quantification by flow cytometry of PGLYRP1+ non-CSCs after treatment with rTNFα (20 ng/mL; 6 hours) and rTNFα + rPGLYRP1 (20 ng/mL+1 µg/mL; 6 hours). Shown is the mean fold change±STDEV, with Ctrl set as 1.0 (n=3 for controls and n=4 for treated group, p values determined by one-way ANOVA with Dunnett’s test). (K) Quantification of dead cells (TO-PRO-3+) after 6 hours of TNFα (20 ng/mL) treatment of KPC WT, PGLYRP1 OE or KO cultures, determined by flow cytometry. Data are represented as the mean fold change±SEM, with WT set as 1.0 (n=5, p values determined by one-way ANOVA). (L) Quantification of MΦ-phagocytosed PGLYRP1 KO cells without or with infliximab (IFX) treatment (10 µg/mL; 24 hours), determined by flow cytometry as double-positive (BFP+ and CD11b+) live cells, represented as mean fold change±SEM, with KO set as 1.0 (n=12 for KO and n=14 for KO+IFX, p values determined by unpaired t-test). (M) Quantification of MΦ-phagocytosed PGLYRP1 KO cells without or with rPGLYRP1 treatment (1 µg/mL; 24 hours), determined by flow cytometry as double-positive (BFP+ and CD11b+) live cells, represented as mean fold change±SEM, with KO set as 1.0 (n=19, p values determined by unpaired t-test). (N) Quantification of MΦ-induced cell death in WT and PGLYRP1 KO cells, determined by flow cytometry as EpCAM+ or BFP+ dead cells, in basal conditions or KO cells treated with rPGLYRP1, infliximab (IFX) or WT cells treated with anti-PGLYRP1 antibody (αPGLYRP1) represented as percentage±SEM (n=20 for WT and KO, 9 for KO+rPGLYRP1 and IFX, and 7 for WT+ αPGLYRP1, p values determined by unpaired t-test). ANOVA, analysis of variance; CSCs, cancer stem cells; GSEA, gene set enrichment analysis; KO, knockout; MΦ, macrophage; rPGLYRP1, recombinant peptidoglycan recognition protein 1; RT-qPCR, reverse-transcription quantitative PCR; STDEV, standard deviation; TCGA, the cancer genome atlas; TNFα, tumour necrosis factor alpha; TNFR, tumour necrosis factor receptor; WT, wild type.
Figure 8
Figure 8
PGLYRP1 in human PDAC CSCs. (A) Mean fold change±SEM of PGLYRP1 expression in freshly sorted EPCAM+ cells from human tumours (tumour) or healthy adjacent pancreatic tissue (healthy tissue), determined by RNA-seq (Espinet et al dataset40) and with healthy tissue set as 1.0 (n=14 for healthy tissue and n=62 for tumours, p values determined by unpaired t-test). (B) Left panel: UMAP of the different cell clusters present in the Hwang et al scRNA-seq dataset of human PDAC. Right panel: UMAP of PGLYRP1 expressing cells in the different clusters. (C) Representation of PGLYRP1 expressing events in each cluster. (D) Left panel: volcano plot showing the significantly enriched genes (in red) in tumour PGLYRP1 expressing versus PGLYRP1 non-expressing cells. Genes related to stemness, tumour aggressiveness and chemoresistance are labelled and coloured in green (significant genes, FC >0.25 and p<0.05). Right panel: PGLYRP1 expression in tumour cells according to PROM1 expression. (E) Mean fold change±STDEV of PGLYRP1 mRNA expression in two PDX-derived primary human PDAC cell lines (PANC185 and PANC354) cultured as adherent monolayers (ADH) or spheroids (SPH), determined by RT-qPCR and with ADH set as 1.0 (n=3, p values determined by unpaired t-test). (F) Left panel: representative flow cytometry plots of the percentage of PGLYRP1+ cells in ADH or SPH cultures. Right panel: quantification of the mean fold change±SEM of PGLYRP1+ cells in ADH or SPH cultures, with ADH set as 1.0 (n=3, p values as determined by unpaired t-test). (G) Representative confocal images of human PDAC tumour stained with CD133 (red), PGLYRP1 (green) and DAPI (blue). Arrowheads indicate double-positive cells. Scale=100 µm. (H) Left panel: representative flow cytometry plots of the percent of CXCR4+CD133+ CSCs (top) or CXCR4+CD133+PGLYRP1+ (bottom) cells in human PDAC cells grown as ADH or SPH cultures. Right panels: quantification of the indicated populations in PANC185 and PANC354 cultures. Data shown as the mean fold change±SEM, with ADH set as 1.0 (n=3, p values determined by unpaired t-test). (I) Violin plots representing the mean percentage of PDL1+ or CD86+ cells in the PGLYRP1- or PGLYRP1+ populations in PANC185 cells (n=6 for all groups, p values determined by unpaired t-test). (J) Mean fold change±SEM of MΦ-phagocytosed cells determined by flow cytometry as double-positive (mCherry+/BFP+ and CD45+) live events for both PANC185 and PANC354, with WT set as 1.0 (n=8, p values determined by one-way ANOVA). Primary MΦs were obtained from five different healthy donors. (K) Mean fold change±SEM of dead cells (TO-PRO-3+) in the tumour population (mCherry+/BFP+) for both PANC185 and PANC354, determined by flow cytometry and represented with WT set as 1.0 (n=9, p values determined by one-way ANOVA with post hoc Tukey test). T cells were obtained from five different healthy donors. (L) Correlation dot plot of PTPRC (CD45), ITGAM (CD11b), MPO, ARG1 and PGLYRP1 expression in the TCGA database. P value and R were calculated employing Pearson’s correlation. (M) Violin plots representing the mean levels of soluble PGLYRP1 (pg/ml) as determined by ELISA comparing non-PDAC controls (n=58) with patients having PDAC (n=87) (p values determined by unpaired t-test). (N) Overall survival (OS) probability curve of patients with stage 1 PDAC from seven publicly available datasets analysed via OSpaad online software. At stage 1, the upper tercile of patients according to PGLYRP1 expression has poorer OS than the lower tercile. P-values determined by log-rank test. ANOVA, analysis of variance; ARG1, arginase1; CSCs, cancer stem cells; EpCAM, epithelial adhesion cell adhesion molecule; ITGAM, integrin subunit alpha M; MΦ, macrophage; MPO, heme protein myeloperoxidase; PDAC, pancreatic ductal adenocarcinoma; PDX, patient-derived xenograft; PGLYRP1, peptidoglycan recognition protein 1; PTPRC, protein tyrosine phosphatase receptor type-C; RT-qPCR, reverse-transcription quantitative PCR; scRNA-seq, single-cell RNA sequence; STDEV, standard deviation; TCGA, the cancer genome atlas; UMAP, Uniform Manifold Approximation and Projection; WT, wild type.

References

    1. Christenson ES, Jaffee E, Azad NS. Current and emerging therapies for patients with advanced pancreatic ductal adenocarcinoma: a bright future. Lancet Oncol 2020;21:e135–45. 10.1016/S1470-2045(19)30795-8 - DOI - PMC - PubMed
    1. Cancer.net . Pancreatic cancer: statistics. ASCO; 2022. Available: https://www.cancer.net/cancer-types/pancreatic-cancer/statistics#:~:text...
    1. Li C, Heidt DG, Dalerba P, et al. . Identification of pancreatic cancer stem cells. Cancer Res 2007;67:1030–7. 10.1158/0008-5472.CAN-06-2030 - DOI - PubMed
    1. Hermann PC, Huber SL, Herrler T, et al. . Distinct populations of cancer stem cells determine tumor growth and metastatic activity in human pancreatic cancer. Cell Stem Cell 2007;1:313–23. 10.1016/j.stem.2007.06.002 - DOI - PubMed
    1. Yin W, Xiang D, Wang T, et al. . The inhibition of ABCB1/MDR1 or ABCG2/BCRP enables doxorubicin to eliminate liver cancer stem cells. Sci Rep 2021;11:10791. 10.1038/s41598-021-89931-9 - DOI - PMC - PubMed

MeSH terms

Substances

LinkOut - more resources