

Granzyme B PET Imaging for Assessment of Disease Activity in Inflammatory Bowel Disease
- PMID: 38754959
- PMCID: PMC11218731
- DOI: 10.2967/jnumed.123.267344
Granzyme B PET Imaging for Assessment of Disease Activity in Inflammatory Bowel Disease
Abstract
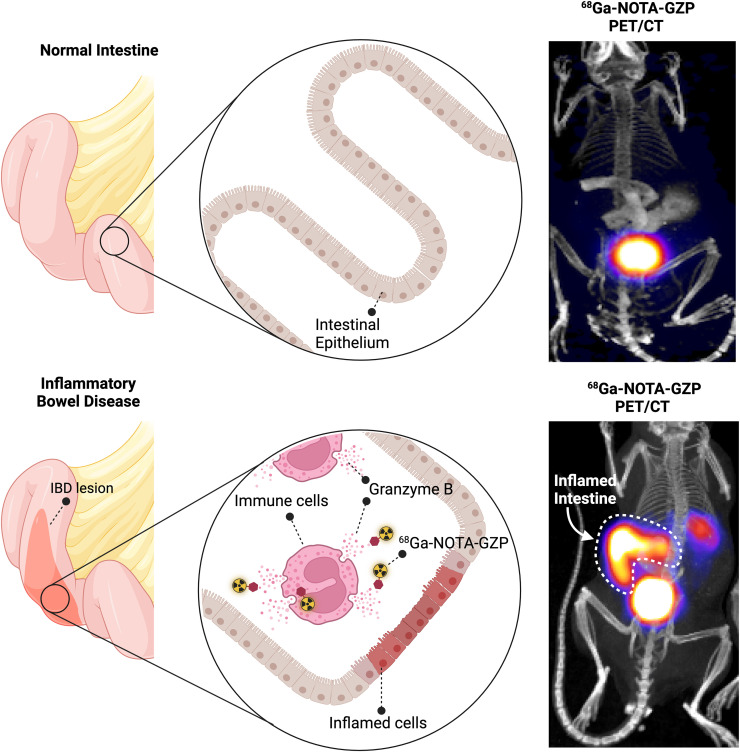
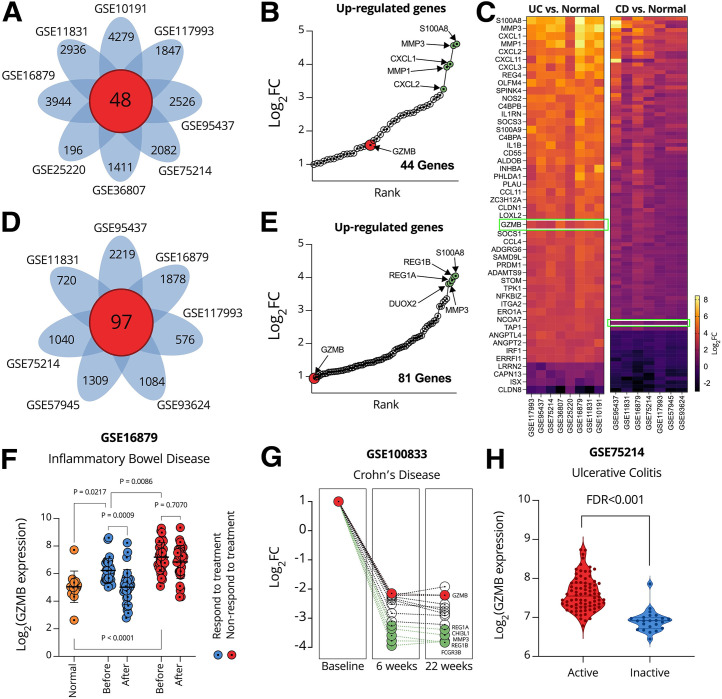
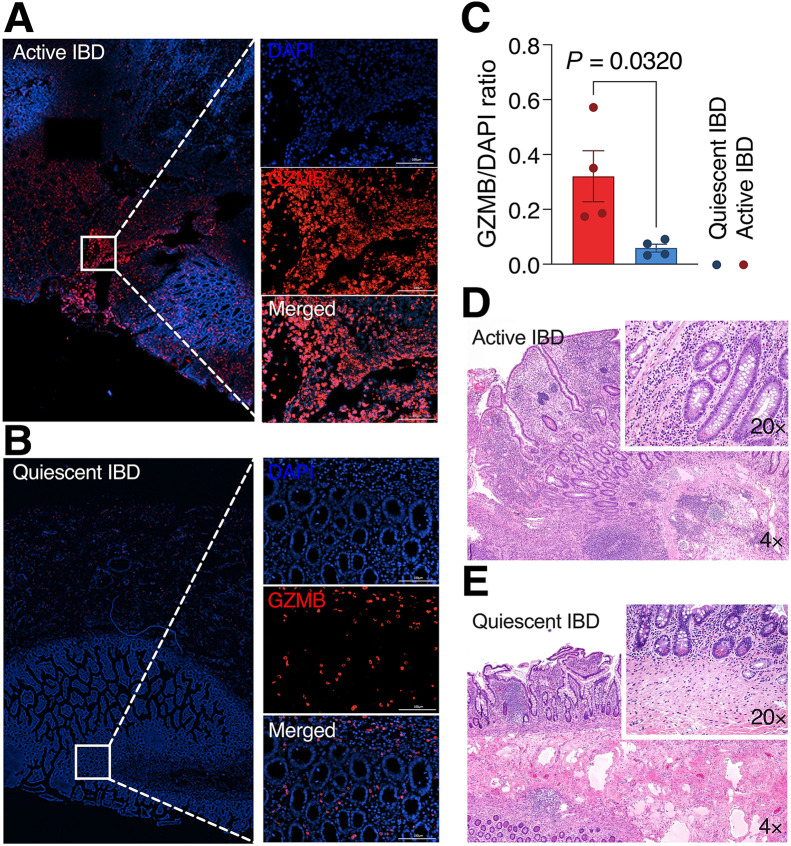
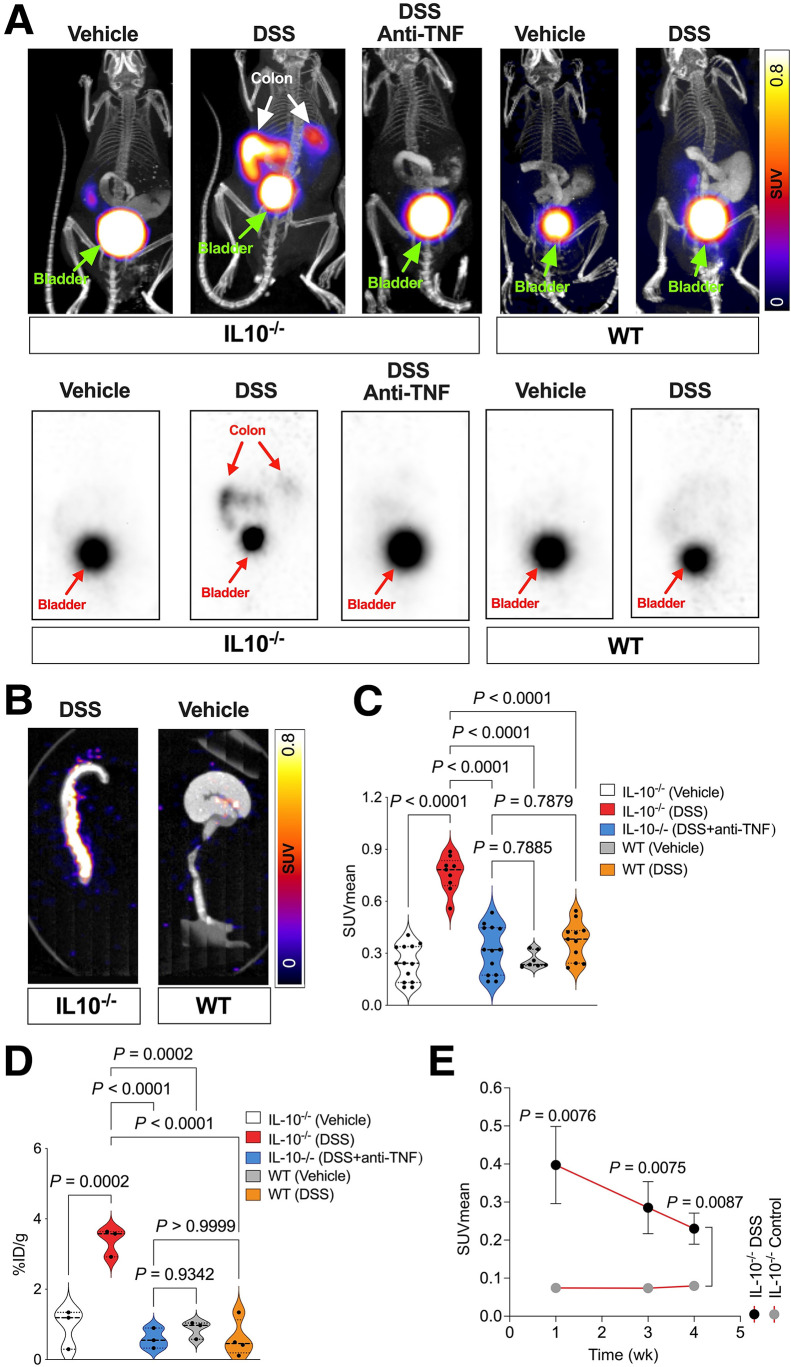
Developing a noninvasive imaging method to detect immune system activation with a high temporal resolution is key to improving inflammatory bowel disease (IBD) management. In this study, granzyme B (GZMB), typically released from cytotoxic T and natural killer cells, was targeted using PET with 68Ga-NOTA-GZP (where GZP is β-Ala-Gly-Gly-Ile-Glu-Phe-Asp-CHO) to detect early intestinal inflammation in murine models of colitis. Methods: Bioinformatic analysis was used to assess the potential of GZMB as a biomarker for detecting IBD and predicting response to treatment. Human active and quiescent Crohn disease and ulcerative colitis tissues were stained for GZMB. We used IL-10-/- mice treated with dextran sulfate sodium (DSS) as an IBD model, wild-type C57BL/6J mice as a control, and anti-tumor necrosis factor as therapy. We used a murine GZMB-binding peptide conjugated to a NOTA chelator (NOTA-GZP) labeled with 68Ga as the PET tracer. PET imaging was conducted at 1, 3, and 4 wk after colitis induction to evaluate temporal changes. Results: Bioinformatic analysis showed that GZMB gene expression is significantly upregulated in human ulcerative colitis and Crohn disease compared with the noninflamed bowel by 2.98-fold and 1.92-fold, respectively; its expression is lower by 2.16-fold in treatment responders than in nonresponders. Immunofluorescence staining of human tissues demonstrated a significantly higher GZMB in patients with active than with quiescent IBD (P = 0.032).68Ga-NOTA-GZP PET imaging showed significantly increased bowel uptake in IL-10-/- mice with DSS-induced colitis compared with vehicle-treated IL-10-/- mice (SUVmean, 0.75 vs. 0.24; P < 0.001) and both vehicle- and DSS-treated wild-type mice (SUVmean, 0.26 and 0.37; P < 0.001). In the IL-10-/- DSS-induced colitis model, the bowel PET probe uptake decreased in response to treatment with tumor necrosis factor-α (SUVmean, 0.32; P < 0.001). There was a 4-fold increase in colonic uptake of 68Ga-NOTA-GZP in the colitis model compared with the control 1 wk after colitis induction. The uptake gradually decreased to approximately 2-fold by 4 wk after IBD induction; however, the inflamed bowel uptake remained significantly higher than control at all time points (week 4 SUVmean, 0.23 vs. 0.08; P = 0.001). Conclusion: GZMB is a promising biomarker to detect active IBD and predict response to treatment. This study provides compelling evidence to translate GZMB PET for imaging IBD activity in clinical settings.
Keywords: 68Ga-NOTA-GZP; PET imaging; colitis; granzyme B; inflammatory bowel disease.
© 2024 by the Society of Nuclear Medicine and Molecular Imaging.
Figures
References
-
- Laass MW, Roggenbuck D, Conrad K. Diagnosis and classification of Crohn’s disease. Autoimmun Rev. 2014;13:467–471. - PubMed
-
- Conrad K, Roggenbuck D, Laass MW. Diagnosis and classification of ulcerative colitis. Autoimmun Rev. 2014;13:463–466. - PubMed
-
- Lightner AL, Moncrief SB, Smyrk TC, et al. Long-standing Crohn’s disease and its implication on anal squamous cell cancer management. Int J Colorectal Dis. 2017;32:661–666. - PubMed
-
- Kraus S, Arber N. Inflammation and colorectal cancer. Curr Opin Pharmacol. 2009;9:405–410. - PubMed
MeSH terms
Substances
Grants and funding
LinkOut - more resources
Full Text Sources