. 2024 May 16;15(1):4161.
doi: 10.1038/s41467-024-48448-1.

Mycobacterial biotin synthases require an auxiliary protein to convert dethiobiotin into biotin

Affiliations

Mycobacterial biotin synthases require an auxiliary protein to convert dethiobiotin into biotin

Di Qu et al. Nat Commun. .

Abstract

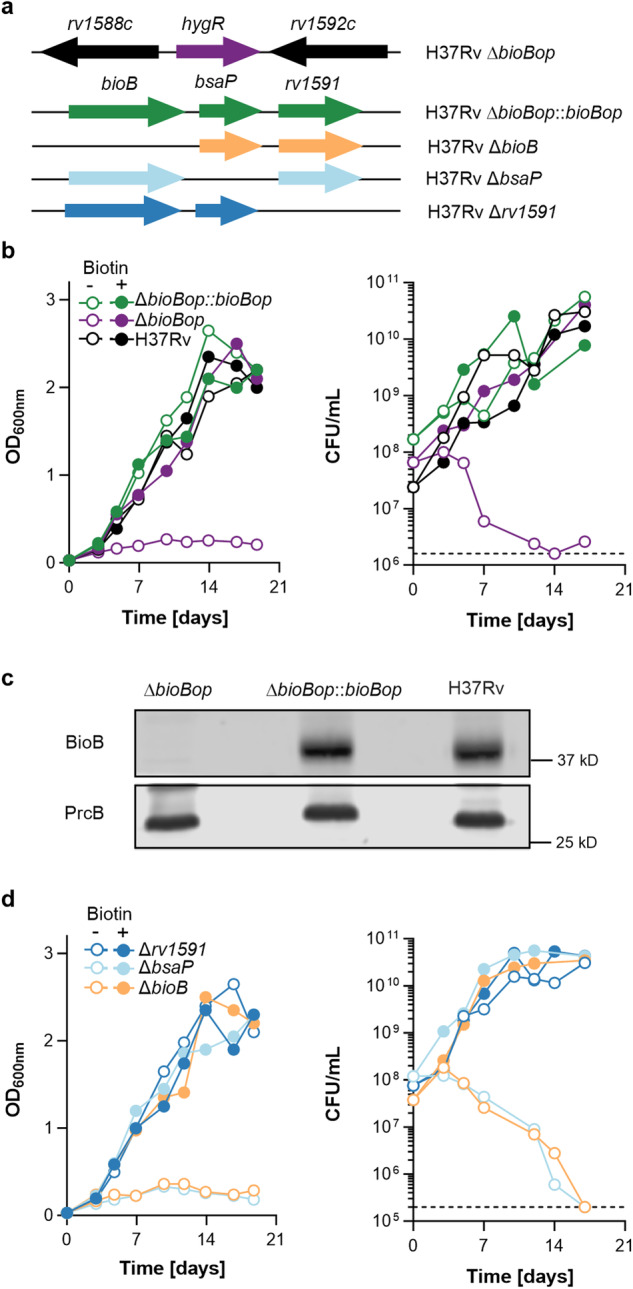
Lipid biosynthesis in the pathogen Mycobacterium tuberculosis depends on biotin for posttranslational modification of key enzymes. However, the mycobacterial biotin synthetic pathway is not fully understood. Here, we show that rv1590, a gene of previously unknown function, is required by M. tuberculosis to synthesize biotin. Chemical-generic interaction experiments mapped the function of rv1590 to the conversion of dethiobiotin to biotin, which is catalyzed by biotin synthases (BioB). Biochemical studies confirmed that in contrast to BioB of Escherichia coli, BioB of M. tuberculosis requires Rv1590 (which we named "biotin synthase auxiliary protein" or BsaP), for activity. We found homologs of bsaP associated with bioB in many actinobacterial genomes, and confirmed that BioB of Mycobacterium smegmatis also requires BsaP. Structural comparisons of BsaP-associated biotin synthases with BsaP-independent biotin synthases suggest that the need for BsaP is determined by the [2Fe-2S] cluster that inserts sulfur into dethiobiotin. Our findings open new opportunities to seek BioB inhibitors to treat infections with M. tuberculosis and other pathogens.


Conflict of interest statement

The authors declare no competing interests.

Figures

Fig. 1
Fig. 1. BsaP is required by M. tuberculosis to grow without extrabacterial biotin.
a Mutant genotype. The first line displays the insertion of the hygromycin resistance marker (hygR) in ΔbioBop. The lines below specify the genes introduced by the transformation of ΔbioBop to generate single-gene deletion mutants. b, d Growth in modified 7H9 medium with (filled symbols) and without biotin (open symbols) as assessed by optical density measurements (left panels) and CFU enumerations (right panels). The dotted lines in the right panels of b, d specify the lower limit of detection. c Immunoblots for BioB and PrcB (loading control). The entire blot is shown in supplementary Fig. 11a. c Results represent at least three independent experiments. b, d Source data are provided as a Source data file.
Fig. 2
Fig. 2. Chemical complementation of M. smegmatis biotin auxotrophs.
a Biotin synthesis pathway. KAPA, DAPA, and DTB stand for 8-amino-7-oxononanoate, 7,8-diaminononanoate, and dethiobiotin, respectively. b Growth of M. smegmatis ΔbioF, ΔbioA, ΔbioD, ΔbioB, and ΔbsaP in modified biotin-free 7H9 medium with or without supplementation with KAPA, DAPA, DTB, or biotin. b Source data are provided as a Source data file.
Fig. 3
Fig. 3. Impact of bsaP on growth of bioB mutants and BioB expression.
a Immunoblots for expression of BioB and PrcB (loading control) in M. tuberculosis and M. smegmatis. The entire blot is shown in Supplementary Fig. 11b. b, c Growth of M. smegmatis ΔbioBop (b) and E. coli ΔbioB (c) with and without extrabacterial biotin. d Immunoblots for expression of BioB and GAPDH (loading control) in E. coli. The entire blot is shown in Supplementary Fig. 11c. a, d Results represent at least three independent experiments. b, c Source data are provided as a Source data file.
Fig. 4
Fig. 4. Biochemical characterization.
a BsaP is essential for the biotin synthesis catalyzed by BioB.tb, but not BioB.ec. b Progress curve of biotin synthesis catalyzed by BioB.tb (5 µM) with and without Bsap (5 µM). c Saturation curve of v0 vs [DTB]. The assay was performed under initial velocity conditions with a fixed saturating concentration of SAM (100 µM) while varying [DTB]. The KM and kcat values were measured by fitting the v0 vs [DTB] to Eq. 1. d Saturation curve of BioB.tb + BsaP showing the effect of increasing BsaP concentration on the overall rate of turnover. The KD of BioB.tb and BsaP interaction was measured by fitting the v0 vs [BsaP] to Eq. 2. ad n = 3. Two-sided unpaired t test; ****p = 1.3537E-07, p = 0.2520 (ns); ns p > 0.05, *p < 0.05, **p < 0.01, ***p < 0.001 (a). Error bars, mean ± SD. Source data are provided as a Source data file.
Fig. 5
Fig. 5. BsaP structure prediction, Fe–S cluster formation, and phylogenetic analyses.
a Comparison of the crystal structure of a [3Fe–4S] + ferredoxin (4ID8, left) with the AF prediction for BsaP.tb (right). Impact on Fe–S cluster reconstitution on the UV-spectra of BioB.tb and BsaP.tb. The dashed lines represent 420 nm and 452 nm, respectively (b) and the enzymatic activity of BioB.tb (c). #Indicates Fe–S cluster reconstitution with Fe (II/III) ammonium sulfate and Na2S. [BioB + BasP]* was reconstituted as a mixture of both proteins. d Consensus maximum log-likelihood phylogenetic tree of BsaP homologs. To the right of the tree, a CDS multiple sequence alignment for the BsaP homologs is shown, where aligned portions are drawn in gray, and alignment gaps are depicted by a line. The BsaP consensus sequence is shown for the region containing the conserved cysteine residues (Cys44, Cys47, and Cys64 of BsaP.tb), which are highlighted in orange. c n = 3. Two-sided unpaired t test; ***p = 0.0004, **p = 0.0141; ns p > 0.05, *p < 0.05, **p < 0.01, ***p < 0.001. Error bars, mean ± SD. b, c Source data are provided as a Source data file.
Fig. 6
Fig. 6. Structural analyses.
Comparisons of the amino acids forming the [4Fe–4S]+ (a) and [2Fe–2S]+ (b) clusters of BioB.ec (1R30, protein carbons are shown in tan carbons, SAM carbons are shown in teal), and BioB.tb (AF prediction, gray carbons). c Alignment of the AF predictions for BsaP.tb (colored by AF confidence score) and AF predicted structure of BioB from Pseudonocardia (light gray) with an overlay of Fe–S clusters and substrates from the BioB.ec crystal structure (tan). d Electrostatic surface analyses of the AF predictions for BioB.tb (left) and BsaP.tb (right).

References

    1. Global Tuberculosis Report 2021. Licence: CC BY-NC-SA 3.0 IGO (World Health Organization, 2021).
    1. Butler MS, et al. Analysis of the clinical pipeline of treatments for drug-resistant bacterial infections: despite progress, more action is needed. Antimicrob. Agents Chemother. 2022;66:e0199121. doi: 10.1128/aac.01991-21. - DOI - PMC - PubMed
    1. Conradie F, et al. Treatment of highly drug-resistant pulmonary tuberculosis. N. Engl. J. Med. 2020;382:893–902. doi: 10.1056/NEJMoa1901814. - DOI - PMC - PubMed
    1. Aldridge BB, et al. The tuberculosis drug accelerator at year 10: What have we learned? Nat. Med. 2021;27:1333–1337. doi: 10.1038/s41591-021-01442-2. - DOI - PMC - PubMed
    1. Hogan AB, et al. Potential impact of the COVID-19 pandemic on HIV, tuberculosis, and malaria in low-income and middle-income countries: a modelling study. Lancet Glob. Health. 2020;8:e1132–e1141. doi: 10.1016/S2214-109X(20)30288-6. - DOI - PMC - PubMed

MeSH terms

LinkOut - more resources