. 2024 May 16;15(1):4156.
doi: 10.1038/s41467-024-48333-x.

The nucleic acid binding protein SFPQ represses EBV lytic reactivation by promoting histone H1 expression

Affiliations

The nucleic acid binding protein SFPQ represses EBV lytic reactivation by promoting histone H1 expression

Laura A Murray-Nerger et al. Nat Commun. .

Abstract

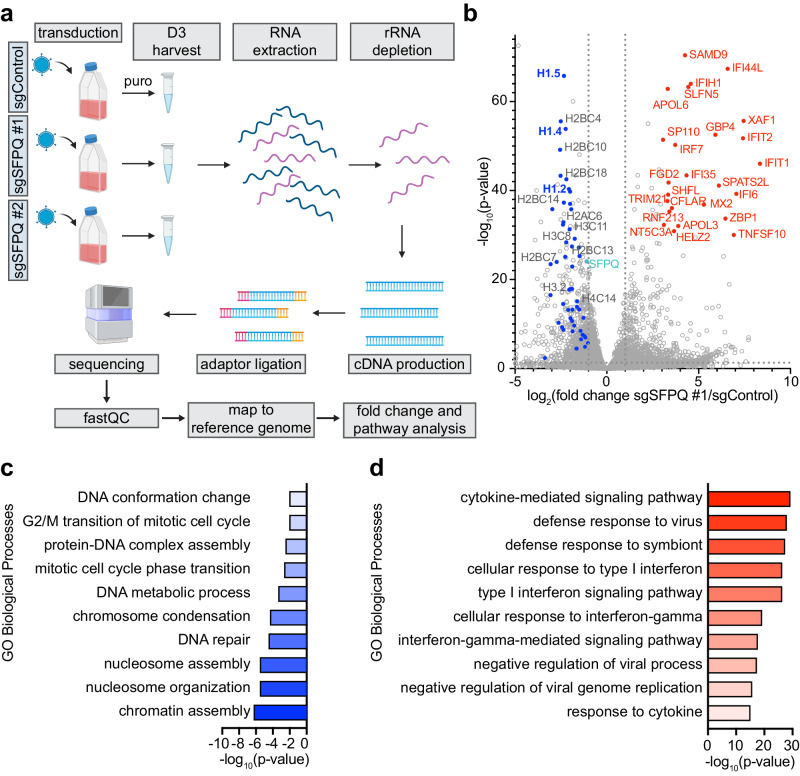
Epstein-Barr virus (EBV) uses a biphasic lifecycle of latency and lytic reactivation to infect >95% of adults worldwide. Despite its central role in EBV persistence and oncogenesis, much remains unknown about how EBV latency is maintained. We used a human genome-wide CRISPR/Cas9 screen to identify that the nuclear protein SFPQ was critical for latency. SFPQ supported expression of linker histone H1, which stabilizes nucleosomes and regulates nuclear architecture, but has not been previously implicated in EBV gene regulation. H1 occupied latent EBV genomes, including the immediate early gene BZLF1 promoter. Upon reactivation, SFPQ was sequestered into sub-nuclear puncta, and EBV genomic H1 occupancy diminished. Enforced H1 expression blocked EBV reactivation upon SFPQ knockout, confirming it as necessary downstream of SFPQ. SFPQ knockout triggered reactivation of EBV in B and epithelial cells, as well as of Kaposi's sarcoma-associated herpesvirus in B cells, suggesting a conserved gamma-herpesvirus role. These findings highlight SFPQ as a major regulator of H1 expression and EBV latency.


Conflict of interest statement

The authors declare no competing interests.

Figures

Fig. 1
Fig. 1. SFPQ represses EBV lytic reactivation.
a Volcano plot of −log10(p value) vs. log2(gp350+ vs. input sgRNA fold change) on Day 6 post lentiviral transduction of P3HR-1 cells (data from ref. ). Previously characterized regulators of lytic reactivation are highlighted in black. SFPQ is labeled in blue. Data represent three biological replicates. b Log2(fold change) of the four guides targeting SFPQ (teal) compared to the distribution of all sgRNA guides from the CRISPR screen (data from ref. ). c Schematic depicting the four main functions known for SFPQ: (1) transcriptional repression, (2) transcriptional activation, (3) mRNA binding, and (4) co-localization with NEAT1 lncRNA in paraspeckles. d Immunoblot analysis of EBV BZLF1 and BMRF1 from whole cell lysates (WCL) obtained from three Burkitt lymphoma (BL), two gastric carcinoma (GC), and one nasopharyngeal carcinoma (NPC) Cas9+ cell lines expressing control or SFPQ sgRNAs. e Mean ± standard deviation of % gp350+ Cas9+ P3HR-1 cells from n = 3 biological replicates following expression of control or SFPQ sgRNAs. f Mean ± standard deviation of intracellular EBV genome copy number from n = 3 biological replicates of Cas9+ P3HR-1 cells expressing control or SFPQ sgRNAs. g Representative immunofluorescence microscopy images of HA-GFP (control) or CRISPR-resistant HA-SFPQR expression (green) with co-staining for endogenous SFPQ (magenta) and nuclear DAPI (blue) in Cas9+ MUTU I cells. Scale bar = 5 µm. Images are representative of n = 3 biological replicates. h Immunoblot analysis of WCL from Cas9+ MUTU I cells expressing control GFP or CRISPR-resistant SFPQ cDNA (HA-SFPQR) together with control or endogenous SFPQ targeting sgRNAs. Immunoblots are representative of n = 3 biological replicates and densitometry values normalized to the loading control GAPDH are shown. DL indicates below the detection limit. NA indicates not applicable because the control value is below the detection limit. *p ≤ 0.05, **p ≤ 0.01, ***p ≤ 0.001, ns not significant were calculated by one-way ANOVA. Source data are provided as a Source Data file.
Fig. 2
Fig. 2. SFPQ represses early stages of EBV lytic reactivation in a MYC and NONO independent manner.
a Immunoblot analysis of BZLF1 and BMRF1 using WCL from Cas9+ MUTU I cells expressing control GFP-V5 or MYC-HA cDNA and also control or SFPQ sgRNAs. b Mean ± standard deviation % gp350+ cells from n = 3 biological replicates of Cas9+ MUTU I cells expressing GFP-V5 or MYC-HA cDNA upon expression of either control or SFPQ sgRNAs. c Mean ± standard deviation of intracellular EBV genome copy number from n = 3 biological replicates of Cas9+ MUTU I cells expressing GFP-V5 or MYC-HA cDNA and also control or SFPQ sgRNAs. d Immunoblot analysis of WCL from Cas9+ MUTU I cells expressing sgRNAs targeting EBV early gene BXLF1 (which is not required for lytic replication) or immediate early gene BZLF1, as well as control or SFPQ targeting sgRNAs. e Mean ± standard deviation % gp350+ cells from n = 3 biological replicates of Cas9+ MUTU I cells expressing BXLF1 or BZLF1 sgRNAs, as well as control or SFPQ sgRNAs. f Immunoblot analysis of WCL from Cas9+ P3HR-1 cells expressing control, NONO, or SFPQ sgRNAs. g Schematic indicating that MYC and SFPQ operate in parallel pathways to repress EBV lytic reactivation. Immunoblots are representative of n = 3 biological replicates and densitometry values normalized to the loading control GAPDH are shown. *p ≤ 0.05, **p ≤ 0.01, ***p ≤ 0.001, ****p ≤ 0.0001, ns not significant were calculated by one-way ANOVA. Source data are provided as a Source Data file.
Fig. 3
Fig. 3. SFPQ regulates expression of chromatin organization and interferon-related genes.
a Workflow of the RNA-seq analysis performed. Briefly, SFPQ was knocked out in Cas9+ P3HR-1 cells via transduction using lentiviruses that expressed control or either of two independent SFPQ sgRNAs. Transduced cells were puromycin (puro) selected. On Day 3 post selection (Day 6 post transduction), cells were harvested. RNA-seq was performed on ribosomal RNA (rRNA) depleted RNA. b Volcano plot of the −log10(p value) vs. log2(fold change) of mRNA expression in cells expressing SFPQ sgRNA #1 vs. control sgRNA. The adjusted p value (corrected for multiple testing via the Benjamini and Hochberg method) was used. Selected genes that were differentially expressed are highlighted in red (increased) or blue (decreased). c, d The top 10 significantly enriched (adjusted p value < 0.05 calculated using the Benjamini and Hochberg method) gene ontology (GO) Biological Processes of genes that were (c) decreased or (d) increased in abundance in SFPQ depleted (sg #1) vs. control cells.
Fig. 4
Fig. 4. SFPQ regulates expression of linker histone H1.
a Schematic illustrating linker histone H1 (blue oval) binding to inter-nucleosomal DNA to drive chromatin compaction and repress transcription. b Immunoblot analysis of H1.2 and H1.4 protein levels in WCL of Cas9+ P3HR-1 cells expressing control or SFPQ sgRNAs. c RT-qPCR analysis of mean ± standard deviation of 18S RNA normalized HIST1H1C (H1.2) and HIST1H1E (H1.4) abundances from n = 4 biological replicates of Cas9+ P3HR-1 cells expressing control or SFPQ sgRNAs. Pvalues were calculated using a two-tailed Student’s t test. d Immunoblot analysis of H1.2 and H1.4 protein levels in WCL of Cas9+ EBV− MUTU I cells expressing control or SFPQ sgRNAs. e RT-qPCR analysis of mean ± standard deviation of 18S RNA normalized HIST1H1C (H1.2) and HIST1H1E (H1.4) abundances from n = 4 biological replicates of Cas9+ EBV− MUTU I cells expressing control or SFPQ sgRNAs. P values were calculated using a two-tailed Student’s t-test. f Schematic of full length vs. domain deletion SFPQ constructs that were generated. g Immunoblot analysis of EBV lytic proteins in WCL from Cas9+ EBV+ MUTU I cells that expressed the indicated SFPQ cDNA construct refractory to CRISPR editing, along with control or SFPQ sgRNAs. h ChIP-qPCR analysis of HA-FL or HA-ΔDBD occupancy of the H1.2 promoter in Cas9+ MUTU I cells. Mean ± standard deviation from n = 3 biological replicates is shown withp value calculated by one-way ANOVA. Representative immunoblots from n = 3 biological replicates and densitometry quantification with values normalized to the loading control GAPDH are shown. *p ≤ 0.05, **p ≤ 0.01. Source data are provided as a Source Data file.
Fig. 5
Fig. 5. Histone H1 occupies multiple EBV genomic elements.
a Immunoblot analysis of WCL from Cas9+ P3HR-1 cells expressing control, H1.2, and/or H1.4 sgRNAs. b Immunoblot analysis of WCL from Cas9+ MUTU I cells expressing V5-tagged GFP, H1.2, H1.4, or H3 cDNA and subsequently control or SFPQ sgRNAs. c Schematic of the H1.2 ChIP-qPCR assay. For clarity, nucleosomes are not shown. df ChIP-qPCR analysis of H1.2 occupancy at the EBV (d) BZLF1 promoter, (e) oriLytL enhancer, and (f) oriLytR enhancer at 0, 6, and 24 h post 4-HT-induced lytic reactivation in Cas9+ P3HR-1 cells. These cells express the EBV immediate early proteins BZLF1 and BRLF1 fused to a modified estrogen receptor binding domain specific for 4-HT (P3HR-1 ZHT/RHT cells). 4-HT addition triggers BZLF1 and BRLF1 nuclear translocation and early gene expression. Mean ± standard deviation from n = 3 biological replicates is shown. *p ≤ 0.05, **p ≤ 0.01, ***p ≤ 0.001, ****p ≤ 0.0001 were calculated by one-way ANOVA. g Heatmap analysis of log2(fold change) of histone mRNA abundance from RNA-seq analysis (GEO GSE240008) of MUTU I cells triggered for lytic reactivation by electroporation of a BZLF1 expression vector for the indicated times, relative to levels in cells electroporated for the same times with a GFP negative control expression vector. The values shown are for histones whose abundance was significantly decreased by SFPQ depletion in the RNA-seq analysis shown in Fig. 3. Histones are clustered by histone type. h Log2(fold change) of histone protein abundance in P3HR-1 ZHT/RHT cells triggered for lytic reactivation by 4-HT for the indicated times, relative to levels in mock-induced cells. The values shown are for histones whose transcripts were significantly decreased in abundance upon SFPQ depletion, relative to control levels, in the RNA-seq analysis shown in Fig. 3. Histones are clustered by histone type. Representative immunoblots from n = 3 biological replicates and densitometry quantification with values normalized to the loading control GAPDH are shown. Source data are provided as a Source Data file.
Fig. 6
Fig. 6. SFPQ re-distribution correlates with the temporal loss of H1.2 and H1.4 during EBV lytic reactivation.
a Immunoblot analysis of WCL from P3HR-1 cells at the indicated timepoints post EBV lytic reactivation by 4-HT addition. Representative immunoblot from n = 3 biological replicates and densitometry quantification with values normalized to the loading control GAPDH is shown. b Representative immunofluorescence images from n = 3 biological replicates of SFPQ (green), BZLF1 (magenta), or nuclear DAPI (blue) signals in P3HR-1 cells triggered for lytic reactivation by 4-HT for the indicated timepoints. Scale bar = 5 µm. c Quantification of the number of SFPQ puncta/nucleus during EBV lytic reactivation of cells treated as in (b). Violin plots show the median (solid line) and interquartile range (dotted lines). The number of nuclei quantified across three biological replicates are indicated. *p ≤ 0.05, **p ≤ 0.01, ****p ≤ 0.0001, ns not significant were calculated by one-way ANOVA. Values at a given timepoint were cross-compared with all subsequent timepoints. The color code indicated in the box at the top left indicates the timepoint used for cross-comparison for significance calculation. d Model of the roles of SFPQ and H1 in repressing EBV lytic reactivation. During EBV latency, SFPQ promotes expression of the histone H1 variants H1.2 and H1.4, which accumulate on the EBV genome at key regions and promote a compacted, repressive chromatin state that impedes expression of lytic genes. Upon EBV lytic reactivation, SFPQ is re-distributed within the nucleus to puncta by 6 h post lytic reactivation. This re-distribution precludes SFPQ from supporting H1.2 and H1.4 expression. Expression and protein levels of these H1 variants decline and so does their association with the EBV genome, which facilitates EBV lytic gene expression. Source data are provided as a Source Data file.

References

    1. Gewurz, B. E., Longnecker, R. & Cohen, J. I. Epstein-Barr virus. in Fields Virology, 7th edn (eds Knipe, D. & Howley, P.) 324–389 (Wolters Kluwer, 2021).
    1. Farrell PJ. Epstein-Barr virus and cancer. Annu. Rev. Pathol. 2019;14:29–53. doi: 10.1146/annurev-pathmechdis-012418-013023. - DOI - PubMed
    1. Young LS, Yap LF, Murray PG. Epstein-Barr virus: more than 50 years old and still providing surprises. Nat. Rev. Cancer. 2016;16:789–802. doi: 10.1038/nrc.2016.92. - DOI - PubMed
    1. Damania B, Kenney SC, Raab-Traub N. Epstein-Barr virus: biology and clinical disease. Cell. 2022;185:3652–3670. doi: 10.1016/j.cell.2022.08.026. - DOI - PMC - PubMed
    1. Bjornevik K, et al. Longitudinal analysis reveals high prevalence of Epstein-Barr virus associated with multiple sclerosis. Science. 2022;375:296–301. doi: 10.1126/science.abj8222. - DOI - PubMed

MeSH terms

Substances