. 2024 May 16;15(1):4163.
doi: 10.1038/s41467-024-48488-7.

TDP-43 proteinopathy in ALS is triggered by loss of ASRGL1 and associated with HML-2 expression

Affiliations

TDP-43 proteinopathy in ALS is triggered by loss of ASRGL1 and associated with HML-2 expression

Marta Garcia-Montojo et al. Nat Commun. .

Abstract

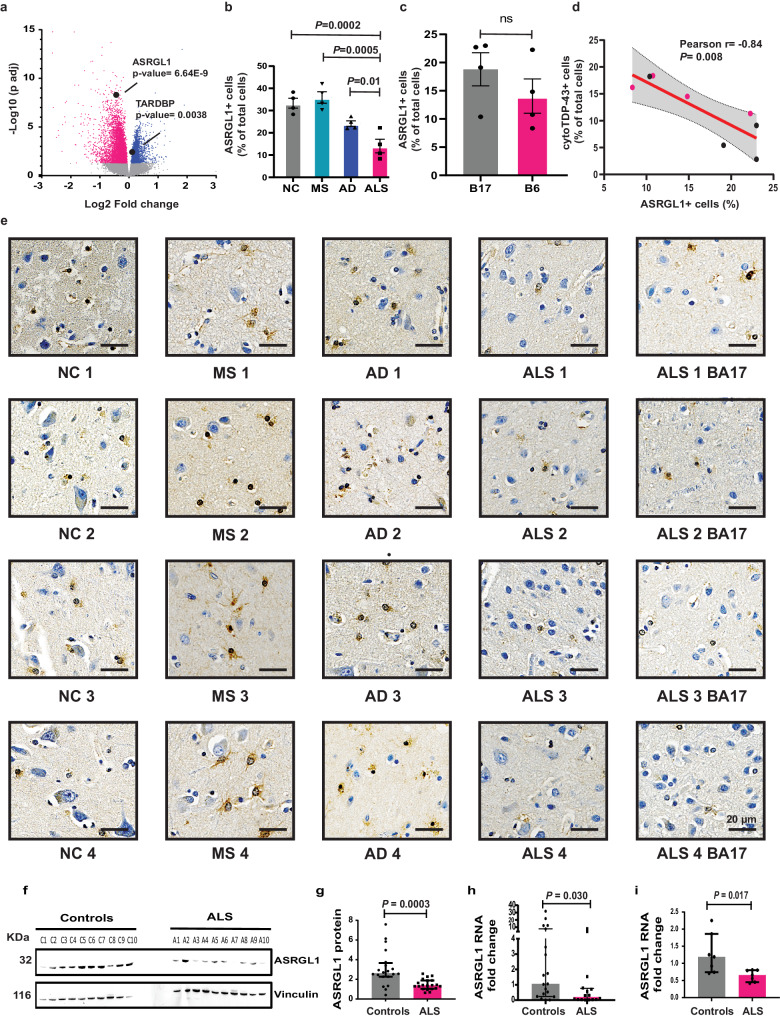
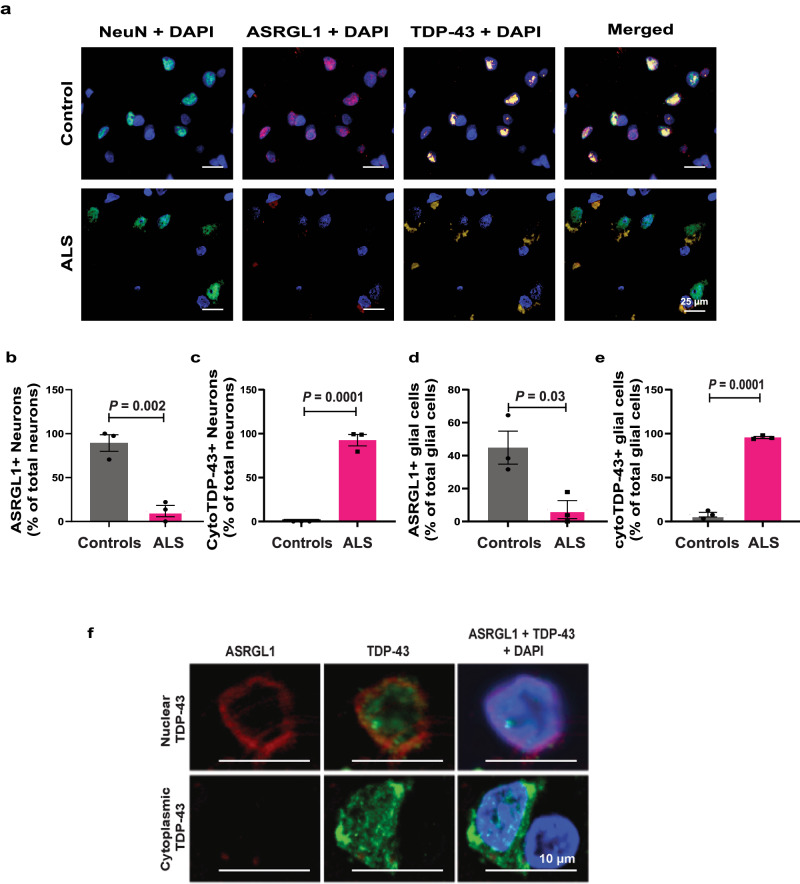
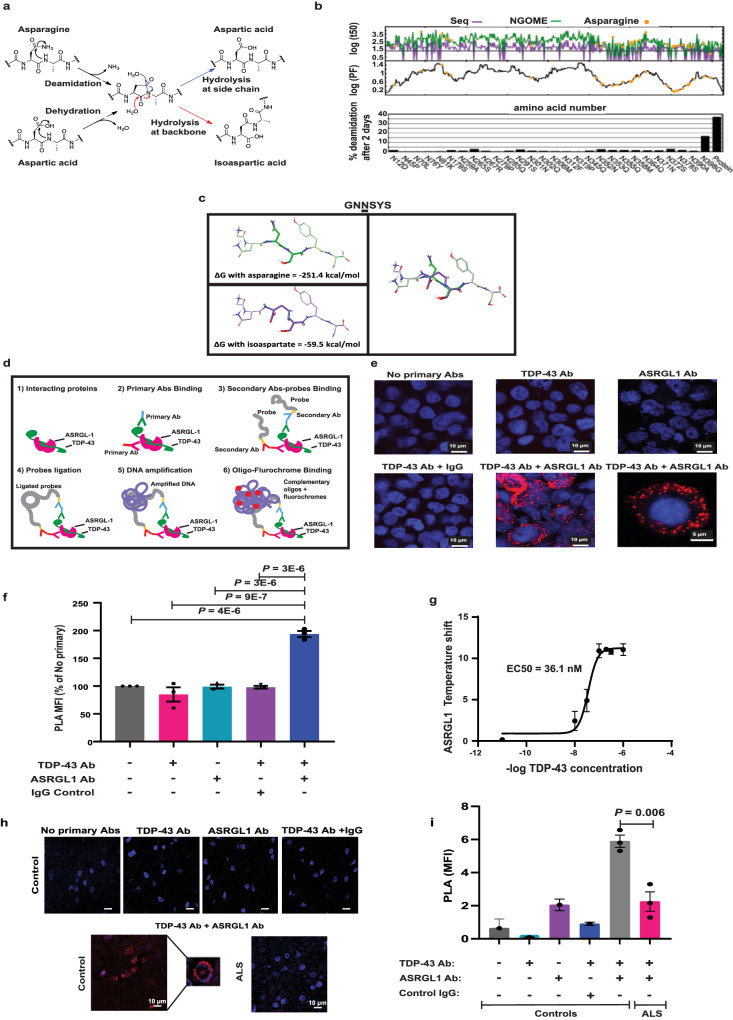
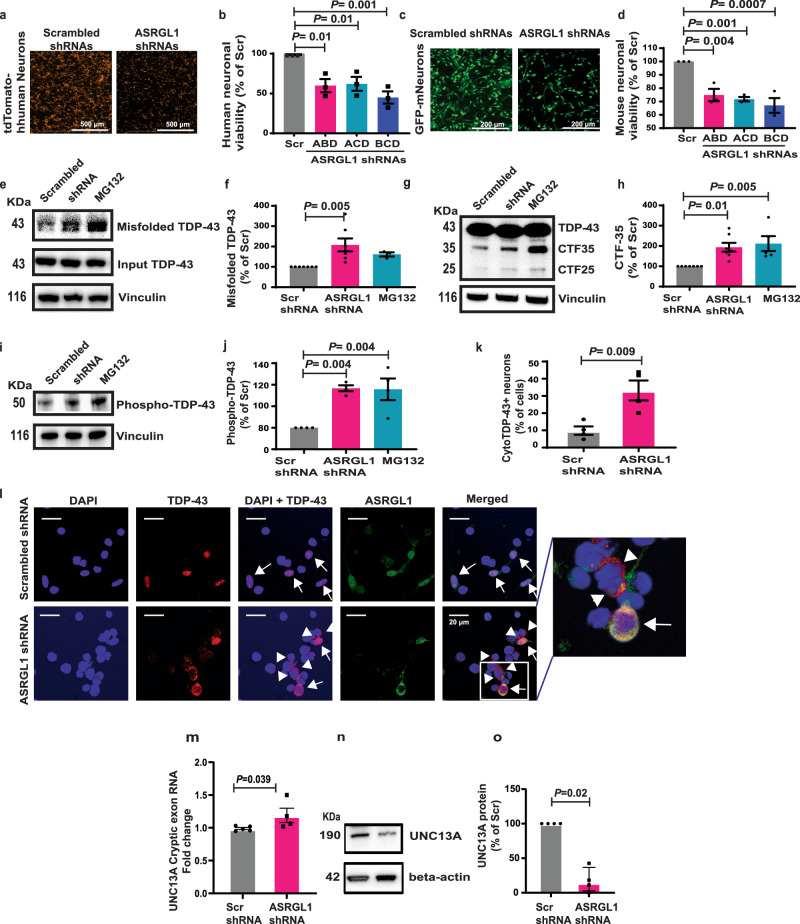
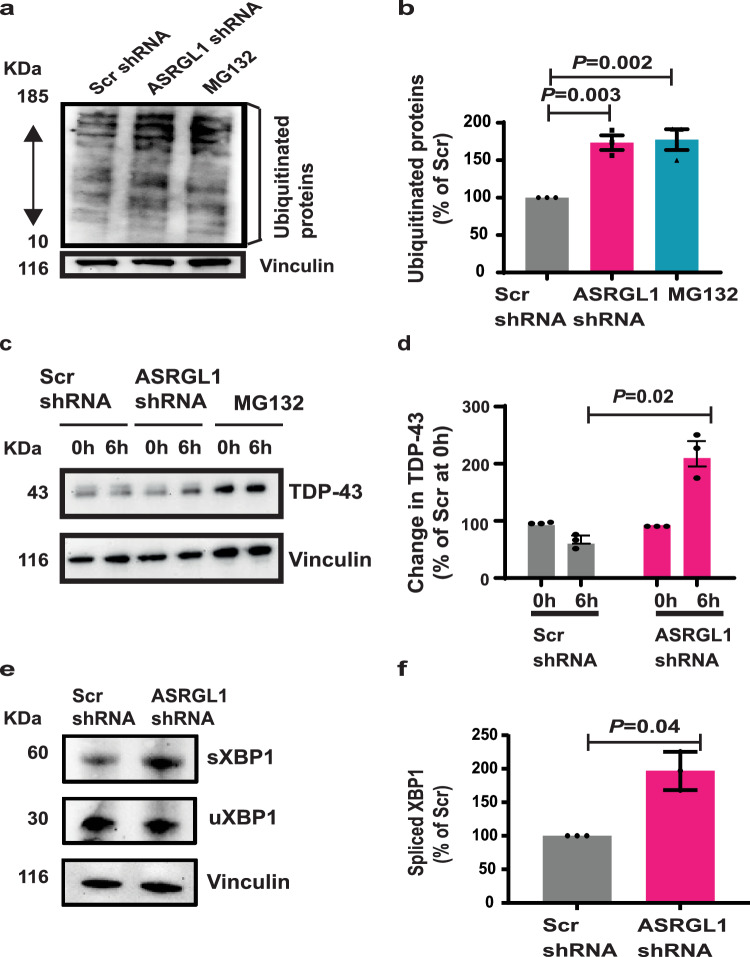
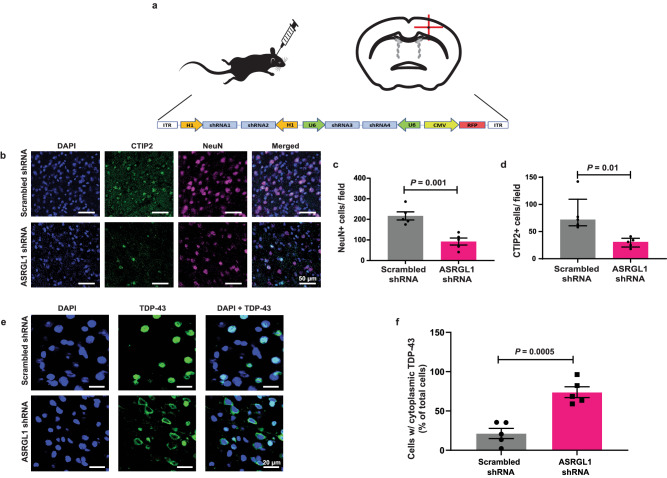
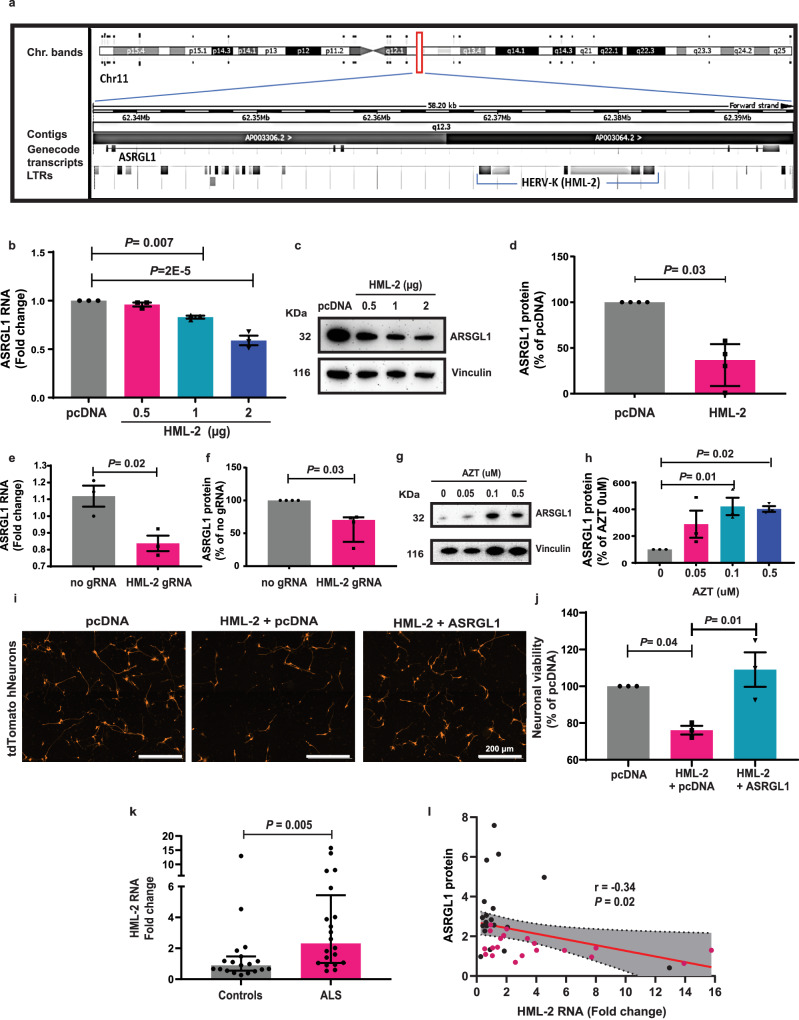
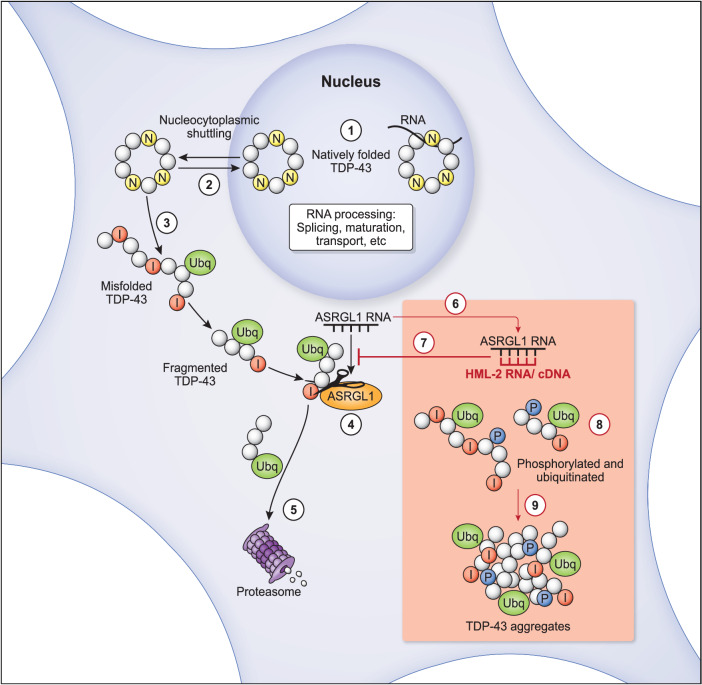
TAR DNA-binding protein 43 (TDP-43) proteinopathy in brain cells is the hallmark of amyotrophic lateral sclerosis (ALS) but its cause remains elusive. Asparaginase-like-1 protein (ASRGL1) cleaves isoaspartates, which alter protein folding and susceptibility to proteolysis. ASRGL1 gene harbors a copy of the human endogenous retrovirus HML-2, whose overexpression contributes to ALS pathogenesis. Here we show that ASRGL1 expression was diminished in ALS brain samples by RNA sequencing, immunohistochemistry, and western blotting. TDP-43 and ASRGL1 colocalized in neurons but, in the absence of ASRGL1, TDP-43 aggregated in the cytoplasm. TDP-43 was found to be prone to isoaspartate formation and a substrate for ASRGL1. ASRGL1 silencing triggered accumulation of misfolded, fragmented, phosphorylated and mislocalized TDP-43 in cultured neurons and motor cortex of female mice. Overexpression of ASRGL1 restored neuronal viability. Overexpression of HML-2 led to ASRGL1 silencing. Loss of ASRGL1 leading to TDP-43 aggregation may be a critical mechanism in ALS pathophysiology.


Conflict of interest statement

The authors declare no competing interests.

Figures

Fig. 1
Fig. 1. Decreased levels of ASRGL1 in ALS patients associate with TDP-43 proteinopathy.
a Volcano plot showing the differential expression analysis (DEA) of RNA sequencing data from brain samples of ALS individuals (n = 323) and normal controls (n = 68). Blue dots: genes upregulated in ALS; red dots: genes downregulated in ALS; gray dots: genes with no statistically significant differences (Differential expression analysis (DEA)). Differentially expressed genes (DEGs) were counted as genes with a False discovery rate (FDR) adjusted p value < 0.05). b, c, e ASRGL1 immunostaining of brain samples. Motor cortex samples (Broadman area 6) of ALS individuals (n = 4), multiple sclerosis individuals (MS) (n = 4), Alzheimer’s disease (AD) (n = 4), and normal controls (NC) (n = 4) were immunostained for ASRGL1. Visual cortex samples (Broadman area 17) from the same ALS individuals were also stained for ASRGL1 and consecutive slides of those samples were stained for TDP-43. ASRGL1+ cells were quantified by automated microscopy and presence of cytoplasmic TDP-43 was analyzed manually in a blinded manner. b Percentage of cells positive for ASRGL1 in FFPE motor cortex samples (BA6), (one-way ANOVA (Mean ± SEM)). c Percentage of ASRGL1+ cells in BA6 and BA17 of the same ALS individuals (two-sided unpaired T-test; Mean ± SEM). d Correlation of the percentage of ASRGL1+ cells and the percentage of cells with cytoplasmic TDP-43 in ALS samples (red dots: BA6; black dots: BA17) (Pearson’s r test; Middle line represents best fit line and error lines represent 95% confidence bands of the best fit line). e Representative images of ASRGL1 immunostaining in brain. f, g Pre-motor cortex samples (BA 6) (20 ALS and 20 normal controls) were analyzed by western blotting to measure ASRGL1 protein (Atlas antibody 029725). f Representative image of a western blot for ASRGL1 and the loading control vinculin. g Levels of ASRGL1 protein (ratio ASRGL1/Vinculin) in ALS brains analyzed by Mann–Whitney test (Median (IQR). h ASRGL1 RNA levels were analyzed in brain samples (BA6) from ALS patients (n = 19) and normal controls (n = 16) by qPCR (Mann–Whitney test (Median (IQR)). i ASRGL1 RNA levels were analyzed in differentiated motor neurons derived from iPSCs lines from ALS individuals (n = 6) and normal controls (n = 6), by qPCR (Mann–Whitney test (Median (IQR)). All pairwise comparisons in the Figure were performed with two-sided tests. Source data are provided as a Source Data file.
Fig. 2
Fig. 2. Association of ASRGL1 loss and TDP-43 proteinopathy in brain samples of ALS patients.
af FFPE brain cortex samples from 3 pre-selected ALS individuals with very low levels of ASRGL1 and 3 normal controls were stained by immunofluorescence with ASRGL1 and TDP-43 antibodies. a Representative immunofluorescence images of brain cortex showing ASRGL1 and TDP-43 in an ALS individual and a normal control. b Percentage of neurons positive for ASRGL1 in normal controls and ALS brain samples. c Percentage of neurons showing cytoplasmic TDP-43. d Percentage of glial cells positive for ASRGL1 in controls and ALS patients. e Percentage of glial cells showing cytoplasmic TDP-43. Data in (be) analyzed by two-sided Unpaired T-test and represented as mean ± SEM. f Amplified image of brain cells of the same cortical brain sample of an ALS patient showing nuclear TDP-43 staining associated with perinuclear staining of ASRGL1 (upper panels) and loss of ASRGL1 associated with cytoplasmic TDP-43 (lower panels). Source data are provided as a Source Data file.
Fig. 3
Fig. 3. TDP-43 is predicted to form isoaspartates through asparagine deamidation and TDP-43 interacts with ASRGL1.
a Spontaneous formation of isoaspartate by asparagine deamidation or aspartate isomerization. b Prediction of TDP-43 asparagine deamidation under physiological conditions using the NGOME algorithm. Top panel: Predicted deamidation half-lives (time point at which the residue is deaminated in 50%) considering sequence propensities (purple line) and sequence propensities + structural protection (green line). Orange circles highlight actual asparagine residues; the lines are the predictions for all positions of the query sequence. Middle panel: Structure protection factor (PF) as a function of residue number. Bottom panel: Percentage of deamidation predicted for asparagine residues after 2 days. c Example of 3D modeling of a TDP-43 peptide with isoaspartate substitution in a “hot spot” predicted by NGOME-Lite, showing the variation in the Gibbs free energy values, indicative of thermodynamic instability. d Diagram explaining Proximity ligation assay (PLA). e, f PLA was performed in HEK 293 cells transfected with ASRGL1 and TDP-43 plasmids and incubated with antibodies: no primary, only TDP-43, only ASRGL1, TDP-43 + IgG and ASRGL1 + TDP-43. e Representative PLA images of HEK 293 cells transfected with ASRGL1 and TDP-43 plasmids and incubated with ASRGL1 + TDP-43 antibodies and controls. f Comparison of percentage of PLA mean fluorescence intensity (PLA MFI) in relation with “No primary” control. (Brown-Forsythe ANOVA test/Bonferroni correction; Mean ± SEM; number of experimental replicates = 3). g Interaction of ASRGL-1 with TDP43 (recombinant proteins) using thermal shift assays. Tm value was calculated from the derivative of the thermal melt curves (Sigmoidal, Four-parameter logistic curve (4PL); Mean (95% CI); number of experimental replicates = 3). h, i PLA was performed in brain samples of ALS individuals (n = 3) and normal controls (n = 3) with TDP-43 and ASRGL1 antibodies. Negative controls were performed on a normal control brain since the expression of ASRGL1 is higher in normal controls. h Representative images of PLA in a normal control and an ALS patient brain stained with TDP-43 + ASRGL1 antibodies and the negative controls. i PLA MFI comparison (one-way ANOVA with Bonferroni correction (Mean ± SEM). All pairwise comparisons in the Figure were performed with two-sided tests. Source data are provided as a Source Data file.
Fig. 4
Fig. 4. ASRGL1 silencing causes TDP-43 proteinopathy and neuronal death.
a, b IPSc-derived human neurons (normal donor) line stably expressing tdTomato protein and (c, d) Mouse neurons derived from a commercial neural stem cell line stably expressing GFP were transfected with ASRGL1 shRNAs or scrambled shRNAs. Fluorescent neurons were counted automatically after 48 h. a, c Representative fluorescence microscopy images. b, d Comparison of cellular viability (Percentage of counted cells/field in relation to scrambled shRNAs) (Brown-Forsythe ANOVA test with Bonferroni correction; Mean ± SEM; number of experimental replicates = 3). e, f Misfolded TDP-43 was analyzed in IPSc derived (normal donor) neuronal cultures co-transfected with an intrabody against misfolded TDP-43, full-length TDP-43, and ASRGL1 shRNAs or scrambled shRNAs, by co-immunoprecipitation and western blotting. Proteasome inhibitor MG132 was used as positive control. e Image of a TDP-43 blot. Due to the low levels of misfolded protein, blots were exposed longer. f Comparison of misfolded TDP-43 levels (Brown-Forsythe ANOVA test with Bonferroni correction; Mean ± SEM; number of experimental replicates = 7). g, h Neuronal cultures were transfected with TDP-43 and ASRGL1 shRNAs or scrambled shRNAs and analyzed by western blotting. g Image of a TDP-43 C-terminal fragments (CFT) blot. Due to the low levels of CFTs, blots were exposed longer. h Comparison of CTF levels (Brown-Forsythe ANOVA test with Bonferroni correction; Mean ± SEM; number of experimental replicates = 7). io Neuronal cultures were transfected with ASRGL1 shRNAs or scrambled shRNAs and analyzed by western blotting. i Image of a phosphorylated TDP-43 blot. j Comparison of phosphorylated TDP-43 levels (Brown-Forsythe ANOVA test with Bonferroni correction; Mean ± SEM; number of experimental replicates = 4). k Comparison of the percentage of neurons with cytoplasmic TDP-43 (two-sided unpaired T-test; Mean ± SEM. l Confocal microscope images of nuclear TDP-43 (arrows) and TDP-43 cytoplasmic inclusions (arrow heads) in neurons. m RNA levels of UNC13A cryptic exon, by qPCR. n Image of a UNC13A protein blot. o Comparison of UNC13A protein levels in percentage relative to scrambled shRNA transfected cells (Mann–Whitney test; Mean ± SEM; number of experimental replicates = 4). All pairwise comparisons in the Figure were performed with two-sided tests. Source data are provided as a Source Data file.
Fig. 5
Fig. 5. ASRGL1 silencing impairs protein degradation.
a, b Neuronal cultures were transfected with ASRGL1 shRNAs or scrambled shRNAs. a Representative image of a western blot for ubiquitinated proteins. b Comparison of ubiquitinated proteins levels in percentage relative to the scrambled shRNA transfected cells (Brown-Forsythe ANOVA test with Bonferroni correction; Mean ± SEM; number of experimental replicates = 3)). c, d After transfection with scrambled shRNAs or ASRGL1 shRNAs, neuronal cultures were treated with cycloheximide (CHX) for 6 h. c Representative blot showing the levels of TDP-43 before and after 6 h of CHX. d Percentage of variation in TDP-43 levels after 6 h of CHX (number of experimental replicates = 3; Unpaired T-test; Mean ± SEM). e, f Neuronal cultures were transfected with ASRGL1 shRNAs or scrambled shRNAs. e Western blot of spliced XBP1 (sXBP1), unspliced (uXBP1) and vinculin in ASRGL1-silenced and control neurons. f Comparison of sXBP1 levels in percentage relative to the scrambled shRNA transfected cells (Mann–Whitney test; Median (IQR); number of experimental replicates = 4). All pairwise comparisons in the Figure were performed with two-sided tests. Source data are provided as a Source Data file.
Fig. 6
Fig. 6. ASRGL1 rescues TDP-43-proteinopathy and associated neurotoxicity.
a, b iPSCs-derived human neuronal cultures from a normal donor were co-transfected with TDP-43, with shRNAs against ASRGL1 or scrambled shRNAs and with increasing concentrations of an ASRGL1-encoding plasmid or with pcDNA as a control. The number of cells presenting cytoplasmic TDP-43 was analyzed by immunofluorescence followed by confocal microscopy. a Percentage of neurons presenting cytoplasmic TDP-43 (one-way ANOVA with Bonferroni correction; Mean ± SEM; number of experimental replicates = 4). b Percentage of neuronal viability in relation to the control (pcDNA), as measured by flour spectrometry after applying Alamarblue (Thermo Fisher) (Brown-Forsythe ANOVA test with Bonferroni correction; Mean ± SEM; number of experimental replicates = 6). c, d IPSc-derived human neuronal cultures from a normal donor were co-transfected with wild type or isoaspartate containing C-terminal TDP-43 peptides, and with an ASRGL1 plasmid or an empty vector (pcDNA). c Percentage of neuronal viability in relation to the control (neurons transfected with pcDNA) (Brown-Forsythe ANOVA test with Bonferroni correction; Mean ± SEM; number of experimental replicates = 6). d Neurite length expressed as a percentage of the control (neurons transfected with pcDNA) (Brown-Forsythe ANOVA test with Bonferroni correction; Mean ± SEM; number of experimental replicates = 6). All pairwise comparisons in the Figure were performed with two-sided tests. Source data are provided as a Source Data file.
Fig. 7
Fig. 7. ASRGL1 silencing triggers death of motor neurons and TDP-43 proteinopathy in mice.
Adult female C57BL/6 mice received a stereotaxic injection to deliver 2 µl of viral solution (10e13 AAV9 viral particles/ml) in the motor cortex. Half of the mice (n = 5) received particles with a construct encoding 4 scrambled shRNAs and the other half (n = 5) received particles with a construct encoding 4 shRNAs against ASRGL1 (sequences in Supplementary Table 5). One month after the injection, brain sections were immunostained and analyzed by confocal microscopy. a Schematic representation of the injection site in the motor cortex (coordinates: 1.5 mm lateral, 1.1 mm anterior, 1.6 mm ventral) and the shRNA construct delivered within the AAV9 viral particles. b Representative images of brains sections from an ASRGL1-silenced mouse and a control stained for NeuN and CTIP2. c Comparison of NeuN+ cells (neurons) in the motor cortex of ASRGL1-silenced mice and controls (Unpaired T-test; Mean ± SEM). d Comparison of CTIP2+ cells (motor neurons) in the motor cortex of ASRGL1-silenced mice and controls (Mann–Whitney; Median (IQR)). e Brain section of an ASRGL1-silenced mouse showing cytoplasmic staining of TDP-43 (arrow heads), compared to a control mouse showing nuclear staining of TDP-43. f Percentage of cells showing cytoplasmic TDP-43 in ASRGL1-silenced mice and controls (Unpaired T-test; Mean ± SEM). All pairwise comparisons in the Figure were performed with two-sided tests. Source data are provided as a Source Data file.
Fig. 8
Fig. 8. ASRGL1 is downregulated by HML-2 and rescues HML-2-driven neurotoxicity.
a Diagram showing the location of an HML-2 intronic copy in ASRGL1 gene (Ensembl.org). bd iPSCs-derived human neuronal cultures from a normal donor were transfected with an HML-2 plasmid or with an empty vector (pcDNA). b ASRGL1 RNA levels quantified by real-time qPCR (Brown-Forsythe ANOVA test with Bonferroni correction; Mean ± SEM; number of experimental replicates = 3). c Western blot for ASRGL1 and vinculin (loading control). d Comparison of ASRGL1 protein levels expressed as a percentage of the control (pcDNA) in neuronal cultures transfected with pcDNA (1 µg) or HML-2 (1 µg), by western blotting (number of experimental replicates = 4; Mann–Whitney test; Median (IQR)). e, f IPSc-derived human neuronal cultures from a normal donor were transfected with a CRISPR/dCAS9 construct with guide-RNAs (gRNAs) targeting the LTR to activate endogenous expression of HML-2 or without gRNAs. e ASRGL1 RNA levels, by qPCR (Unpaired T-test; Mean ± SEM). f Comparison of ASRGL1 protein levels expressed as a percentage of the control (no guide RNAs), by western blotting (number of experimental replicates = 4; Mann–Whitney test; Median (IQR)). g, h iPSCs-derived neural stem cells were treated with increasing concentrations of zidovudine (AZT). g Western blot for ASRGL1 and vinculin. h ASRGL1 protein levels expressed as a percentage of the control (no zidovudine) (Brown-Forsythe ANOVA test with Bonferroni correction; Mean ± SEM; number of experimental replicates = 3). i, j IPSc-derived human neuronal cultures from a normal donor stably expressing td-Tomato protein were transfected with a pcDNA plasmid, co-transfected with pcDNA and HML-2 or co-transfected with HML-2 and a plasmid encoding ASRGL1, and neuronal viability was measured by automated fluorescence microscopy. i Representative images of fluorescence microscopy. j Percentage of neuronal viability relative to the control (pcDNA transfected cells) (Brown-Forsythe ANOVA test with Bonferroni correction; Mean ± SEM; number of experimental replicates = 3). k, l RNA and proteins were extracted from brain cortex samples of ALS patients (n = 20) and normal controls (n = 19); the levels of HML-2 env RNA were analyzed by qPCR and the levels of ASRGL1 protein were analyzed by western blotting. k HML-2 RNA levels in ALS brains and normal controls, by qPCR (Mann–Whitney test; Median (IQR)). l Correlation between HML-2 RNA and ASRGL1 protein levels (ratio of ASRGL1 to Vinculin, as measured by western blotting) (Pearson’s r test; red dots: ALS; black dots: controls). The levels of ASRGL1 (ratio of ASRGL1 to Vinculin) in ALS and control brains are shown in Fig. 1f–h. All pairwise comparisons in the Figure were performed with two-sided tests. Source data are provided as a Source Data file.
Fig. 9
Fig. 9. Schematic representation of potential processes triggered by loss of ASRGL1 resulting in TDP-43 proteinopathy in ALS.
(1) TDP-43 is involved in RNA transcription, splicing, stability, transport, and translation. (2) It is predominantly found in the cell nucleus but to perform its functions, TDP-43 is shuttled in its native form from the nucleus to the cytoplasm. (3) Isoaspartates (I) are formed spontaneously and non-enzymatically by deamidation of asparagine residues (N) of TDP-43. They introduce a kink in the peptide chain, favoring misfolding. Misfolded and fragmented TDP-43 are ubiquitinated for proteasome degradation. (4) Since proteases do not recognize isoaspartates residues, they must be cleaved from the peptide chain by ASRGL1 in the perinuclear region for the misfolded/fragmented protein to be (5) degraded by the proteasome. (6) The HML-2 copy is in the opposite strand of the ASRGL1 gene thus, the RNA of HML-2 is complementary to the RNA of ASRGL1 (HML-2 cDNA could also base pair with the ASRGL1 RNA). (7) HML-2 sequences could cause an antisense silencing on ASRGL1, interfering with its splicing, translation and/or activating the RNA-induced silencing complex. (8) If ASRGL1 is inactivated or depleted, isoaspartates residues cannot get cleaved and the aberrant TDP-43 forms (hyper-phosphorylated, misfolded and fragmented peptides) do not get degraded, (9) leading to a toxic aggregation in the cytoplasm. (Black arrows indicate physiological processes and red arrows indicate pathological processes).

References

    1. del Aguila MA, Longstreth WT, Jr, McGuire V, Koepsell TD, van Belle G. Prognosis in amyotrophic lateral sclerosis: a population-based study. Neurology. 2003;60:813–819. doi: 10.1212/01.WNL.0000049472.47709.3B. - DOI - PubMed
    1. Ignatius SH, Wu F, Harrich D, Garciamartinez LF, Gaynor RB. Cloning and characterization of a novel cellular protein, Tdp-43, that binds to human-immunodeficiency-virus type-1 Tar DNA-sequence motifs. J. Virol. 1995;69:3584–3596. doi: 10.1128/jvi.69.6.3584-3596.1995. - DOI - PMC - PubMed
    1. Ishiguro T, et al. Regulatory role of RNA chaperone TDP-43 for RNA misfolding and repeat-associated translation in SCA31. Neuron. 2017;94:108–124.e107. doi: 10.1016/j.neuron.2017.02.046. - DOI - PMC - PubMed
    1. Arai T, et al. TDP-43 is a component of ubiquitin-positive tau-negative inclusions in frontotemporal lobar degeneration and amyotrophic lateral sclerosis. Biochem. Biophys. Res. Commun. 2006;351:602–611. doi: 10.1016/j.bbrc.2006.10.093. - DOI - PubMed
    1. Prasad A, Bharathi V, Sivalingam V, Girdhar A, Patel BK. Molecular mechanisms of TDP-43 misfolding and pathology in amyotrophic lateral sclerosis. Front. Mol. Neurosci. 2019;12:25. doi: 10.3389/fnmol.2019.00025. - DOI - PMC - PubMed

MeSH terms