. 2024 May 17;15(1):4182.
doi: 10.1038/s41467-024-48570-0.

Recruitment of plasma cells from IL-21-dependent and IL-21-independent immune reactions to the bone marrow

Affiliations

Recruitment of plasma cells from IL-21-dependent and IL-21-independent immune reactions to the bone marrow

Marta Ferreira-Gomes et al. Nat Commun. .

Abstract

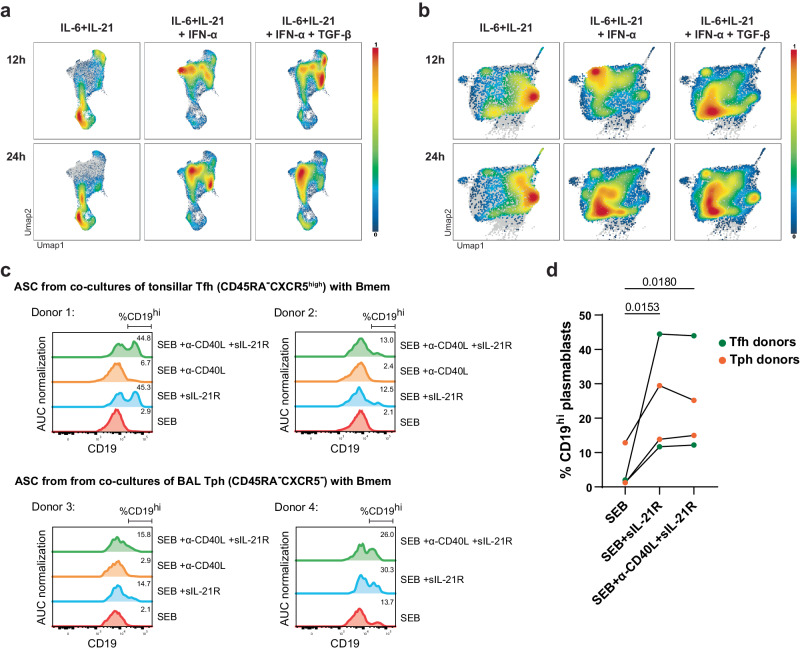
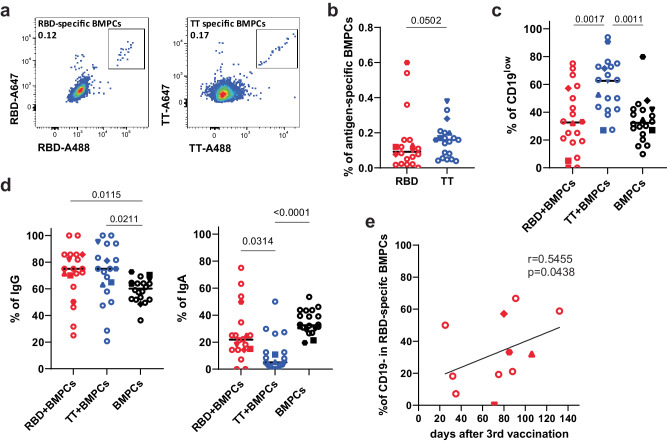
Bone marrow plasma cells (BMPC) are the correlate of humoral immunity, consistently releasing antibodies into the bloodstream. It remains unclear if BMPC reflect different activation environments or maturation of their precursors. Here we define human BMPC heterogeneity and track the recruitment of antibody-secreting cells (ASC) from SARS-CoV-2 vaccine immune reactions to the bone marrow (BM). Trajectories based on single-cell transcriptomes and repertoires of peripheral and BM ASC reveal sequential colonisation of BMPC compartments. In activated B cells, IL-21 suppresses CD19 expression, indicating that CD19low-BMPC are derived from follicular, while CD19high-BMPC originate from extrafollicular immune reactions. In primary immune reactions, both CD19low- and CD19high-BMPC compartments are populated. In secondary immune reactions, most BMPC are recruited to CD19high-BMPC compartments, reflecting their origin from extrafollicular reactivations of memory B cells. A pattern also observable in vaccinated-convalescent individuals and upon diphtheria/tetanus/pertussis recall-vaccination. Thus, BMPC diversity reflects the evolution of a given humoral immune response.


Conflict of interest statement

The authors declare no competing interests.

Figures

Fig. 1
Fig. 1. Transcriptional and functional heterogeneity of BMPC.
a Bone marrow plasma cells (BMPC; CD138high CD38high or CD38high CD27high) from 8 patients undergoing total hip replacement surgery were isolated and sorted by FACS for single-cell sequencing (gating strategy in Supplementary Fig. 1a). Amplified area: UMAP representation of remaining 38235 plasma cells after exclusion of contaminant and poor quality cells (see Supplementary Fig. 1b). Clusters of transcriptionally similar cells were identified using shared nearest neighbour (SNN) modularity optimisation. b Percentage of BMPC found in each cluster per donor’s total cells analysed. Horizontal lines indicate the median. n = 8 independent donors. c UMAP representation of the expression levels of selected PC signature genes across BMPC clusters. d Bubble plots of expression levels of the top five marker genes for each cluster (left) and of additional selected genes (right). Colour scale shows the z scores of the average expression of a gene within the indicated cluster. Bubble sizes correspond to the fraction of cells expressing a defined gene within the indicated cluster. e Density plots of immunoglobulin isotype expression within the BMPC compartment. f Frequency of plasma cells expressing a defined immunoglobulin isotype, displayed according to the clusters in a, per donor’s total cells where a full BCR could be identified. For better readability, each isotype was plotted separately, even though the percentages are related to the total BCRs from each donor. Horizontal lines indicate the median. n = 8 independent donors. g Density plots of BMPC significantly enriched in gene sets from different biological pathways as calculated by Gene Set Enrichment Analysis (GSEA). Source data are provided as a Source Data file.
Fig. 2
Fig. 2. BMPC are clonally diverse and present different mutation rates between CD19high and CD19low compartments.
a Number of clonal families of BCRs found within the different BMPC clusters (diversity) and probability of finding different clonal families by random selection of cells (Simpson diversity index). A clonal family was defined by V and J gene composition and a CDR3 region with <20% Hamming distance in both the heavy and light chains originating from one donor. b Mutation rates in the framework regions FR1-3 (left) and in the CDR1-3 regions (right) of the heavy and light chain rearrangements across BMPC clusters. c Bubble plot of the mutation rates in the framework regions FR1-3 (left) and in the CDR1-3 regions (right) of BCRs per isotype and cluster. Colour scale indicates median mutation rates. Values below or above the scale limits are shown in blue or red, respectively. Bubble sizes correspond to the percentage of cells expressing a defined isotype within the indicated cluster. d Violin plot depicting the mutation rates in the V gene of the BCRs of BMPC per cluster. Statistical significance between clusters is shown in Supplementary Data 1 (two-tailed Mann–Whitney U test). Horizontal lines represent the median mutation rate. Violins are coloured by the z score of CD19 gene expression in each cluster. e Identification of SARS-CoV-2 spike-specific and tetanus toxoid-specific public clones (in black) among analysed BMPC. Public clones were defined by exhibiting over 80% CDR3 sequence identity in both heavy and light chains when compared to the BCR of sequenced peripheral blood and bone marrow spike- and tetanus-specific cells from vaccinated individuals (see Supplementary Fig. 1a and Supplementary Data 1). f Relative distribution of spike-specific (red) and tetanus-specific (blue) BMPC (depicted in e) per cluster. g Comparison of mutation rates within the framework regions FR1-3 (left) and the CDR1-3 regions (right) of spike-specific (red) and tetanus-specific (blue) BMPC per isotype. Horizontal lines represent the median mutation rate. Statistics were performed using a two-tailed Mann–Whitney U test. Source data are provided as a Source Data file.
Fig. 3
Fig. 3. Type and timing of B-cell activation imprints on BMPC subsets.
a Schematic representation of vaccination, blood collection and sample analysis. Arrows indicate time points when transcriptome and full-length B-cell receptor repertoire sequencing was performed. b UMAP representation of the expression levels of selected genes in 55071 CD27highCD38high sorted peripheral blood ASC from 36 healthy individuals after COVID-19 or diphtheria, tetanus, pertussis (DTP) vaccination (see Supplementary Table 2 for information on participants and different vaccination schemes). Colour scale represents the expression level of the indicated genes. c Identification of SARS-CoV-2 spike-specific (red) public clones among analysed ASC. Public clones were defined by displaying >80% CDR3 sequence identity when compared to the BCR of sequenced peripheral blood and bone marrow spike- and tetanus-specific cells from vaccinated individuals (see Supplementary Fig. 1a and Supplementary Data 1). The number of public clones found is shown on the UMAP. d Bubble plot of mutation rates in the framework regions (FR1-3, left) and in the CDR regions (CDR1-3, right) of identified spike-specific public clones per isotype identified in time point after COVID-19 vaccination. Colour scale indicates median mutation rates. Values above the scale limits are shown in red. Bubble sizes correspond to the percentage of spike-specific cells expressing a defined isotype within the indicated group. e Density plots of BMPC significantly enriched in gene signatures from peripheral blood ASC isolated at different time points after vaccination as identified by Gene Set Enrichment Analysis (GSEA). Violin plots of the normalised enrichment score (NES) per BMPC cluster are depicted in Supplementary Fig. 4a. Statistical significance between NES scores is shown in Supplementary Data 1 (two-tailed Mann–Whitney U test). Source data are provided as a Source Data file.
Fig. 4
Fig. 4. Follicular immune responses involving IL-21 leads to downregulation of CD19 in ASC.
a, b Gene Set Enrichment Analysis (GSEA) based on gene signatures from ex vivo-differentiated plasmablasts in presence of different cytokine combinations (data sets from Stephenson et al.). Briefly, naive B cells were cultured in differentiating conditions for 6 days after which different cytokines were added to the culture. After 12 or 24 h, cells were harvested and sequenced. Gene signatures were identified by comparing the different conditions and time points to 0 h. a Density plots of ASC (time points and vaccine protocols combined) with significant enrichment identified by GSEA of gene signatures from ex vivo-differentiated plasmablasts. b Density plots of BMPC with significant enrichment identified by GSEA of gene signatures from ex vivo-differentiated plasmablasts. Violin plots of the normalised enrichment score (NES) per BMPC cluster are depicted in Supplementary Fig. 6a. Statistical significance between NES scores is shown in Supplementary Data 1 (two-tailed Mann–Whitney U test). c, d T follicular helper cells (Tfh, CD19CD4+CD45RACXCR5++) from tonsils or T peripheral helper cells (Tph, CD19CD4+CD45RACXCR5) from BAL of sarcoidosis patients were co-cultured 1:1 with tonsillar memory B cells (CD19+CD4IgDCD38) for 7 days in presence of staphylococcal enterotoxin B (SEB). Where indicated, T-cell help was blocked with an anti-CD40L antibody and/or recombinant soluble IL-21R. c Histograms of CD19 expression by differentiated plasmablasts (see Supplementary Fig. 7). Two Tfh and two Tph donors were analysed. d Frequencies of CD19hi plasmablasts. Statistics were performed using an RM parametric one-way ANOVA followed by multiple testing according to Fischer’s LSD test. Source data are provided as a Source Data file.
Fig. 5
Fig. 5. Antigen-specific BMPC are sequentially recruited to both CD19high and CD19low BMPC compartments.
a Representative pseudocolour plots of intracellular double-positive SARS-CoV-2 RBD (left) or tetanus toxoid (TT, right) staining in CD38highCD138+CD14CD3 live singlet BMPC (gating strategy in Supplementary Fig. 8a). be Each symbol represents one donor/sample (see Supplementary Table 1). Filled symbols represent BMPC samples which were also analysed by single-cell sequencing (Fig. 1a). b Frequencies of RBD-specific and TT-specific BMPC within total BMPC. Horizontal lines indicate the median. Statistics were performed using the one-tailed Mann–Whitney U test. n = 20 BM samples. c Frequencies of CD19low cells within RBD-specific BMPC (red), TT-specific BMPC (blue) and total BMPC (black). Horizontal lines indicate the median. Statistics were performed using the Kruskal–Wallis tests with Dunn’s correction for multiple comparisons. n = 20 BM samples. d Frequencies of IgG+ (left) and IgA+ (right) cells within RBD-specific BMPC (red), TT-specific BMPC (blue) and total BMPC (black). Horizontal lines indicate the median. Statistics were performed using the Kruskal–Wallis tests with Dunn’s correction for multiple comparisons. n = 20 BM samples. e Correlation between the frequency of CD19low RBD-specific BMPC and days after 3rd vaccination against SARS-CoV-2. Statistics were performed using one-tailed Spearman’s correlations. n = 11 BM samples. Source data are provided as a Source Data file.

References

    1. Radbruch A, et al. Competence and competition: the challenge of becoming a long-lived plasma cell. Nat. Rev. Immunol. 2006;6:741–750. - PubMed
    1. Manz RA, Thiel A, Radbruch A. Lifetime of plasma cells in the bone marrow. Nature. 1997;388:133–134. - PubMed
    1. Slifka MK, Antia R, Whitmire JK, Ahmed R. Humoral immunity due to long-lived plasma cells. Immunity. 1998;8:363–372. - PubMed
    1. Turner JS, et al. SARS-CoV-2 infection induces long-lived bone marrow plasma cells in humans. Nature. 2021;595:421–425. - PubMed
    1. Kim W, et al. Germinal centre-driven maturation of B cell response to mRNA vaccination. Nature. 2022;604:141–145. - PMC - PubMed

MeSH terms