. 2024 May 16;15(1):4132.
doi: 10.1038/s41467-024-46965-7.

Differential SNARE chaperoning by Munc13-1 and Munc18-1 dictates fusion pore fate at the release site

Affiliations

Differential SNARE chaperoning by Munc13-1 and Munc18-1 dictates fusion pore fate at the release site

Bhavya R Bhaskar et al. Nat Commun. .

Abstract

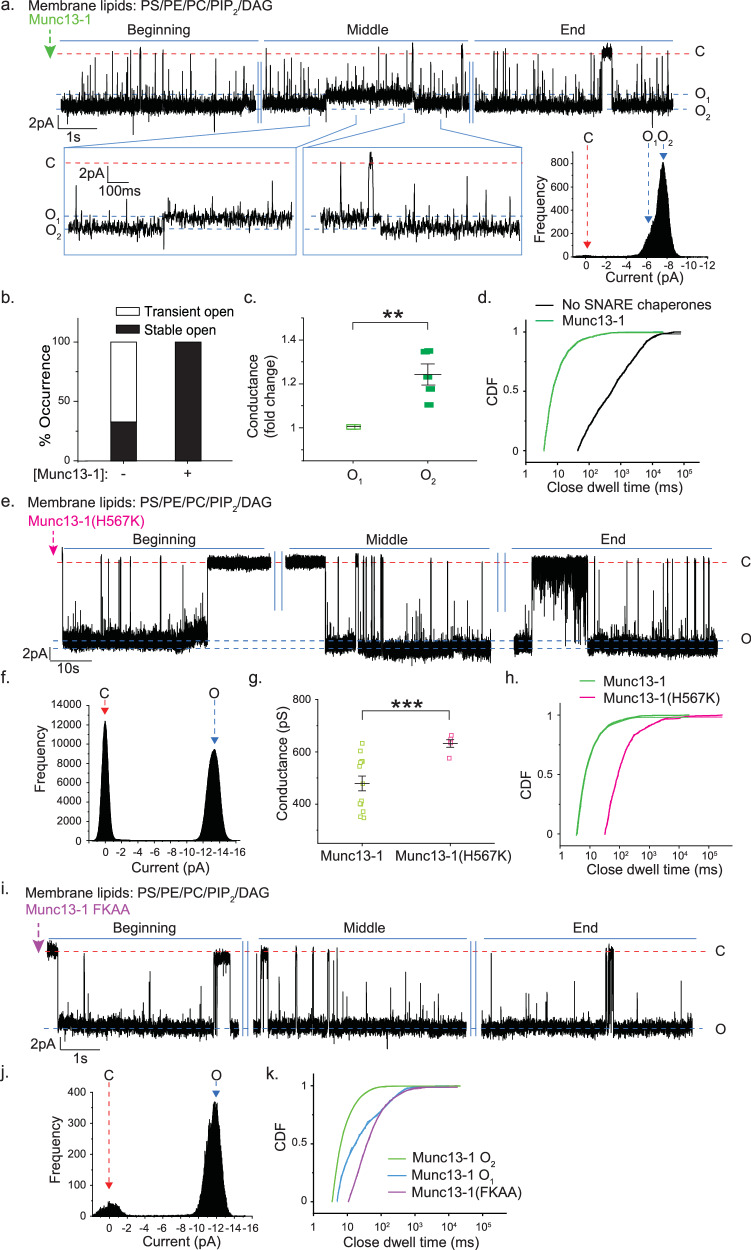
The regulated release of chemical messengers is crucial for cell-to-cell communication; abnormalities in which impact coordinated human body function. During vesicular secretion, multiple SNARE complexes assemble at the release site, leading to fusion pore opening. How membrane fusion regulators act on heterogeneous SNARE populations to assemble fusion pores in a timely and synchronized manner, is unknown. Here, we demonstrate the role of SNARE chaperones Munc13-1 and Munc18-1 in rescuing individual nascent fusion pores from their diacylglycerol lipid-mediated inhibitory states. At the onset of membrane fusion, Munc13-1 clusters multiple SNARE complexes at the release site and synchronizes release events, while Munc18-1 stoichiometrically interacts with trans-SNARE complexes to enhance N- to C-terminal zippering. When both Munc proteins are present simultaneously, they differentially access dynamic trans-SNARE complexes to regulate pore properties. Overall, Munc proteins' direct action on fusion pore assembly indicates their role in controlling quantal size during vesicular secretion.


Conflict of interest statement

The authors declare no competing interests.

Figures

Fig. 1
Fig. 1. SNAP-25B co-localizes with SNARE chaperones in a phorbol ester-dependent manner.
a Left panel, representative confocal image of primary cortical neurons that were triple labeled for synapsin (Alexa 647-conjugated secondary antibody), SNARE proteins (Alexa 555-conjugated secondary antibody: SNAP-25B (top), Syntaxin1a (middle), Syb2 (bottom) and Munc13-1 (Alexa 488-conjugated secondary antibody). The overlay image shows regions where Munc13-1 coincided with individual SNAREs, as indicated. Blue arrows: co-localization; while arrows: no co-localization. Right panel, representative confocal images of PMA treated primary cortical neuron, under indicated conditions. b The box plots showing Manders correlation co-efficients M1 (Munc13-1 co-localizing with individual SNAREs as indicated) and M2 (individual SNAREs’ co-localizing with Munc13-1); n = 6 (Munc13-1/SNAP-25B and Munc13-1/Syb2), n = 7 (Munc13-1/Syntaxin1a) individual neurons. p = 0.005 (Munc13-1/SNAP-25B; M1), 0.002 (Munc13-1/SNAP-25B; M2), 0.453 (Munc13-1/Syntaxin1a; M1), 0.113 (Munc13-1/Syntaxin1a; M2), 0.048 (Munc13-1/Syb2; M1), 0.48 (Munc13-1/Syb2; M2). c The representative confocal images of primary cortical neurons that were triple labeled as described in (a), for Munc18-1 (Alexa 488-conjugated secondary antibody), with and without treating the neurons with PMA. d The box plots showing Manders correlation co-efficients M1 (Munc18-1 co-localizing with individual SNAREs as indicated) and M2 (individual SNAREs’ co-localizing with Munc18-1); n = 5 (Munc18-1/Syntaxin1a and Munc18-1/Syb2), n = 5 (Munc18-1/SNAP-25B). p = 0.004 (Munc18-1/SNAP-25B; M1), 0.018 (Munc18-1/SNAP-25B; M2), 0.335 (Munc18-1/Syntaxin1a; M1), 0.387 (Munc18-1/Syntaxin1a; M2), 0.036 (Munc18-1/Syb2; M1), 0.016 (Munc18-1/Syb2; M2). The box plot minima and maxima represent the 25th and 75th percentiles, the lower and upper whiskers indicate the 5th and 95th percentiles, and the center line and square indicate median and mean, respectively; the Student’s t-test (one-tailed) was performed to compare the two means; *p  <  0.05, **p  <  0.01, n.s. non-significance. Scale bar in a and c indicates 5 μm. Relevant source data are provided as a Source Data file.
Fig. 2
Fig. 2. SNARE chaperones overcome the inhibitory effect of phorbol ester DAG during membrane fusion.
a Left, illustration for glutamate (glu) release assay. Middle, representative time course of glutamate released through the fusion pores in the absence (red) and presence (black) of PIP2/DAG lipids in t-SNARE liposomes. Right, box plots showing pooled results to indicate half maximum percent (%) of glu released for indicated conditions; p = 0.039. b Left, representative time course as shown in (a), in the absence and presence of SNARE chaperones (Munc13-1 (green) and Munc18-1(blue)) keeping membrane lipid composition for t-SNARE liposomes (PS/PE/PC/PIP2/DAG) fixed. Middle, box plots showing pooled results to indicate half maximum percent (%) of glu released for the indicated conditions; p = 0.024 (Munc13-1), 0.035 (Munc18-1). The box plot minima and maxima represent the 25th and 75th percentiles, the lower and upper whiskers indicate the 5th and 95th percentiles, and the center line and square indicate median and mean, respectively; n = 7 (for a) and n = 10 (for b) independent trials under each of the conditions mentioned; three independent sets of NDs were used. Student’s t-test (one-tailed) was performed to compare the two means; *p  <  0.05, n.s. non-significance. c Left, representative traces of single ND5S pores formed using the ND-BLM system. Three epochs (beginning, middle, and end) of the trace are shown. The membrane lipid composition of the BLMs is highlighted above the trace. Full closed (C) (red), partially open (P) (blue), and full open (O) (blue) states of the individual pores are indicated with respective currents. Right, current histograms of pores in the absence (top) and presence (bottom) of PIP2/DAG in BLM lipids. d Percent (%) occurrence of trials for which pores were stably or transiently open to their full open conductance states for indicated experimental conditions. e Open dwell time histograms of pores in the absence and presence of PIP2/DAG in BLM lipids are shown for each experimental condition. f Cumulative distribution functions (CDF) of closed dwell times for each experimental condition. n =  3 independent BLMs; three sets of NDs were used for each of the conditions. Relevant source data are provided in the Source Data file.
Fig. 3
Fig. 3. Munc13-1 directly alters nascent fusion pore properties.
a Top, representative trace shows the effect of Munc13-1 on an ND5S pore. The membrane lipid composition of the BLMs is mentioned. Closed (C) and multiple open states (O1/O2) are indicated with the respective currents. Bottom inset, current and time axes were magnified from the trace shown above. Bottom right, current histogram of the pore; closed (C) and open (O1/O2) states are indicated by red and blue arrows respectively. b Percent (%) occurrence of trials for which pores were stably open or transiently open to their full open conductance states for indicated experimental conditions are shown. c Scatter plots showing fold change in conductance of two open states of the pore, as observed in (a); n = 5 independent BLM recordings; p = 0.004. d CDF of closed state dwell times for indicated experimental conditions. e Representative trace of single ND5S pore triggered open by Munc13-1(H567K), as described in (a). Closed (C) and open states (O) are indicated with the respective currents. f Current histogram of the trace shown in (e), closed (C) and open (O) states are indicated by red and blue arrows, respectively. g Scatter plots show pooled data for pore conductance under indicated experimental conditions; n = 13 (for Munc13-1) and n = 5 (for Munc13-1(H567K)) single pore currents were analyzed; p = 0.0002. h CDF of closed state dwell times for indicated experimental conditions. i Representative trace of single ND5S pore triggered open by Munc13-1(FKAA) as described in (a). j Current histogram of the trace shown in (i), closed (C), and open (O) states are indicated by red and blue arrows, respectively. k CDF of closed state dwell times for indicated experimental conditions. n = 9 independent BLMs for (ad); three sets of NDs were used. n = 3 independent BLMs for (ek); two sets of NDs were used. Data are presented as mean ± SEM; Student’s t-test (one-tailed (for c) and two-tailed (for g)) was performed to compare the two means; **p < 0.01, ***p < 0.001, n.s. non-significance. Relevant source data are provided as a Source Data file.
Fig. 4
Fig. 4. Munc18-1 differentially alters fusion pore properties compared to Munc13-1.
a Representative trace for ND5S pore triggered open by ~1 µM Munc18-1. Three epochs (beginning, middle and end) of the trace are shown, membrane composition mentioned; closed (C) and open (O) states are indicated with the respective currents. b Current histogram of the trace shown in (a), closed (C), and open (O) states are marked by red and blue arrows, respectively. c Scatter plot shows a comparison of pore conductances between no SNARE chaperones (black), Munc13-1 (~0.3 µM) (green), and Munc18-1 (~1 µM) (orange) triggered pores; n = 4 (for no SNARE chaperones), n = 13 (for Munc13-1), n = 15 (for Munc18-1) single pores were analyzed; p = 0.0006 (No SNARE chaperones/Munc13-1), 0.0004 (No SNARE chaperones/Munc18-1), 0.005 (Munc13-1/Munc18-1). d Stacked column plots show amplitudes of fast and slow kinetic components (as indicated) for pore closures, derived from open dwell time CDFs exponential fit. These individual pores were triggered open by different [Munc18-1], as shown. e Representative trace of single ND5S pore triggered open by Munc18-1(D326K), BLM lipids used is mentioned. Three epochs (beginning, middle, and end) of the trace are shown, closed (C) and open states (O) are indicated with the respective currents. f Current histogram of the trace shown in (e), closed (C) and open (O) states are indicated by red and blue arrows, respectively. g Closed state dwell time CDFs of pores formed under indicated experimental conditions. n = 7 (for Munc18-1), n = 3 (for no SNARE chaperones and Munc18-1(D326K) independent BLMs; at least three sets of NDs were used for each experimental condition. Data are presented as mean ± SEM; Student’s t-test (two-tailed) was performed to compare the two means; **p <0.01, ***p < 0.001. Relevant source data are provided as a Source Data file.
Fig. 5
Fig. 5. Munc13-1 and Munc18-1 synchronize vesicular secretion by differentially organizing trans-SNARE assembly.
a Representative immunoblot showing trans-SNARE complexes with increasing [Munc13-1] (top, left) and [Munc18-1] (top, right). Fitted scatter plots showing fold change in band intensity for trans-SNARE complex formation as indicated. The hill coefficient (n) and EC50 (k) are indicated. t-SNARE liposomes lipids—PS/PE/PC/PIP2/DAG. b Scatter plot showing pooled data for hill coefficients (top—Munc13-1, bottom—Munc18-1) obtained from (a) using ND3s and ND5S; n = 4 (for ND3S/Munc13-1), n = 5 (for ND5S/Munc13-1), n = 3 (for ND3S/Munc18-1), n = 7 (for ND5S/Munc18-1) independent blots; p = 0.027 (Munc13-1), 0.403 (Munc18-1). c Scatter plot showing pooled data for hill coefficients (left—Munc13-1, right—Munc18-1) obtained from (a), as indicated; n = 3 (for ND5S/Munc13-1) and n = 4 (for ND5S/Munc18-1) independent blots for membrane lipid PS/PE/PC; p = 0.041 (Munc13-1), 0.347 (Munc18-1). d Left, representative time course of corrected Cy5 emission, as ND5Scy3N reacts with t-SNARE liposomecy5N as indicated. Right, scatter plot shows fold change in time at which FRET intensity is half of the maximum (T1/2) as indicated; n = 7 independent trials, p = 0.108 (Munc13-1), 0.421 (Munc18-1). e Left, representative time course of corrected Cy5 emission, as ND5Scy3C reacts with t-SNARE liposomecy5C as indicated. Right, scatter plot shows fold change in time at which FRET intensity is half of the maximum (T1/2) as indicated; n = 4 independent trials; p = 0.012 (Munc13-1), 0.011 (Munc18-1). f Model illustrates Munc13-1 mediated cooperative clustering of SNARE complexes, which synchronizes release events. g Fold change in the maximum glu release percent (average) (left) and the average time at which % glu released reaches the half-maximum (T1/2) (right), for ND3S, ND5S and ND7S, in the absence and presence of Munc13-1 or Munc18-1; n = 5 independent trials for each condition, three different ND preparations; p = 0.005 (ND5S/No SNARE chaperones), 0.356 (ND5S/Munc13-1), 0.276 (ND5S/Munc18-1), 0.017 (ND7S/No SNARE chaperones), 0.099 (ND7S/Munc13-1), 0.127685534 (ND7S/Munc18-1). Molecular weights (in kDa) are shown. Data presented as mean ± SEM; Student’s t-test (one-tailed) was performed to compare the ND5S or ND7S means with ND3S. *p < 0.05, **p  <  0.01, n.s. non-significance. Relevant source data are provided as a Source Data file.
Fig. 6
Fig. 6. Fusion pore fate is dictated by the sequential action of SNARE chaperones.
a Representative trace of single ND5S pore triggered open by Munc18-1 (orange), addition of Munc13-1(cyan) is indicated. Closed (C) and open (O) states; respective currents are indicated. b Current histogram of the pore shown in (a). Closed (C) and open (O) states are indicated by red and blue arrows, respectively. c Scatter plots show pooled data for pore conductance as indicated; p = 0.213. d CDF of closed dwell times as indicated. e Representative trace of single ND5S pore triggered open by Munc13-1 (green), the addition of Munc18-1 to that pore is indicated (brown). Closed (C) and multiple open states (O1/O2) of the individual pores are indicated. f Current histogram of the pore shown in (e). Closed (C) and open (O1/O2) states are indicated by red and blue arrows, respectively. g Scatter plots show pooled data for pore conductance as indicated; p = 0.172. h CDF of closed dwell times as indicated. i Representative trace of single ND5S pore triggered open by both Munc13-1 and Munc18-1. j Current histogram of the pore shown in (i). Closed (C) and open (O1/(O2) states are indicated by red and blue arrows, respectively. k Scatter plots show pooled data for pore conductance triggered open by either Munc13-1 (green) or Munc18-1 (orange) or both (blue); n = 13 (for Munc13-1), n = 15 (for Munc18-1) and n = 5 (for Munc13-1 + Munc18-1) single pores were analyzed; p = 0.02 (Munc13-1/Munc13-1 + Munc18-1), 0.002 (Munc13-1/Munc18-1), 0.141 (Munc18-1/Munc13-1 +  Munc18-1). l CDF of closed dwell times comparing indicated experimental conditions. m Model illustrating how Munc13-1 and Munc18-1 can differentially control the cargo release probabilities at the release site by altering the fusion pore size and kinetics. For ad, n  =  7 independent BLMs; three sets of NDs were used. For e–h, n  =  4 independent BLMs; two sets of NDs were used. For i–l, n  =  3 independent BLMs; two sets of NDs were used. Data are presented as mean ± SEM; Student’s t-test (one-tailed) was performed to compare the two means; n.s. non-significance. Relevant source data are provided in the Source Data file.
Fig. 7
Fig. 7. Model for Munc13-1/Munc18-1’s action on fusion pore.
Illustration shows the action of Munc13-1/Munc18-1 on dynamic trans-SNARE complexes to cooperatively cluster and synchronize fusion pore assembly at the release site.

References

    1. Melland H, Carr EM, Gordon SL. Disorders of synaptic vesicle fusion machinery. J. Neurochem. 2021;157:130–164. doi: 10.1111/jnc.15181. - DOI - PubMed
    1. Chandler DE, Heuser JE. Arrest of membrane fusion events in mast cells by quick-freezing. J. Cell Biol. 1980;86:666–674. doi: 10.1083/jcb.86.2.666. - DOI - PMC - PubMed
    1. Ornberg RL, Reese TS. Beginning of exocytosis captured by rapid-freezing of Limulus amebocytes. J. Cell Biol. 1981;90:40–54. doi: 10.1083/jcb.90.1.40. - DOI - PMC - PubMed
    1. Nakata T, Sobue K, Hirokawa N. Conformational change and localization of calpactin I complex involved in exocytosis as revealed by quick-freeze, deep-etch electron microscopy and immunocytochemistry. J. Cell Biol. 1990;110:13–25. doi: 10.1083/jcb.110.1.13. - DOI - PMC - PubMed
    1. Giraudo CG, et al. SNAREs can promote complete fusion and hemifusion as alternative outcomes. J. Cell Biol. 2005;170:249–260. doi: 10.1083/jcb.200501093. - DOI - PMC - PubMed

LinkOut - more resources