. 2024 May 16;15(1):4177.
doi: 10.1038/s41467-024-48556-y.

Sustained IFN signaling is associated with delayed development of SARS-CoV-2-specific immunity

Affiliations

Sustained IFN signaling is associated with delayed development of SARS-CoV-2-specific immunity

Elsa Brunet-Ratnasingham et al. Nat Commun. .

Abstract

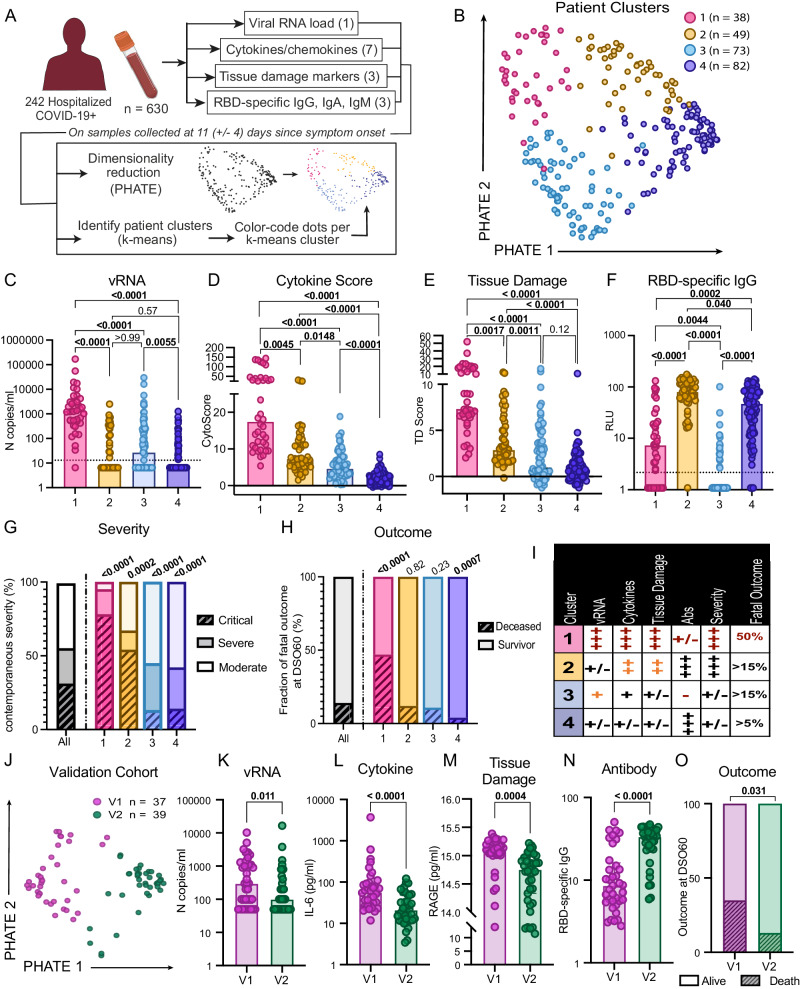
Plasma RNAemia, delayed antibody responses and inflammation predict COVID-19 outcomes, but the mechanisms underlying these immunovirological patterns are poorly understood. We profile 782 longitudinal plasma samples from 318 hospitalized patients with COVID-19. Integrated analysis using k-means reveals four patient clusters in a discovery cohort: mechanically ventilated critically-ill cases are subdivided into good prognosis and high-fatality clusters (reproduced in a validation cohort), while non-critical survivors segregate into high and low early antibody responders. Only the high-fatality cluster is enriched for transcriptomic signatures associated with COVID-19 severity, and each cluster has distinct RBD-specific antibody elicitation kinetics. Both critical and non-critical clusters with delayed antibody responses exhibit sustained IFN signatures, which negatively correlate with contemporaneous RBD-specific IgG levels and absolute SARS-CoV-2-specific B and CD4+ T cell frequencies. These data suggest that the "Interferon paradox" previously described in murine LCMV models is operative in COVID-19, with excessive IFN signaling delaying development of adaptive virus-specific immunity.


Conflict of interest statement

J.B.R. has served as an advisor to GlaxoSmithKline and Deerfield Capital. T.N. has received speaking fee from Boehringer Ingelheim for talks unrelated to this research. D.E.K. has served as an advisor to AstraZeneca. These agencies had no role in the design, implementation, or interpretation of this study. The authors declare that they have no other competing interests.

Figures

Fig. 1
Fig. 1. Hospitalized patients display four distinct endotypes of early plasma immunovirological profiles following SARS-CoV-2 infection.
A Study design. Serial blood samples were collected among hospitalized NSW PCR-confirmed COVID-19+ patients. Samples were assessed for plasma viral RNA, seven cytokines, three tissue damage markers, and three SARS-CoV-2 RBD-specific antibody isotypes. On samples collected 11 (+/−4) days after symptom onset (DSO11), all 14 parameters were combined for visualization by PHATE and used to calculate patient clusters by k-means. Patient cluster was then used to color-code PHATE embedding. B DSO11 samples identified four patient clusters across 242 hospitalized COVID-19+ patients. CF At DSO11, plasma concentration across four patient clusters of (C) viral RNA; (D) Cytokine Score obtained from the linear combination of all seven cytokines; (E) score of tissue damage obtained from the linear combination of all three markers of tissue damage, and (F) SARS-CoV-2 RBD-specific IgG. G, H Percentage of the whole cohort or per patient cluster (G) with critical (hashed), severe (saturated), or moderate (faint) disease; (H) with fatal outcome (hashed). I Summary table of four patient clusters in the discovery cohort. J Validation cohort of 76 hospitalized COVID-19+ patients. SARS-CoV-2-specific IgG, IgM and IgA, vRNA and cytokines and tissue damage markers were measured at DSO11. PHATE embedding and k-means clustering were performed as for the discovery cohort. KO Comparison, between validation cluster (V)1 and V2, of plasma levels of (K) SARS-CoV-2 vRNA; (L) IL-6; (M) RAGE or (N) N-specific IgG. O Outcome at DSO60 (hashed being fatal outcome). N discovery cohort: 1 = 38; 2 = 49; 3 = 73; 4 = 82 (242 in total). N validation cohort: V1 = 37; V2 = 39 (76 in total). CF Kruskal-Wallis with Dunn’s multiple comparison tests. Adjusted p values are shown. G, H Two-sided Fisher’s exact test compares the proportion of hashed groups in one cluster versus all others. For (G), statistical comparison is between critical and non-critical. KO Two-sided Mann-Whitney tests. Medians are shown in bar charts. Source data are provided as Source_Data_File.xlsx.
Fig. 2
Fig. 2. Delayed antibody kinetics is associated with protracted plasma vRNA over a wide range of disease severity.
A Sigmoidal curve fitted to the average per day per patient cluster of RBD-specific IgG responses. The center of the error bars (corresponding to the squares) represent coordinates where 50% of max IgG level is reached per cluster (DSO50%). The 95% confidence intervals (shaded area on graph) and P values (table at bottom right) were calculated using bootstrap comparison of DSO50%. Extrapolated DSO50% and 95% CI values are on the right of the graph. B Model of plasma vRNA detection, fitted to the average per day per patient cluster, among viremic patients only. Bootstrap on the area under the curve (AUC) was used to compare clusters, with p values provided in the table on the right of the graph. Faded dots represent raw data points per DSO. C Average trajectory per color-coded patient cluster when the PHATE embedding was performed using cytokines, tissue damage markers and DSO across all acute samples. Numbers in large circles represent the day of symptom onset at that coordinate. Shaded area represents confidence interval. Smaller circles in background are datapoints, color-coded by average analytes expression. A, C N = 630 data points. B 224 datapoints (only RNAemia+ participants were considered). A, B Two-stage bootstrap, with 1000 simulations. Pairwise comparison between all four clusters. C Bootstrapping at the patient level was used to visualize the confidence ellipses representing 3 standard deviations around the average. See material and methods for details. Source data are provided as Source_Data_File.xlsx.
Fig. 3
Fig. 3. Patients with delayed SARS-CoV-2-specific antibody responses display sustained IFN signaling.
A Principal component analysis (PCA) based on significant DEG (FDR < 0.01, n = 1346 genes) from all pairwise comparisons across the 4 patient clusters. Each dot represents a separate patient, sampled at DSO11, and color-coded to their respective cluster. B PCA on whole transcriptome (n = 10,236 genes) of patients in cluster 1 only at DSO11, color coded by survival or fatal outcome at DSO60. C Volcano plot of differentially expressed genes (DEG) based on outcome, with significant genes color-coded (FDR < 0.05; |logFC | > 0.5). Dashed lines represent the nominal p-values corresponding to an FDR = 0.05, and points with an FDR < 0.05 are highlighted in color. Mauve dots represent genes increased in fatal outcome, and pink, genes increased in survivors. Relevant genes are tagged. D, E Volcano plots of contrasts (D) 1 vs 2 or (E) 3 vs 4, with significant genes (FDR < 0.05; |logFC | > 0.5) color-coded and relevant genes tagged. F Single sample (ss)GSEA of published COVID-19 severity score across patient clusters. G GSEA using Hallmark dataset on t-statistics from aforementioned contrasts. Red dots are pathways enriched in the low antibody clusters 1 and 3 compared to 2 and 4, respectively, while blue dots are pathways enriched in high antibody clusters. Significant hits are colored. Size of the circle is representative of significance of enrichment. H ssGSEA IFN score calculated from the combination of the “interferon gamma response” and “interferon alpha response” Hallmark gene sets across patient clusters. I Correlation between IFN score and contemporaneous RBD-specific IgG levels at DSO11. J ssGSEA IFN score over time (DSO < 40) per patient cluster, with confidence intervals shaded. R and p values of each cluster are annotated at the bottom of the figure. N: 1 = 100; 2 = 93; 3 = 86, 4 = 98 (377 in total). C, D, E P-values were obtained from least squares linear regression models (two-tailed). False discovery rates were calculated using a permutation-based approach that derives the null empirically. F, H Kruskal-Wallis with Dunn’s multiple comparison tests. Adjusted p-values are shown. G fgsea p-values were calculated using a permutation-based approach. Multiple testing correction was performed using the Benjamini-Hochberg method. I, J Two-tailed Spearman correlations. Medians are shown in bar charts. Source data are provided as Source_Data_File.xlsx (ssGSEA scores), as well as in Supplementary Data 1, 2 and 3.
Fig. 4
Fig. 4. Elevated IFN signaling is negatively associated with RBD-specific B cell and plasmablast frequencies.
A Representative flow cytometry plots of RBD-specific B cells identified per patient cluster at DSO11. BF Correlation between (B) absolute counts of RBD-specific B cells and RBD-specific PB; (C) absolute counts of RBD-specific B cells and RBD-specific plasma IgG levels; (D) absolute counts of RBD-specific PB cells and RBD-specific plasma IgG levels; (E) absolute counts of RBD-specific B cells and ssGSEA IFN score; (B) absolute counts of RBD-specific PB cells and ssGSEA IFN score. G, H Per patient cluster, absolute counts of RBD-specific (G) B cells or (H) PB. n for cluster 1 = 14; 2 = 16; 3 = 12; 4 = 13. B, C, DF Two-tailed Spearman correlations. G, H Kruskal-Wallis with Dunn’s multiple comparison tests. Adjusted p-values are shown. For patients with undetectable RBD-specific B and/or PB counts, they were assigned value 0.1. Medians are shown in bar charts. Source data are provided as Source_Data_File.xlsx.
Fig. 5
Fig. 5. Elevated IFN signaling is negatively associated with Spike-specific CD4+ T cell responses.
A Representative flow cytometry gates used to detect Spike-specific CD4+ T cells following 15 h peptide stimulation. Boolean OR gating strategy used. BE Correlations between absolute counts of Spike-specific CD4+ T cells with (B) ssGSEA IFN score; (C) ssGSEA COVID-19 severity score; (D) absolute counts of RBD-specific B cells or (E) absolute counts of RBD-specific plasma cells. F Comparison of absolute counts of Spike-specific CD4+ T cells per patient cluster. G Representative flow cytometry gate used to detect Spike-specific CD8+ T cells following 15 h peptide stimulation. H, I Correlations between absolute counts of Spike-specific CD8+ T cells with (H) ssGSEA IFN score and (I) ssGSEA COVID-19 severity score. J Comparison of absolute counts of Spike-specific CD8+ T cells per patient cluster. K Correlation between the absolute counts of both Spike-specific T cell populations. n for cluster 1 = 11; 2 = 11; 3 = 9; 4 = 10. BE, H, I, K Two-tailed Spearman correlation. F, J Kruskal-Wallis with Dunn’s multiple comparison tests. Adjusted p-values are shown. Medians are shown in bar charts. Source data are provided as Source_Data_File.xlsx.

References

    1. Brunet-Ratnasingham, E. et al. Integrated immunovirological profiling validates plasma SARS-CoV-2 RNA as an early predictor of COVID-19 mortality. Sci. Adv.7, eabj5629 (2021). - PMC - PubMed
    1. Pujadas, E. et al. SARS-CoV-2 viral load predicts COVID-19 mortality. Lancet Respir. Med.8, e70 (2020). - PMC - PubMed
    1. Jarhult, J. D., Hultstrom, M., Bergqvist, A., Frithiof, R. & Lipcsey, M. The impact of viremia on organ failure, biomarkers and mortality in a Swedish cohort of critically ill COVID-19 patients. Sci. Rep.11, 7163 (2021). - PMC - PubMed
    1. R. C. Group. Baricitinib in patients admitted to hospital with COVID-19 (RECOVERY): a randomised, controlled, open-label, platform trial and updated meta-analysis. Lancet400, 359–368 (2022). - PMC - PubMed
    1. Rovito, R. et al. Association between SARS-CoV-2 RNAemia and dysregulated immune response in acutely ill hospitalized COVID-19 patients. Sci. Rep.12, 19658 (2022). - PMC - PubMed

MeSH terms

LinkOut - more resources