. 2024 May 16;15(1):4153.
doi: 10.1038/s41467-024-48524-6.

ADAM9 promotes type I interferon-mediated innate immunity during encephalomyocarditis virus infection

Affiliations

ADAM9 promotes type I interferon-mediated innate immunity during encephalomyocarditis virus infection

Lindsey E Bazzone et al. Nat Commun. .

Abstract

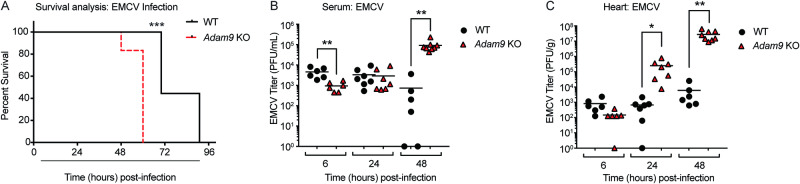
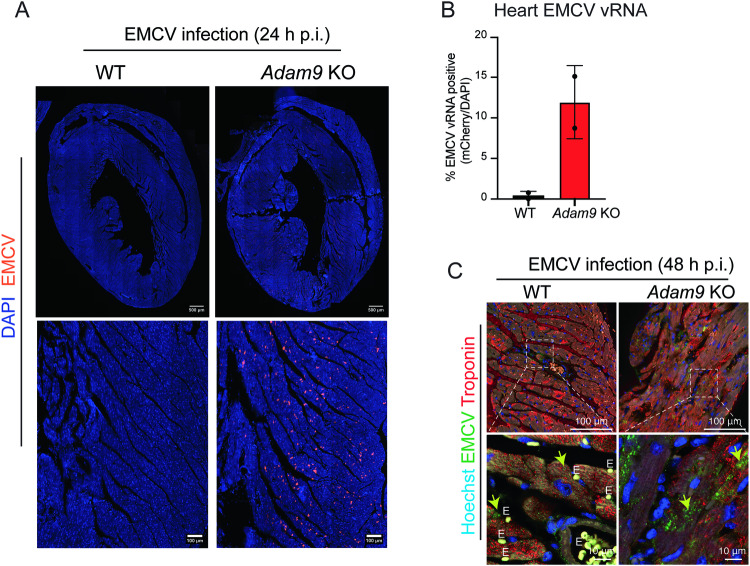
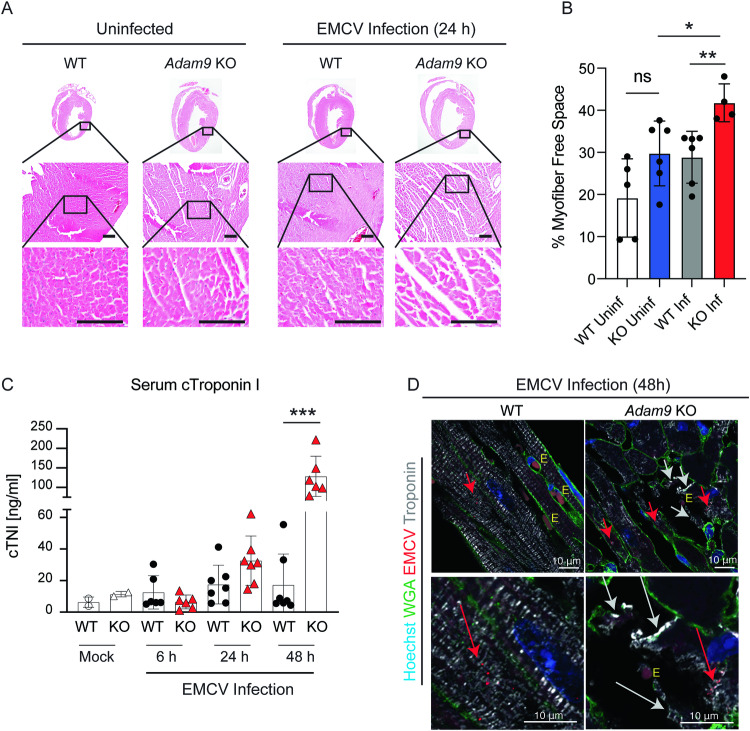
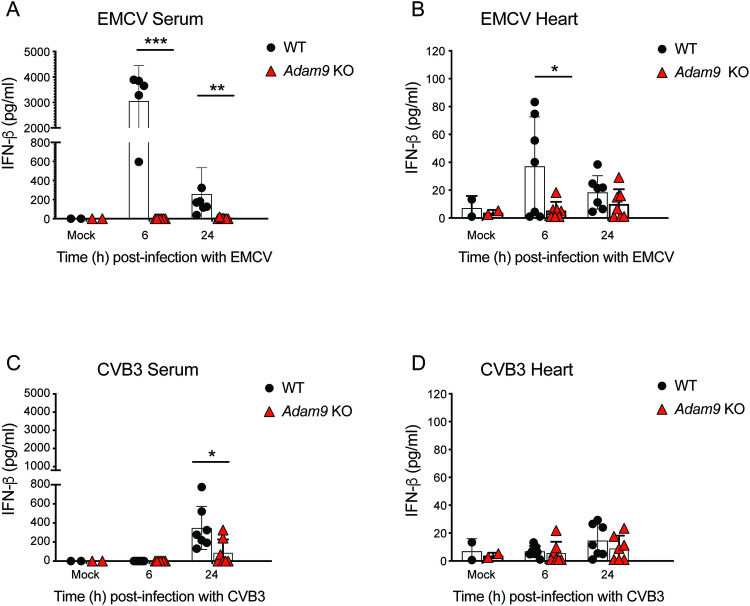
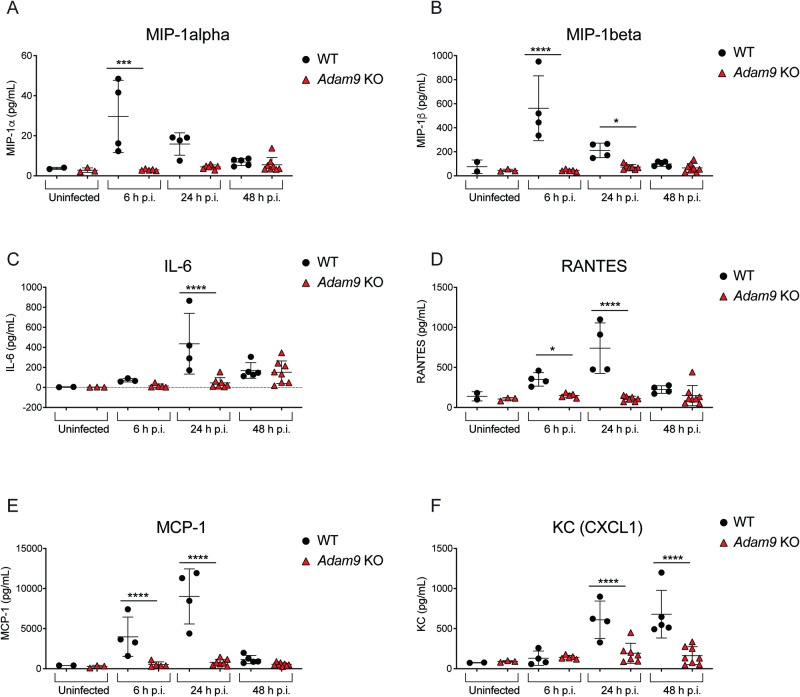
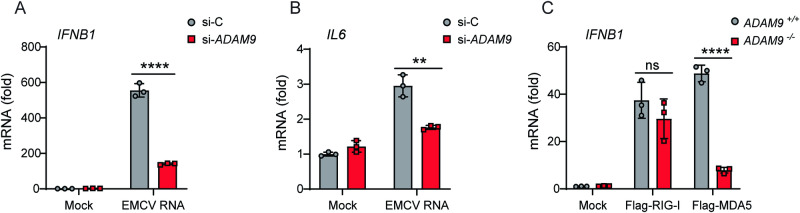
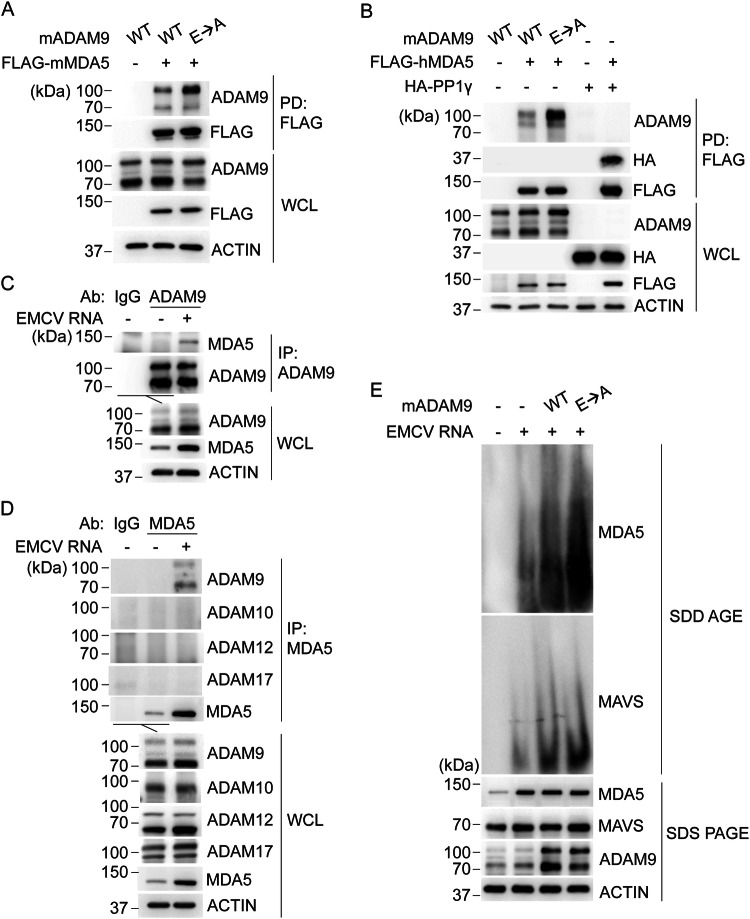
Viral myocarditis, an inflammatory disease of the heart, causes significant morbidity and mortality. Type I interferon (IFN)-mediated antiviral responses protect against myocarditis, but the mechanisms are poorly understood. We previously identified A Disintegrin And Metalloproteinase domain 9 (ADAM9) as an important factor in viral pathogenesis. ADAM9 is implicated in a range of human diseases, including inflammatory diseases; however, its role in viral infection is unknown. Here, we demonstrate that mice lacking ADAM9 are more susceptible to encephalomyocarditis virus (EMCV)-induced death and fail to mount a characteristic type I IFN response. This defect in type I IFN induction is specific to positive-sense, single-stranded RNA (+ ssRNA) viruses and involves melanoma differentiation-associated protein 5 (MDA5)-a key receptor for +ssRNA viruses. Mechanistically, ADAM9 binds to MDA5 and promotes its oligomerization and thereby downstream mitochondrial antiviral-signaling protein (MAVS) activation in response to EMCV RNA stimulation. Our findings identify a role for ADAM9 in the innate antiviral response, specifically MDA5-mediated IFN production, which protects against virus-induced cardiac damage, and provide a potential therapeutic target for treatment of viral myocarditis.


Conflict of interest statement

The authors declare no competing interests.

Figures

Fig. 1
Fig. 1. Adam9 KO mice are highly susceptible to EMCV infection of the heart.
A WT (n = 9) and Adam9 KO (n = 6) mice were infected by intraperitoneal (i.p.) injection of 105 PFU of EMCV and survival was assessed. Adam9 KO mice demonstrated accelerated mortality compared to WT mice in response to EMCV infection (***P = 0.0002, Mantel–Cox survival analysis). Survival data represents two independent experiments. WT and Adam9 KO mice were infected i.p. with 105 PFU of EMCV and EMCV titers were measured by plaque assay at 6, 24, and 48 h p.i. in serum (B) and hearts (C). B EMCV titers in the serum were delayed in Adam9 KO compared to WT mice at 6 h pi. (**P = 0.0064) but were higher in Adam9 KO compared to WT mice by 48 h p.i. (**P = 0.0027) by a two-tailed, unpaired t-test. C In addition, EMCV titers in the heart were also higher in Adam9 KO compared to WT mice at 24 h p.i. (*P = 0.0318) and 48 h p.i. (**P = 0.0046) by a two-tailed, unpaired t-test. B, C All data are representative of three independent experiments with similar results. Each symbol represents an individual mouse (n = 6 for 6 h p.i.; n = 7 for 24 h p.i.; n = 6 for WT and n = 8 for KO for 48 h p.i.), and small horizontal lines indicate the mean. Source data are provided in the Source Data file.
Fig. 2
Fig. 2. ADAM9 deficiency enhances viral infection of cardiac tissue.
A EMCV genomes in the hearts from WT and Adam9 KO mice visualized by RNAscopeTM. Representative images of hearts from WT (n = 2) or Adam9 KO (n = 2) mice 24 h after i.p. injection with 105 PFU of EMCV. Samples were fixed with 4% PFA, paraffin-embedded, and cut into 8-micron sections on regular slides. EMCV genomes in the tissues were detected by RNAscopeTM (following the Multiplex Fluorescent Reagent Kit v2 Assay from ACD) using an EMCV-specific RNAscopeTM probe-C2 mCherry that detects the EMCV genomes. Nuclei were stained with DAPI and visualized with fluorescence microscopy. Pixels = 325 nm × 325 nm. B Quantification of mCherry positive (EMCV vRNA) per DAPI positive nuclei in whole heart tissue scan from (A). Higher levels of EMCV genomes were detected throughout all regions of the heart in Adam9 KO hearts (11.92% mCherry positive foci per DAPI) compared to WT hearts (0.40% mCherry positive foci per DAPI). Bar graphs represent the mean ±SD of mCherry positive DAPI+ nuclei. Number of DAPI+ nuclei analyzed per condition: WT + EMCV, n = 156532; Adam9 KO + EMCV, n = 118895. C Immunohistochemical detection of EMCV (green) and troponin (red) in WT and Adam9 KO hearts 48 h p.i. with 105 PFU of EMCV. EMCV-infected cardiomyocytes (arrows). Nuclei stained with Hoechst (blue). Erythrocytes marked “E.” Source data are provided in the Source Data file.
Fig. 3
Fig. 3. EMCV infection of Adam9 KO mice induces severe myocardial damage.
A Representative images of hematoxylin and eosin (H&E)-stained heart sections from WT and Adam9 KO mice uninfected or infected i.p. with 105 PFU of EMCV. Scale bar = 100 μm. B Infected Adam9 KO mice (n = 4) exhibit a significant increase in extracellular space between myofibers compared to uninfected Adam9 KO mice (n = 6) (*P = 0.0238) and infected WT mice (n = 6) (**P = 0.0074), two-tailed, unpaired t-test. Error bars represent mean ± SD. Extracellular space was quantified by creating a binary image from each H&E image (n = 4–6 fields per genotype) at 20× magnification and manually outlining each myofiber. The percentage of white pixels (extracellular space) was calculated from an inverted binary image within each myofiber region of interest and averaged to calculate an average percentage of myofiber-free space per condition (6–12 myofibers per condition). Note: Uninfected Adam9 KO mice and EMCV-infected WT mice each exhibit a trend towards increased intramyofiber spacing compared to uninfected WT mice (n = 5), but (unlike the infected Adam9 KO mice) these changes are statistically not significant (ns) (P = 0.0686; two-tailed, unpaired t-test). C WT and Adam9 KO mice were mock-infected or infected i.p. with 105 PFU of EMCV per mouse, and serum levels of cardiac troponin I (cTNI) were measured by ELISA at 6, 24, and 48 h p.i. Each symbol represents an individual mouse (mock-infected n = 2 mice each for WT and Adam9 KO mice; infected WT and Adam9 KO mice: n = 6 for 6 h p.i. and n = 7 for 24 h p.i. for both WT and Adam9 KO mice; n = 7 WT mice and n = 6 Adam9 KO mice for 48 h p.i.). Bar graphs indicate the mean ±SD, ***P = 0.0002 (two-tailed, unpaired t-test). D Representative confocal immunofluorescence imaging of heart tissue from WT mice and Adam9 KO mice 48 h p.i. with 105 PFU of EMCV (red) showing EMCV-infected cardiomyocytes (red arrows) and defective sarcomeric structures (white arrows) with troponin (white) leakage from damaged cardiomyocytes in Adam9 KO but not WT hearts. Wheat germ agglutinin (WGA, green), Hoechst (cell nuclei, blue). Erythrocytes marked “E.” Source data are provided in the Source Data file.
Fig. 4
Fig. 4. ADAM9 is required for the IFN-β response to EMCV and Coxsackievirus infection in vivo.
AD WT and Adam9 KO mice were mock-infected or infected i.p. with 105 PFU of EMCV or 105 PFU of coxsackievirus B3 (CVB3). Serum and hearts from infected mice were collected at 6 and 24 h p.i., and IFN-β production was measured by ELISA. IFN-β levels in A serum of mock- (n = 2) versus EMCV-infected WT (n = 5 for 6 h p.i. and n = 6 for 24 h p.i.) and Adam9 KO (n = 7 for 6 h p.i. and n = 7 for 24 h p.i.) mice and B hearts of mock- (n = 2) versus EMCV-infected (n = 7 for 6 h p.i. and 24 h p.i.) WT and Adam9 KO mice. IFN-β levels in C serum and D hearts of mock- (n = 2) versus CVB3-infected (n = 7 at 6 h p.i. and 24 h p.i.) WT and Adam9 KO mice. Each symbol represents an individual mouse; vertical bars indicate the mean ± SD. A ***P = 0.0001, **P = 0.0011; B *P = 0.0390; C *P = 0.0241 (two-tailed, unpaired t-test). All data are representative of at least three independent experiments with similar results. Source data are provided in the Source Data file.
Fig. 5
Fig. 5. ADAM9 is essential for the innate immune response to EMCV infection in vivo.
WT mice (n = 2 for uninfected; n = 4 for 6 h p.i., except n = 3 for IL-6; n = 4 for 24 h p.i.; n = 5 for 48 h p.i., except n = 4 for RANTES) and Adam9 KO mice (n = 3 for uninfected; n = 5 for 6 h p.i.; n = 7 for 24 h p.i.; n = 8 for 48 h p.i.) were infected i.p. with 105 PFU of EMCV, and serum was collected at 6, 24, and 48 h p.i. Serum cytokine levels were measured by Luminex multiplex analysis with each sample run in duplicate. Each symbol represents an individual mouse; small horizontal lines indicate the mean ± SD. Two-way ANOVA with Tukey’s multiple comparisons test was used to determine statistical significance; A ***P = 0.0002; B *P = 0.0418, ****P < 0.0001; C ****P < 0.0001; D *P = 0.0101, ****P < 0.0001; E ****P < 0.0001; F ****P < 0.0001. Source data are provided in the Source Data file.
Fig. 6
Fig. 6. ADAM9 is required for the innate immune response to EMCV vRNA.
AC WT and Adam9 KO primary lung fibroblasts were transfected with 0.1, 1, or 10 ng of EMCV vRNA or mock-transfected (using lipofectamine only, Lipo, as a control), and 24 h later, EMCV titers in the supernatant were determined by plaque assay (A) and IFN-β (B) or IL-6 (C) measured by ELISA. D IFN-β produced by WT and Adam9 KO lung fibroblasts infected with different levels of Sendai virus (SeV) as measured using hemagglutinin (HA) units for 24 h, measured by ELISA. E Ifnb1 mRNA in WT and Adam9 KO mouse lung fibroblasts  transfected with the RIG-I ligand RABV-Le RNA. F IFN-β levels from VSV vRNA-transfected lung fibroblasts, measured by ELISA. G IFN-β levels measured in supernatants from WT, Adam9 KO, and ADAM9-rescued fibroblasts at 24 h post-transfection with EMCV vRNA, determined by ELISA. In AD and F one representative experiment of three independent experiments with n = 2 in each group is shown. In E and G data are representative of two independent experiments with n = 3 (E) or n = 2 (G) in each group. Error bars show mean ± SD. In B, C, and G P values were determined by two-way ANOVA with Tukey’s multiple comparisons test; ****P < 0.0001; statistically not significant, ns, P = 0.8954, ***P = 0.0005, ****P < 0.0001; **P = 0.0023, ****P < 0.0001. Source data are provided in the Source Data file.
Fig. 7
Fig. 7. ADAM9 mediates MDA5-induced IFN-β and IL-6 responses to EMCV RNA.
A, B Primary normal human lung fibroblasts (NHLFs) were transfected with non-targeting control siRNA (si-C) or ADAM9-specific siRNA (si-ADAM9) for 30 h and then transfected with EMCV RNA (100 ng ml−1) for 8 h. RT-qPCR analysis of IFNB1 (A) and IL-6 (B) transcripts in control and ADAM9-silenced cells. C RT-qPCR analysis of IFNB1 transcripts in ADAM9+/+ and ADAM9–/– HeLa cells that were transfected with vector (mock), FLAG-hRIG-I, or FLAG-hMDA5 for 24 h. Data are representative of two independent experiments. Error bars are mean ± SD of n = 3 replicates. ****P < 0.0001; **P = 0.003; ns (P = 0.2997), statistically not significant, (two-tailed, unpaired t-test). Source data are provided in the Source Data file.
Fig. 8
Fig. 8. ADAM9 binds MDA5 promoting MDA5 oligomerization and downstream MAVS activation.
A Binding of FLAG-tagged murine MDA5 (FLAG-mMDA5) to murine ADAM9 (mADAM9) WT or catalytically inactive mutant (E→A) that were co-expressed for 24 h in HEK293T cells, determined by FLAG pull-down (PD: FLAG) and IB with the indicated antibodies. B Binding of FLAG-tagged human MDA5 (FLAG-hMDA5) to mADAM9 WT or E→A mutant, or HA-PP1γ (positive control), that were co-expressed for 24 h in HEK293T cells, determined by PD:FLAG and IB with the indicated antibodies. C Binding of endogenous ADAM9 to MDA5 in LFs that were either mock-treated or transfected with EMCV RNA (400 ng ml−1) for 16 h, determined by IP with anti-ADAM9 (or an IgG isotype control) and IB with the indicated antibodies. D Binding of endogenous ADAM9, ADAM10, ADAM12, or ADAM17 to MDA5 in LFs that were either mock-treated or transfected with EMCV RNA (400 ng ml−1) for 16 h, determined by IP with anti-MDA5 (or an IgG isotype control) and IB with the indicated antibodies. E Endogenous MDA5 oligomerization and MAVS aggregation in Hepa1-6 cells transfected for 24 h with vector or mADAM9 WT or E→A and then transfected for 16 h with EMCV RNA (400 ng ml−1), assessed by SDD-AGE and IB with anti-MDA5 and anti-MAVS. Whole cell lysates were further analyzed by SDS-PAGE and probed by IB with the indicated antibodies. Data are representative of at least two independent experiments. Source data are provided in the Source Data file.

References

    1. Carocci M, Bakkali-Kassimi L. The encephalomyocarditis virus. Virulence. 2012;3:351–367. doi: 10.4161/viru.20573. - DOI - PMC - PubMed
    1. Matsumori A, et al. Mechanism and significance of myocardial uptake of antimyosin antibody in myocarditis and cardiomyopathy: clinical and experimental studies. Clin. Immunol. Immunopathol. 1993;68:215–219. doi: 10.1006/clin.1993.1121. - DOI - PubMed
    1. Rehwinkel J, Gack MU. RIG-I-like receptors: their regulation and roles in RNA sensing. Nat. Rev. Immunol. 2020;20:537–551. doi: 10.1038/s41577-020-0288-3. - DOI - PMC - PubMed
    1. Gitlin L, et al. Essential role of mda-5 in type I IFN responses to polyriboinosinic:polyribocytidylic acid and encephalomyocarditis picornavirus. Proc. Natl Acad. Sci. USA. 2006;103:8459–8464. doi: 10.1073/pnas.0603082103. - DOI - PMC - PubMed
    1. Wang JP, et al. MDA5 and MAVS mediate type I interferon responses to coxsackie B virus. J. Virol. 2010;84:254–260. doi: 10.1128/JVI.00631-09. - DOI - PMC - PubMed

MeSH terms