. 2024 Jul;43(14):2843-2861.
doi: 10.1038/s44318-024-00113-5. Epub 2024 May 16.

Early-stage lung cancer is driven by a transitional cell state dependent on a KRAS-ITGA3-SRC axis

Affiliations

Early-stage lung cancer is driven by a transitional cell state dependent on a KRAS-ITGA3-SRC axis

Aaron L Moye et al. EMBO J. 2024 Jul.

Abstract

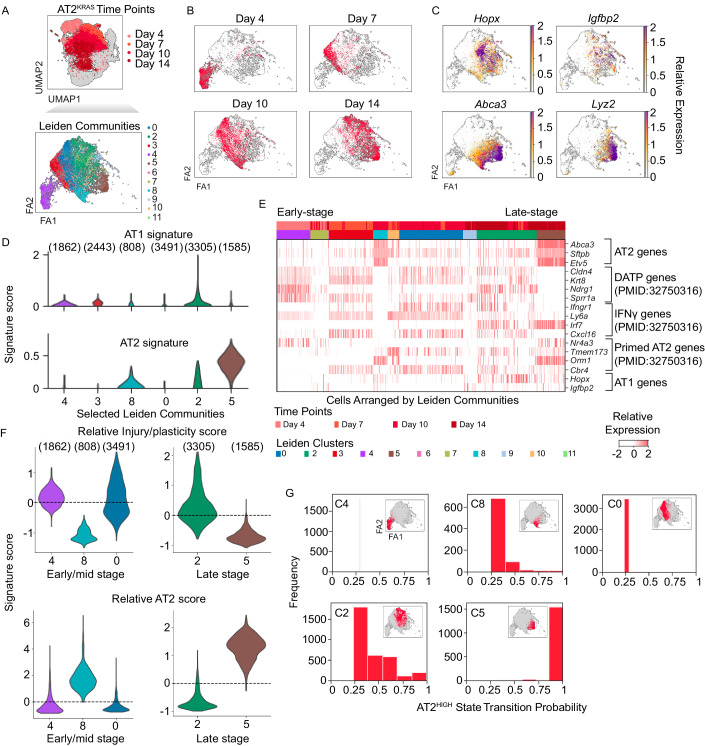
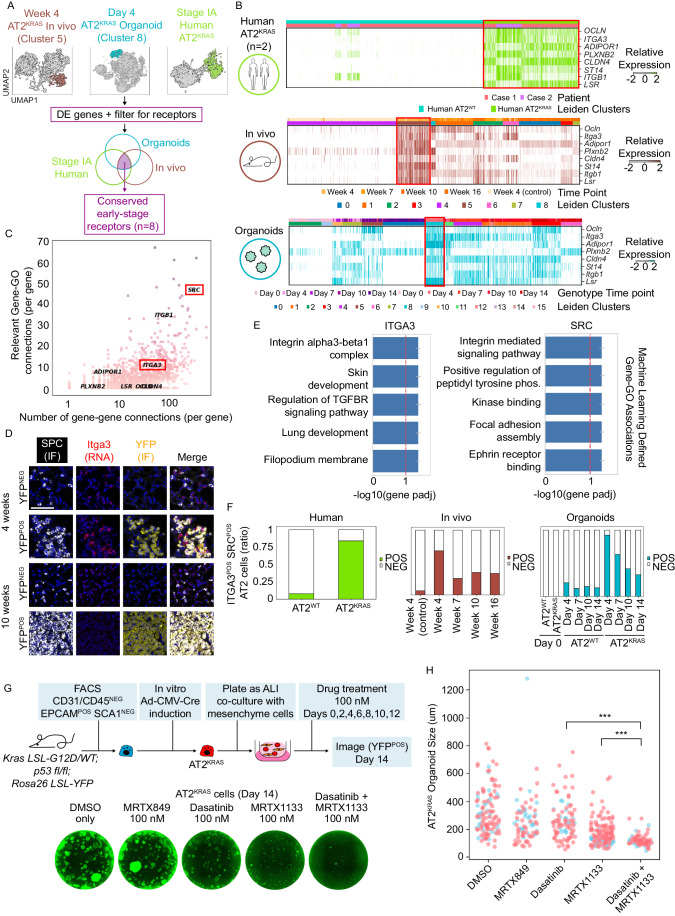
Glycine-12 mutations in the GTPase KRAS (KRASG12) are an initiating event for development of lung adenocarcinoma (LUAD). KRASG12 mutations promote cell-intrinsic rewiring of alveolar type-II progenitor (AT2) cells, but to what extent such changes interplay with lung homeostasis and cell fate pathways is unclear. Here, we generated single-cell RNA-seq (scRNA-seq) profiles from AT2-mesenchyme organoid co-cultures, mice, and stage-IA LUAD patients, identifying conserved regulators of AT2 transcriptional dynamics and defining the impact of KRASG12D mutation with temporal resolution. In AT2WT organoids, we found a transient injury/plasticity state preceding AT2 self-renewal and AT1 differentiation. Early-stage AT2KRAS cells exhibited perturbed gene expression dynamics, most notably retention of the injury/plasticity state. The injury state in AT2KRAS cells of patients, mice, and organoids was distinguishable from AT2WT states via altered receptor expression, including co-expression of ITGA3 and SRC. The combination of clinically relevant KRASG12D and SRC inhibitors impaired AT2KRAS organoid growth. Together, our data show that an injury/plasticity state essential for lung repair is co-opted during AT2 self-renewal and LUAD initiation, suggesting that early-stage LUAD may be susceptible to interventions that target specifically the oncogenic nature of this cell state.

Keywords: AT2; Adenocarcinoma; Cell States; KRAS; Lung.


Figures

Figure 1
Figure 1. Lung AT2 progenitors activate a transient injury/plasticity state prior to both AT2 self-renewal and AT1 differentiation.
(A) Schematic representation of the AT2-mesenchyme organoid co-culture time course experiment. (B) Heatmap of gene expression in organoid time course data relevant to AT2, AT1, development, stem cell, and injury response states. “No induction” are primary AT2 cells collected from each mouse genotype (Y and KPY) prior to viral induction or culturing as organoids. (C) FA2 representation of filtered single cells subset from AT2WT organoid data and their corresponding Leiden community. The FA2 in Fig. 1C is reused in Figs. 1D, E, 4A, EV1D, EV2D, and EV5A to show different aspects of the data. (D) FA2 representation of filtered single cells subset from AT2WT organoid data and their corresponding time point. (E) FA2 representations of filtered single cells subset from AT2WT organoid data and the relative expression of either AT1 or AT2 specific genes. (F) AT2 and AT1 signature score level per community using a violin plot (y-axis, signature score; x-axis, Leiden community). (n) denotes the number of cells per cluster. (G) Heatmap of relative gene expression in the AT2WT organoid time course data relevant to AT2, AT1, and injury response gene expression signatures. Cells are arranged with C3 (Day 4 AT2WT organoids) in the middle, left is the AT1 fate path, and right is the AT2 fate path. (H) Transition probabilities of cells in selected AT2WT Leiden communities (x-axis; labeled transition probability, y-axis; binned frequency of occurrence). Inset highlights the cell states whose probabilities are being represented using a FA2 representation.
Figure 2
Figure 2. KrasG12D promotes distinct temporal subpopulations defined by AT2-lineage and injury/plasticity signatures.
(A) FA2 representation of filtered single cells subset from AT2KRAS organoid data and their corresponding Leiden community. The FA2 in Fig. 2A is reused in Figs. 2B, C, G and EV1D to show different aspects of the data. (B) FA2 representation of filtered single cells subset from AT2KRAS organoid data and their corresponding time point. (C) FA2 representations of filtered single cells subset from AT2KRAS organoid data and the relative expression of either AT1 or AT2 specific genes. (D) AT2 and AT1 signature score level per community using a violin plot (y-axis, signature score; x-axis, Leiden community). (n) denotes the number of cells per cluster. (E) Heatmap of relative gene expression in the AT2KRAS organoid time course data relevant to AT2, AT1, and injury response gene expression signatures. Cells are arranged by time point contributions in each Leiden community; early (left), late (right). (F) Relative injury/plasticity and AT2 signature score level per community using a violin plot (y-axis, signature score; x-axis, Leiden community). (n) denotes the number of cells per cluster. (G) Transition probabilities of cells in selected AT2KRAS Leiden communities (x-axis; labeled transition probability, y-axis; binned frequency of occurrence). Inset highlights the cell states whose probabilities are being represented using a FA2 representation.
Figure 3
Figure 3. AT2KRAS states are temporally conserved in vivo and in stage IA human LUAD.
(A) Schematic representation of the in vivo time course experiment. YFP-stained representations from each time point are shown. Scale bar = 100 μm. (B) UMAP representation of filtered single cells from the in vivo experiment, their corresponding time point, and Leiden communities. The UMAP in Fig. 3B is reused in Fig. 4A to show a different aspect of the data. (C) Heatmap of relative gene expression in the in vivo time course data relevant to AT2, AT1, and injury response gene expression signatures. Cells are arranged by time point contributions in each Leiden community; early (left), late (right). (D) Relative injury/plasticity and AT2 signature score level per community using a violin plot (y-axis, signature score; x-axis, Leiden community). (n) denotes the number of cells per cluster. (E) UMAP representation of filtered single cells from previously published stage IA LUAD patients data (Dost et al, 2020) and their corresponding Leiden community (this paper). (F) Heatmap of relative gene expression in human stage IA AT2WT and AT2KRAS cells relevant to AT2, AT1, and injury response gene expression signatures. Cells are arranged by Leiden community. (G) Proposed model for AT2WT and AT2KRAS transcriptional cell states over time conserved in murine organoids and in vivo. A conserved injury/plasticity state precedes both AT2 self-renewal and AT1 differentiation, which is co-opted by oncogenic KRAS to drive LUAD initiation, heterogeneity, and progression. Importantly, the cell states have distinct transcriptomes in each time point and condition (represented by different colors). Source data are available online for this figure.
Figure 4
Figure 4. A KRAS–ITGA3–SRC axis drives the earliest stages of LUAD initiation.
(A) Analysis design to identify early-stage AT2KRAS receptors conserved across species and model system examined in this study. (B) Relative expression of identified receptors in the AT2 organoids, in vivo, and human patient data, using a heatmap (x-axis; Leiden communities arranged by time point contributions, y-axis; conserved receptors). (C) Interconnections between DE genes in early-stage AT2KRAS organoids identified using machine learning, represented as a dot plot (x-axis; number of gene–gene connections, y-axis; number of gene-GO term connections). Genes selected for further study are highlighted with red boxes. (D) RNAScope analysis in 4-week and 10-week murine lung section following in vivo induction with Ad5SPC-Cre. Scale bar = 100 μm. (E) Bar plot of context-relevant GO terms associated with Itga3 and Src in early-stage AT2KRAS organoids, identified using machine learning. GO terms are arranged by statistical significance. GeneWalk methodology, error, and statistical methods are described in (Ietswaart et al, 2021). (F) Bar plot representing the percentage of Itga3POS SrcPOS cells in each Leiden community in the AT2 organoid, in vivo, and human patient datasets. (G) Experimental design of AT2KRAS organoid co-cultures treated with DMSO (vehicle), MRTX849, MRTX1133, Dasatinib, or MRTX1133/Dasatinib combination, and representative images of D14 AT2KRAS organoids from each treatment group. (H) Quantitation of Day 14 AT2KRAS organoid size (diameter, μm) in each treatment group; A total of 80–137 organoids were measured from two independent experiments, represented as blue and red circles in the graph. ***p < 0.001. DMSO vs. all conditions were statistically significant p < 0.05 (not represented on the graph). Statistical significance was determined using a Wilcoxon Rank-Sum Test. Source data are available online for this figure.
Figure EV1
Figure EV1. Generation and initial characterization of the AT2-mesenchyme organoid co-culture scRNA-seq dataset.
(A) Representative FACS plot for AT2-mesenchyme co-culture time course for scRNA-seq analysis. (B) Correlation between Sftpc and Lyz2 expression in individual organoid co-culture cells, after different levels of data diffusion (t) (van Dijk et al, 2018). (C) UMAP representation of filtered single cells from organoid co-cultures before subsetting, their corresponding population of origin, and Epcam or Vim expression. (D) UMAP representations of filtered single cells from organoid co-cultures and their corresponding population of origin, genotype, and time point. (E) Heatmap of the top 10 differentially expressed transcription factors in AT2 cells based on genotype and time point.
Figure EV2
Figure EV2. Additional characterization of the AT2WT organoid scRNA-seq dataset.
(A) Bar plot representing time point contributions in each Leiden community in the AT2WT organoid scRNA-seq data, represented as a ratio. Leiden communities consisting primarily of Day 0 AT2 cells were excluded from the barplot. (B) Relative expression of AT2 genes Etv5 and Lyz2 per community using a violin plot (y-axis, Leiden community; x-axis, relative expression). (n) denotes the number of cells per cluster. (C) Relative expression of AT1 genes Pdpn and Ager per community using a violin plot (y-axis, Leiden community; x-axis, relative expression). (D) FA2 representations of filtered single cells subset from AT2WT organoid data and the relative expression of either Tead1 or Wwtr1. (E) Bar plot representing time point contributions to AT2WT organoid intermediates C5 (AT1 fate) and C7 (AT2 fate). (F) Relative expression of the top 25 DE TFs in C5 and C7 AT2WT intermediate states using a dot plot (x-axis; DE genes, y-axis; Leiden community).
Figure EV3
Figure EV3. Additional characterization of the AT2KRAS organoid scRNA-seq dataset.
(A) Barplot representing time point contributions in each Leiden community in the AT2KRAS organoid scRNA-seq data, represented as a ratio. (B) Relative Sox9 expression in select early-, mid-, and late-stage communities using a violin plot (y-axis, relative Sox9 expression; x-axis, Leiden community). (n) denotes the number of cells per cluster.
Figure EV4
Figure EV4. Additional characterization of the in vivo and stage IA human scRNA-seq datasets.
(A) Representative FACS plot for in vivo time course for scRNA-seq experiment. (B) Correlation between Sftpc and Lyz2 expression in vivo, in individual AT2 cells after different levels of data diffusion (t) (van Dijk et al, 2018). (C) Heatmap of gene expression in the in vivo time course data relevant to AT2, AT1, development, stem cell, and injury response gene expression signatures. (D) Bar plot representing time point contributions in each Leiden community in the in vivo scRNA-seq data, represented as a ratio. (E) Correlation between SFTPD and SFTPB expression in individual stage IA human cells after different levels of data diffusion (t) (van Dijk et al, 2018). (F) Bar plot representing patient and sample type batch contributions for each Leiden community in the human scRNA-seq data, represented as a ratio. (G) Heatmap of gene expression in human data relevant to different lung lineages and development.
Figure EV5
Figure EV5. Additional analysis related to Fig. 4.
(A) UMAP representation of Leiden communities in the combined AT2 organoid data. Bar plot representing time point contributions for each Leiden community, represented as a ratio. (B) Relative Itga3 expression in AT2KRAS organoids (top) and in vivo (bottom) Leiden communities using a violin plot, subset into early-/mid- and late-stage time points (y-axis, relative Itga3 expression; x-axis, Leiden community). (C) Correlation between Src and Itga3 relative expression at various time points in AT2 organoids, represented as a scatterplot. Each point represents a single cell.

References

    1. Alonso-Curbelo D, Ho Y-J, Burdziak C, Maag JLV, Morris JP, 4th, Chandwani R, Chen H-A, Tsanov KM, Barriga FM, Luan W, et al. A gene-environment-induced epigenetic program initiates tumorigenesis. Nature. 2021;590:642–648. doi: 10.1038/s41586-020-03147-x. - DOI - PMC - PubMed
    1. Burdziak C, Alonso-Curbelo D, Walle T, Reyes J, Barriga FM, Haviv D, Xie Y, Zhao Z, Zhao CJ, Chen H-A, et al. Epigenetic plasticity cooperates with cell-cell interactions to direct pancreatic tumorigenesis. Science. 2023;380:eadd5327. doi: 10.1126/science.add5327. - DOI - PMC - PubMed
    1. Burgess CL, Huang J, Bawa PS, Alysandratos K-D, Minakin K, Ayers LJ, Morley MP, Babu A, Villacorta-Martin C, Yampolskaya M et al (2024) Generation of human alveolar epithelial type I cells from pluripotent stem cells. Cell Stem Cell 31:657–675.e8 - PMC - PubMed
    1. Cancer Genome Atlas Research Network Comprehensive molecular profiling of lung adenocarcinoma. Nature. 2014;511:543–550. doi: 10.1038/nature13385. - DOI - PMC - PubMed
    1. Choi J, Park J-E, Tsagkogeorga G, Yanagita M, Koo B-K, Han N, Lee J-H. Inflammatory signals induce AT2 cell-derived damage-associated transient progenitors that mediate alveolar regeneration. Cell Stem Cell. 2020;27:366.e7–382.e7. doi: 10.1016/j.stem.2020.06.020. - DOI - PMC - PubMed