

Grazing exclusion is more effective for vegetation restoration and nutrient transfer in the heavily degraded desert steppe
- PMID: 38755583
- PMCID: PMC11100239
- DOI: 10.1186/s12870-024-05127-z
Grazing exclusion is more effective for vegetation restoration and nutrient transfer in the heavily degraded desert steppe
Abstract
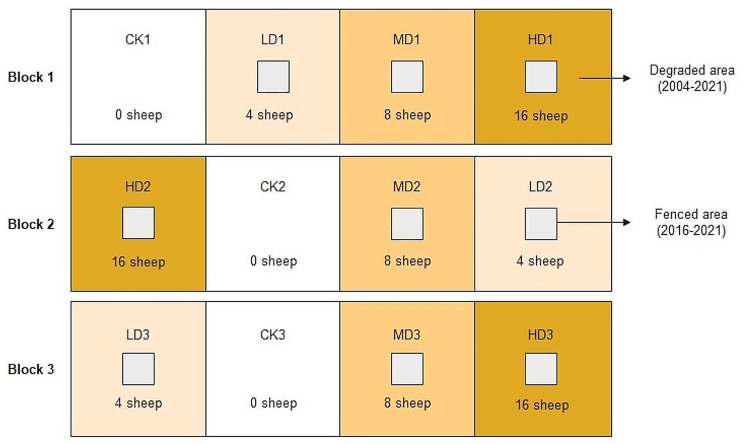
Background: Grazing exclusion is an efficient practice to restore degraded grassland ecosystems by eliminating external disturbances and improving ecosystems' self-healing capacities, which affects the ecological processes of soil-plant systems. Grassland degradation levels play a critical role in regulating these ecological processes. However, the effects of vegetation and soil states at different degradation stages on grassland ecosystem restoration are not fully understood. To better understand this, desert steppe at three levels of degradation (light, moderate, and heavy degradation) was fenced for 6 years in Inner Mongolia, China. Community characteristics were investigated, and nutrient concentrations of the soil (0-10 cm depth) and dominant plants were measured.
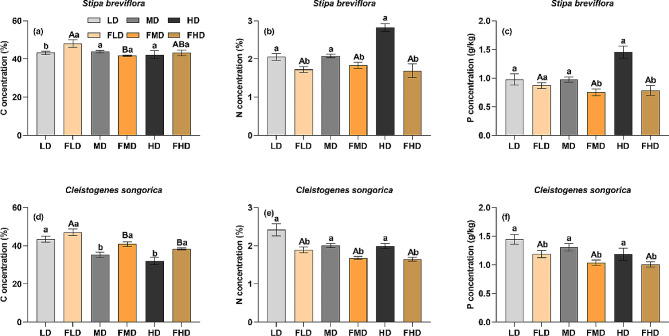
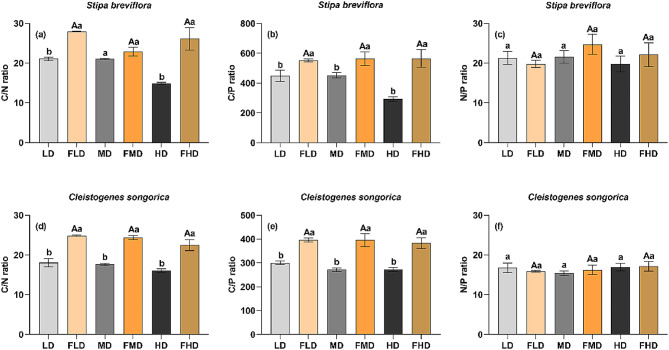
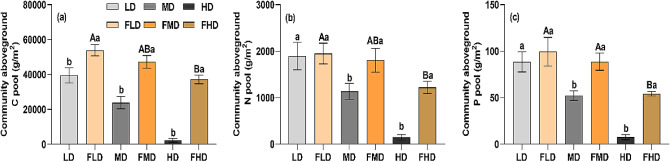
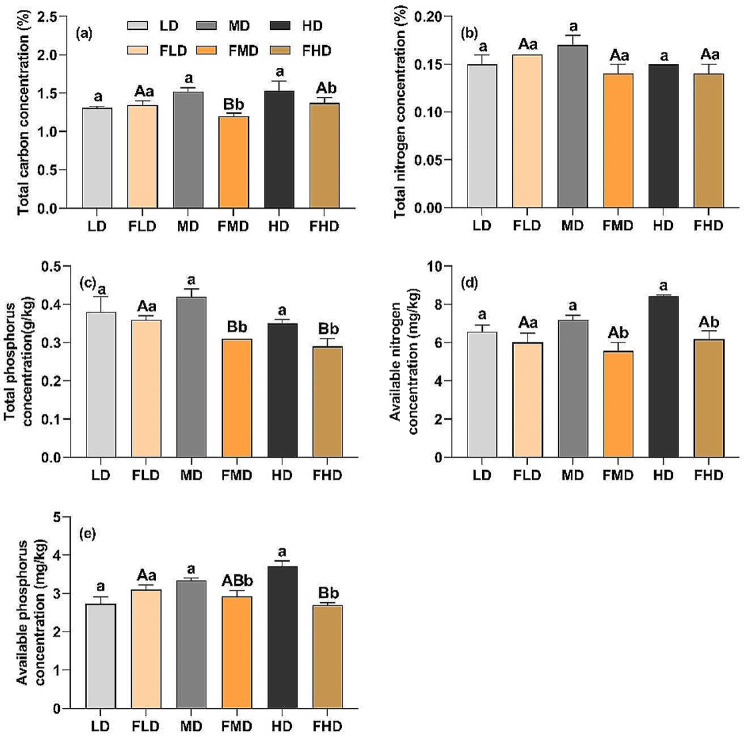
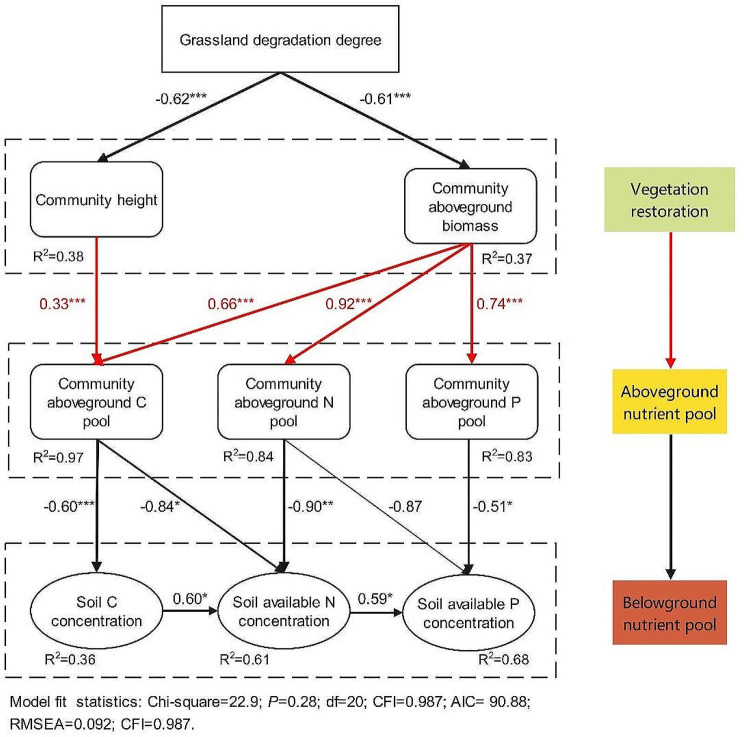
Results: We found that grazing exclusion increased shoots' carbon (C) concentrations, C/N, and C/P, but significantly decreased shoots' nitrogen (N) and phosphorus (P) concentrations for Stipa breviflora and Cleistogenes songorica. Interestingly, there were no significant differences in nutrient concentrations of these two species among the three degraded desert steppes after grazing exclusion. After grazing exclusion, annual accumulation rates of aboveground C, N, and P pools in the heavily degraded area were the highest, but the aboveground nutrient pools were the lowest among the three degraded grasslands. Similarly, the annual recovery rates of community height, cover, and aboveground biomass in the heavily degraded desert steppe were the highest among the three degraded steppes after grazing exclusion. These results indicate that grazing exclusion is more effective for vegetation restoration in the heavily degraded desert steppe. The soil total carbon, total nitrogen, total phosphorus, available nitrogen, and available phosphorus concentrations in the moderately and heavily degraded desert steppes were significantly decreased after six years of grazing exclusion, whereas these were no changes in the lightly degraded desert steppe. Structural equation model analysis showed that the grassland degradation level mainly altered the community aboveground biomass and aboveground nutrient pool, driving the decrease in soil nutrient concentrations and accelerating nutrient transfer from soil to plant community, especially in the heavily degraded grassland.
Conclusions: Our study emphasizes the importance of grassland degradation level in ecosystem restoration and provides theoretical guidance for scientific formulation of containment policies.
Keywords: Desert steppe; Fencing; Grassland degradation stage; Plant nutrient; Soil nutrient.
© 2024. The Author(s).
Conflict of interest statement
The authors declare no competing interests.
Figures
References
-
- Elser JJ, Sterner RW, Gorokhova E, Fagan WF, Markow TA, Cotner JB, Harrison JF, Hobbie SE, Odell GM, Weider LJ. Biological stoichiometry from genes to ecosystems. Ecol Lett. 2000;3:540–50. doi: 10.1111/j.1461-0248.2000.00185.x. - DOI
-
- Sardans J, Rivas-Ubach A, Penuelas J. The C:N:P stoichiometry of organisms and ecosystems in a changing world: a review and perspectives. Perspect Plant Ecol Evol Syst. 2012;14:33–47. doi: 10.1016/j.ppees.2011.08.002. - DOI
-
- Liu M, Zhang Z, Sun J, Li Y, Liu Y, Liyew Berihun M, Xu M, Tsunekawa A, Chen Y. Restoration efficiency of short-term grazing exclusion is the highest at the stage shifting from light to moderate degradation at Zoige, Tibetan Plateau. Ecol Ind. 2020;114:106323. doi: 10.1016/j.ecolind.2020.106323. - DOI
-
- Elser JJ, Bracken ME, Cleland EE, Gruner DS, Harpole WS, Hillebrand H, Ngai JT, Seabloom EW, Shurin JB, Smith JE. Global analysis of nitrogen and phosphorus limitation of primary producers in freshwater, marine and terrestrial ecosystems. Ecol Lett. 2007;10:1135–42. doi: 10.1111/j.1461-0248.2007.01113.x. - DOI - PubMed
-
- Zong N, Shi P, Zheng L, Zhou T, Cong N, Hou G, Song M, Tian J, Zhang X, Zhu J. Restoration effects of fertilization and grazing exclusion on different degraded alpine grasslands: evidence from a 10-year experiment. Ecol Eng. 2021;170:106361. doi: 10.1016/j.ecoleng.2021.106361. - DOI
MeSH terms
Substances
Grants and funding
- NJYT23086/Inner Mongolia Youth Science and Technology Talent Development Project
- NDYB2020-2/Inner Mongolia Agricultural University high-level talents research launch project
- BR220501/Inner Mongolia Autonomous Region universities basic research expenses
- 2021ZD0044/Key Project of Science and Technology in Inner Mongolia of China
LinkOut - more resources
Full Text Sources
Miscellaneous
