. 2024 May 16;23(1):104.
doi: 10.1186/s12943-024-01993-1.

DNMT1-targeting remodeling global DNA hypomethylation for enhanced tumor suppression and circumvented toxicity in oral squamous cell carcinoma

Affiliations

DNMT1-targeting remodeling global DNA hypomethylation for enhanced tumor suppression and circumvented toxicity in oral squamous cell carcinoma

Yangfan Liu et al. Mol Cancer. .

Abstract

Background: The faithful maintenance of DNA methylation homeostasis indispensably requires DNA methyltransferase 1 (DNMT1) in cancer progression. We previously identified DNMT1 as a potential candidate target for oral squamous cell carcinoma (OSCC). However, how the DNMT1- associated global DNA methylation is exploited to regulate OSCC remains unclear.

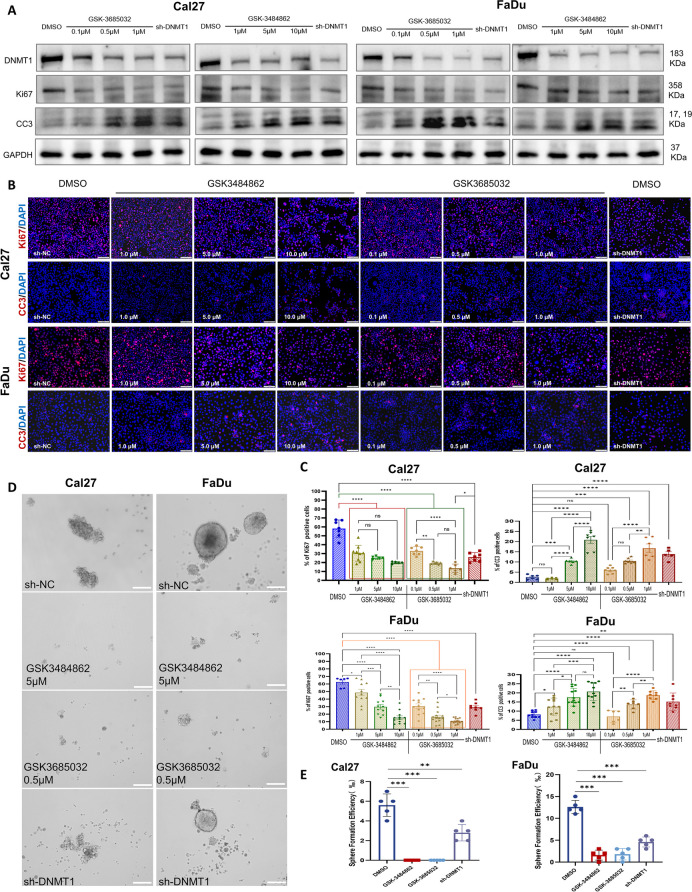
Methods: The shRNA-specific DNMT1 knockdown was employed to target DNMT1 on oral cancer cells in vitro, as was the use of DNMT1 inhibitors. A xenografted OSCC mouse model was established to determine the effect on tumor suppression. High-throughput microarrays of DNA methylation, bulk and single-cell RNA sequencing analysis, multiplex immunohistochemistry, functional sphere formation and protein immunoblotting were utilized to explore the molecular mechanism involved. Analysis of human samples revealed associations between DNMT1 expression, global DNA methylation and collaborative molecular signaling with oral malignant transformation.

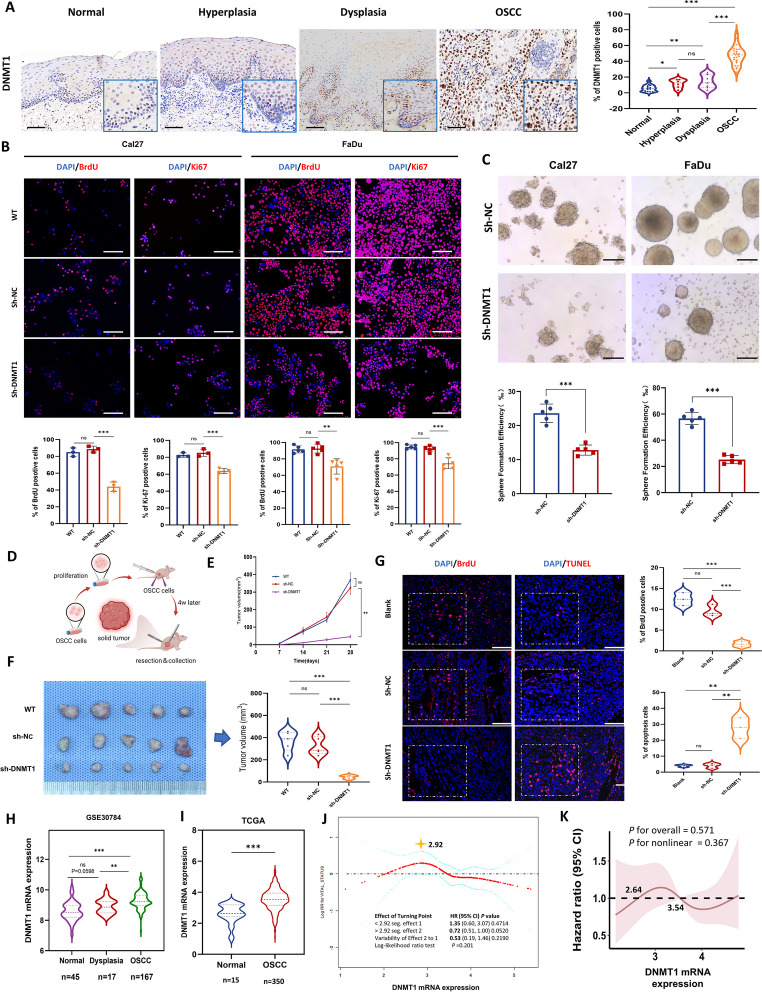
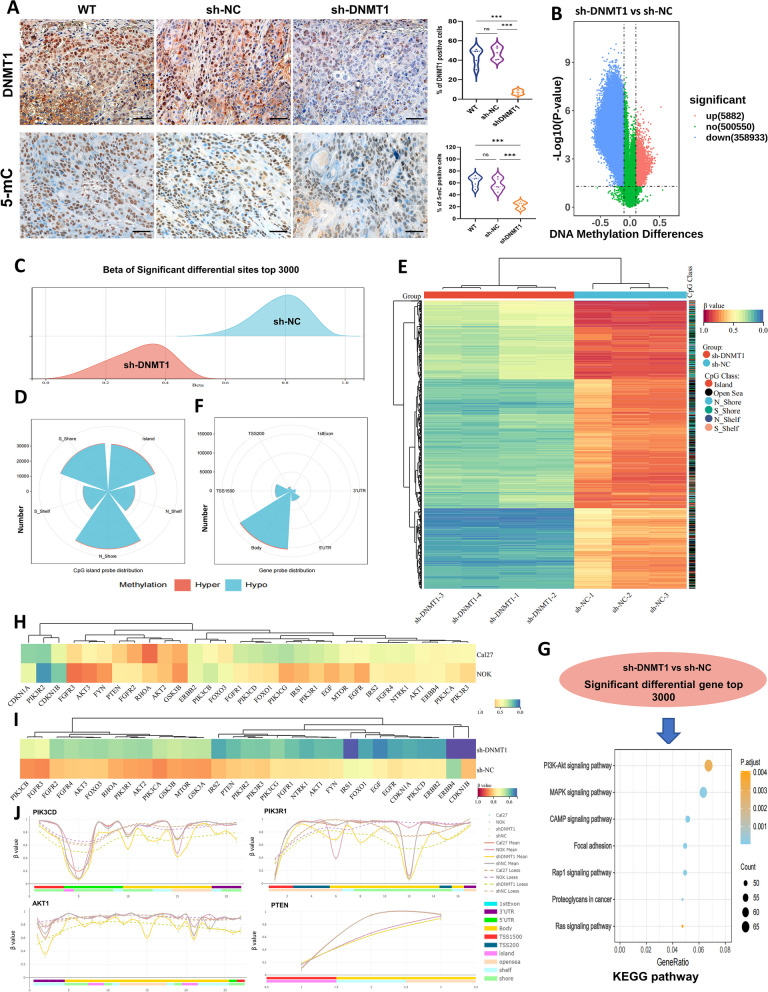
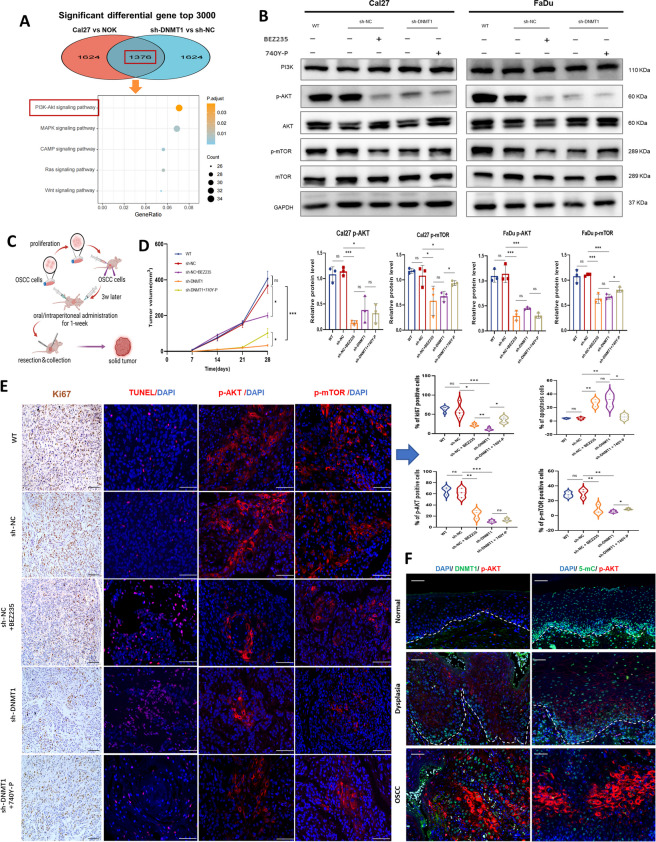
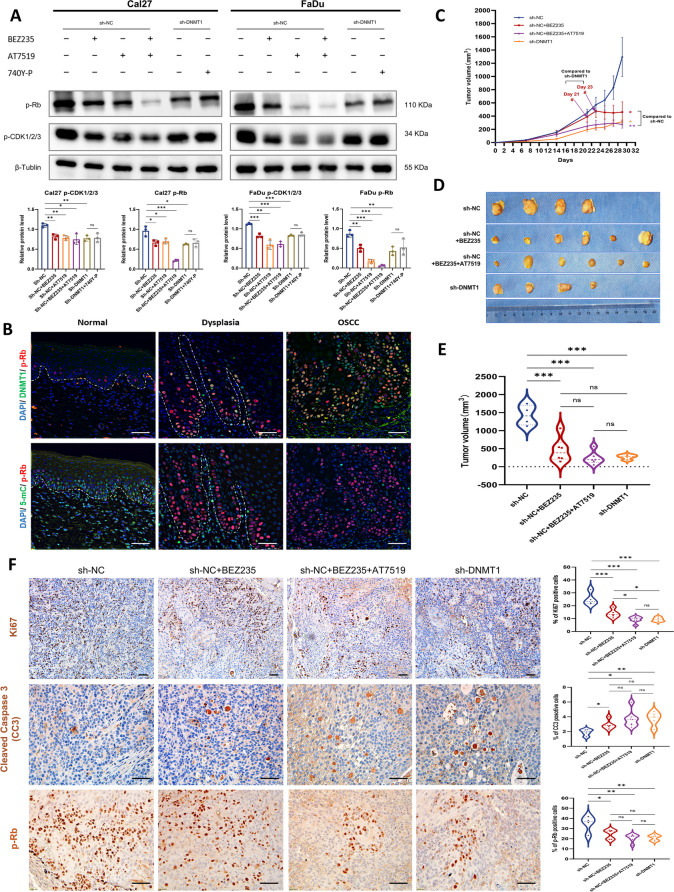
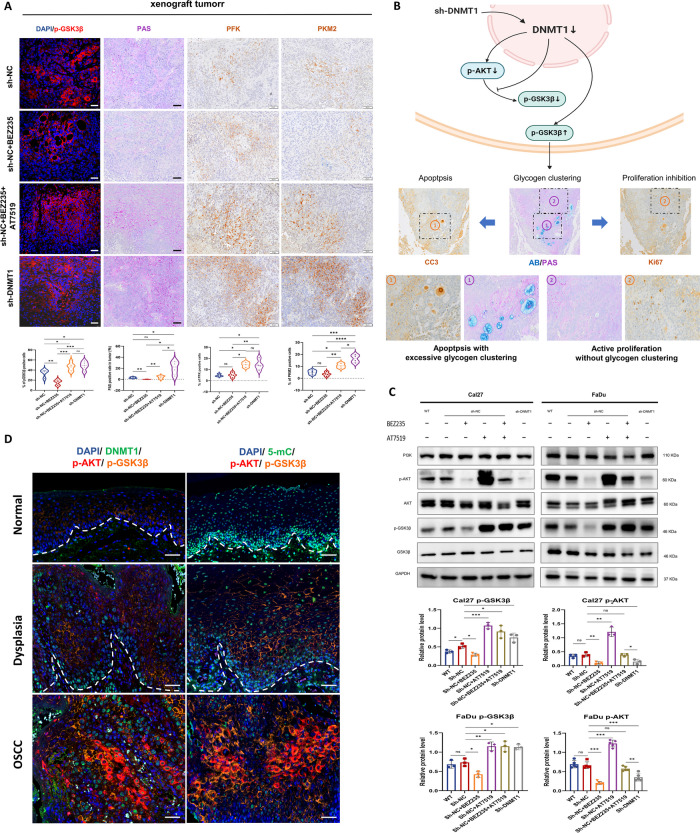
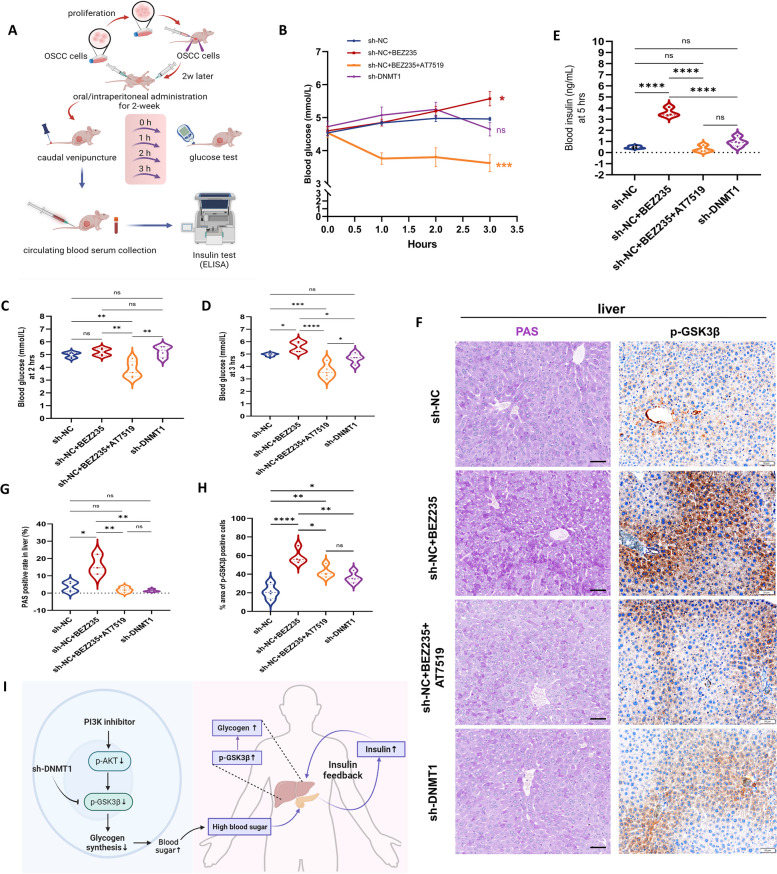
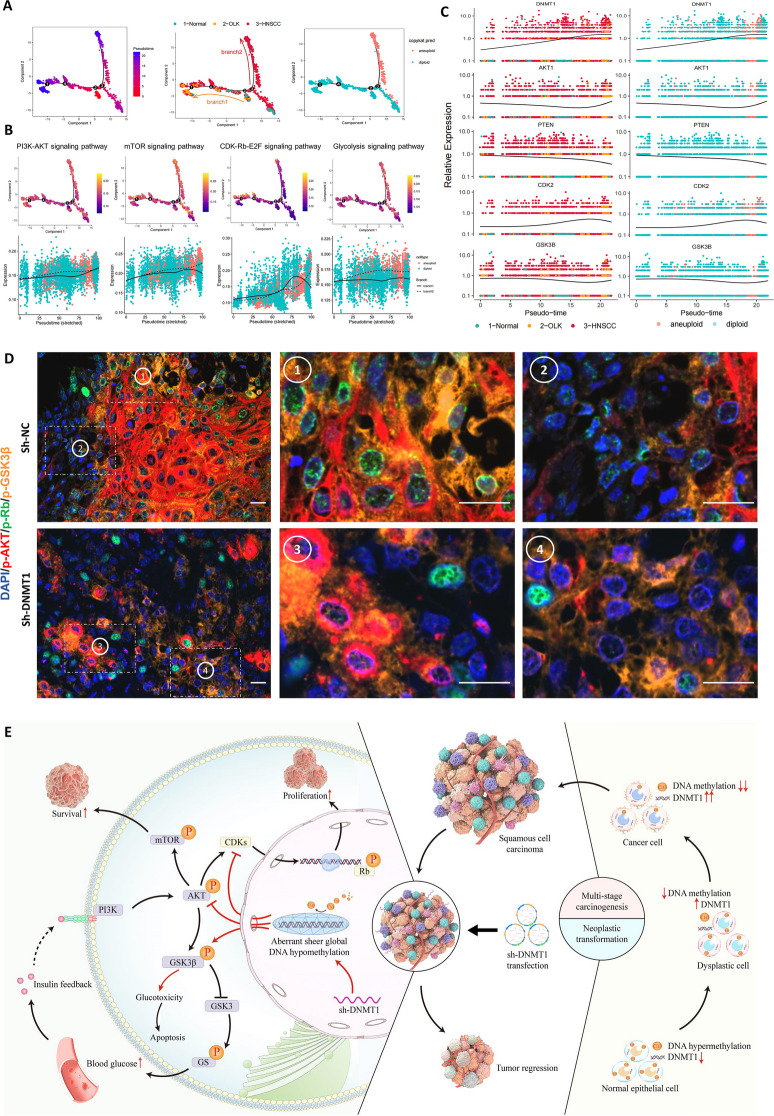
Results: We investigated DNMT1 expression boosted steadily during oral malignant transformation in human samples, and its inhibition considerably minimized the tumorigenicity in vitro and in a xenografted OSCC model. DNMT1 overexpression was accompanied by the accumulation of cancer-specific DNA hypomethylation during oral carcinogenesis; conversely, DNMT1 knockdown caused atypically extensive genome-wide DNA hypomethylation in cancer cells and xenografted tumors. This novel DNMT1-remodeled DNA hypomethylation pattern hampered the dual activation of PI3K-AKT and CDK2-Rb and inactivated GSK3β collaboratively. When treating OSCC mice, targeting DNMT1 achieved greater anticancer efficacy than the PI3K inhibitor, and reduced the toxicity of blood glucose changes caused by the PI3K inhibitor or combination of PI3K and CDK inhibitors as well as adverse insulin feedback.

Conclusions: Targeting DNMT1 remodels a novel global DNA hypomethylation pattern to facilitate anticancer efficacy and minimize potential toxic effects via balanced signaling synergia. Our study suggests DNMT1 is a crucial gatekeeper regarding OSCC destiny and treatment outcome.

Keywords: DNA methylation; DNMT1; Insulin feedback; Neoplastic transformation; Oral squamous cell carcinoma; PI3K; Pharmacological toxicity; Tumor growth.


Conflict of interest statement

The authors declare no competing interests.

Figures

Fig. 1
Fig. 1
DNMT1 expression increases along with oral neoplastic transformation and its overexpression is correlated with tumor growth. A Representative IHC images and analysis of DNMT1 in oral human samples including normal (n = 15), hyperplastic (n = 6), dysplastic (n = 7) and OSCC tissues (n = 22). Scale bars, 100 μm. B Immunofluorescence of BrdU and Ki67 in OSCC cell lines. The data are presented as the means ± SDs of three independent experiments. Scale bars, 100 μm. C Sphere formation assay and statistical quantification of OSCC cell lines. Scale bars, 100 μm. D Schematic showing the xenografted OSCC mouse model. n = 5 mice in each group. E Tumor growth curve. F Presentation of OSCC xenografted tumors and tumor volume statistics at the endpoint of the study. G Immunofluorescence and analysis of BrdU and TUNEL in OSCC xenografted tumors. Scale bars, 100 μm. H The mRNA expression of DNMT1 in multiple stages of carcinogenesis, including normal (n = 45), oral dysplasia (n = 17), and OSCC (n = 167) (data provided by GSE30784). I The mRNA expression of DNMT1 in OSCC (n = 350) compared to that in oral normal tissues (n = 15) (data from TCGA). J Smooth curve fitting showing the correlation between DNMT1 expression and mortality risk in OSCC patients. K Restricted cubic spline analysis indicating the correlation of DNMT1 expression with the hazard ratio of overall survival in OSCC patients. The values of DNMT1 RNA expression were 2.64 and 3.54, respectively, when HR = 1. *P < 0.05, **P < 0.01, and ***P < 0.001 according to unpaired Student’s t test or one-way ANOVA with Tukey’s multiple comparison test
Fig. 2
Fig. 2
DNMT1 inhibitors consistently significantly inhibited proliferation and promoted of apoptosis in OSCC cells. A Western blot analysis of DNMT1, Ki67, and CC3 in OSCC cells. GSK-3484862 and GSK-3685032 were diluted in DMSO at different concentrations. The data are shown as the mean ± SEM. B and C Immunofluorescence and statistical quantification of Ki67 and CC3 in OSCC cells. Scale bars, 100 μm. D and E Sphere formation assay and statistical quantification of OSCC cells. Scale bars, 100 μm. *P < 0.05, **P < 0.01, ***P < 0.001, and ****P < 0.0001 by one-way ANOVA with Tukey’s multiple comparison test
Fig. 3
Fig. 3
Global DNA hypomethylation occurs during oral carcinogenesis and is relatively stable in cancer cells and is associated with OSCC prognosis. A Representative IHC images and analysis of 5-mC in oral human samples, including normal (n = 15), hyperplastic (n = 6), dysplastic (n = 7) and OSCC (n = 22) tissue samples. Scale bars, 100 μm. B Volcano plots from the DNA methylation 850 k chip showing significantly differential CpG sites in Cal27 cells compared to NOK cells. C and D Nightingale rose chart showing the number of all significant DMSs with a CpG island probe distribution (C) and a gene probe distribution (D), respectively. E Ridge plot showing the β value distribution of the top 3000 significant differential sites in Cal27 cells and NOK cells. F Heatmap showing the top 1000 differential CpG sites with the absolute differences in β values. The class of CpGs (in relation to CpG islands) is shown on the right of the heatmap. G Bubble chart showing GO biological process enrichment of genes related to differential DNA methylation sites. The differential DNA methylation sites distributed on CpG islands were sorted by β value, and the top 3000 related genes were selected for enrichment analysis. H Heatmap showing the top 500 upregulated genes and 500 downregulated genes in Cal27 and NOK cells according to RNA-seq. UpSetR visualized overlapping genes among the DMGs and DEGs of Cal27 and NOK, as well as DEGs from the TCGA database. The bottom circle graph shows the hallmark gene set enrichment of the 175 overlapping genes. I Global DNA methylation (normalized as total β values log2) in OSCC (n = 74) compared with that in OLK tissues (typical oral precancerous lesion, n = 22) and normal oral tissues (n = 22) based on GSE204943 dataset. J Global DNA methylation (normalized as total β values log2) in OSCC (n = 350) compared with that in normal oral tissues (n = 15) based on TCGA data. K Smooth curve fitting showing the correlation between global DNA methylation and mortality risk in OSCC patients. L Restricted cubic spline analysis indicating the correlation of global DNA methylation with the hazard ratio of overall survival in OSCC patients. *P < 0.05, **P < 0.01, and ***P < 0.001 by unpaired Student’s t test or one-way ANOVA with Tukey’s multiple comparison test
Fig. 4
Fig. 4
DNMT1 targeting remodeled an extensive and sheer genome-wide DNA hypomethylation pattern in OSCC. A Representative IHC images and analysis of DNMT1 and 5-mC in xenografted OSCC tumors. n = 5 mice in each group. Scale bars, 50 μm. B Volcano plots from DNA methylation 850 k chip showing significantly differential DNA methylation sites in sh-DNMT1 cells compared to sh-NC Cal27 cells. C Ridge plot showing the β value distribution of the top 3000 significantly differential sites in sh-DNMT1 and sh-NC Cal27 cells. D Nightingale rose chart showing the distribution of all DMSs with CpG island probes. E Heatmap showing the top 1000 differential CpG sites with the absolute differences in β values. The class of CpGs (in relation to CpG islands) is shown on the right of the heatmap. F Nightingale rose chart showing the proportion of all significant DMSs with gene probe distribution. G Bubble chart showing KEGG enrichment of DEGs related to DNA methylation sites. The differentially methylated sites distributed on CpG islands were sorted by β value difference, and the top 3000 related genes were selected for enrichment analysis. H and I Heatmap showing the mean methylation levels at differentially methylated sites of genes in the PI3K-AKT pathway between Cal27 and NOK cells, and between sh-DNMT1 and sh-NC cancer cells. J All significantly DMSs were enriched in the genes PIK3CD, PIK3R1, AKT1 and PTEN, which are representative key genes in the PI3K-AKT pathway. Solid lines, the mean β values of each cell line; dotted lines, the β values loess of each cell lines. *P < 0.05, **P < 0.01, and ***P < 0.001 by unpaired Student’s t test or one-way ANOVA with Tukey’s multiple comparison test
Fig. 5
Fig. 5
The PI3K-AKT pathway is involved in DNMT1-remodeled DNA hypomethylation pattern to regulate oral neoplastic transformation and tumor growth. A Bubble chart showing KEGG enrichment of the top 3000 overlapping genes related to differential DNA methylation sites between Cal27 and NOK and between sh-DNMT1 and sh-NC cells. B Western blot analysis of the indicated proteins in Cal27 and FaDu cells under the different conditions shown in the graph. Cells were treated with 1 µM BEZ235 or 25 µg/ml 740 Y-P for 24 h. GAPDH was used as an internal control. Upper panel: representative blots; lower panel: The densitometry quantification of the means ± SDs of three independent experiments. C Schematic showing the xenografted OSCC model. n = 5 mice in the WT, sh-NC, sh-DNMT1 and sh-DNMT1 + 740 Y-P groups, and n = 3 mice in the sh-NC + BEZ235 group. D Tumor growth curve. E Representative staining images and quantification of Ki67, TUNEL, p-AKT and p-mTOR staining in xenografted OSCC tumors. Scale bars, 100 μm. F Representative mIHC images of three channels, namely, DAPI, DNMT1 or 5-mC, and p-AKT in oral human samples including normal, dysplastic and OSCC tissues. Scale bars, 50 μm. *P < 0.05, **P < 0.01, and ***P < 0.001 by one-way ANOVA with Tukey’s multiple comparison test
Fig. 6
Fig. 6
Restraining the CDK2-Rb signaling pathway contributed to the enhanced tumor-suppression caused by DNMT1-remodeled global DNA hypomethylation. A Western blot analysis of the indicated proteins in Cal27 and FaDu cells under different conditions is shown in the graph. Cells were treated with 1 µM BEZ235 or 25 µg/ml 740 Y-P for 24 h or with 1 µM AT7519 for 8 h. β-Tubulin was used as an internal control. Upper panel:: representative blots; lower panel: The densitometry quantification of the means ± SDs of three independent experiments. B Representative mIHC images of three channels, namely, DAPI, DNMT1 or 5-mC and p-Rb in oral human samples including normal, dysplastic and OSCC tissues. Scale bars, 50 μm. C Tumor growth curve. n = 5 mice for the sh-NC + BEZ235 and sh-NC BEZ235 + 740 Y-P groups, and n = 4 mice for the sh-NC and sh-DNMT1 groups. #P < 0.05 by unpaired Student’s t test. D and E Presentation of gross xenograft tumors (d) and tumor volume statistics (e) at the endpoint of the study. F Representative IHC images and analysis of Ki67, cleaved caspase 3 (CC3) and p-Rb in xenograft OSCC tumors. Scale bars, 50 μm. *P < 0.05, **P < 0.01, and ***P < 0.001 by one-way ANOVA with Tukey’s multiple comparison test
Fig. 7
Fig. 7
The GSK3β inactivation by DNMT1 knockdown leads to excessive glycogen clustering and apoptosis in tumors. A Representative IF images for p-GSK3β and PAS/IHC images for glycogen, PFK and PKM2 in xenografted OSCC tumors. Below are the corresponding statistical analysis results. Scale bars, 50 μm. B As shown in the schematic, DNMT1 knockdown prevents GSK3β activation downstream of PI3K inhibition by upregulating p-GSK3β, leading to excessive glycogen clustering in the tumor (AB-PAS staining), which is located around apoptosis and far from proliferation (IHC staining). C Western blot analysis of the indicated proteins in Cal27 and FaDu cells under the different conditions shown in the graph. Cells were treated with 1 µM BEZ235 for 24 h and 1 µM AT7519 for 8 h. GAPDH was used as an internal control. Upper panel: representative blots; lower panel: densitometry quantification of the means ± SDs of at least three independent experiments. D Representative mIHC images showing DAPI, DNMT1 or 5-mC, p-AKT and p-GSK3β in oral human samples, including normal, dysplastic and OSCC tissues. Scale bars, 50 μm. *P < 0.05, **P < 0.01, and ***P < 0.001 by one-way ANOVA with Tukey’s multiple comparison test
Fig. 8
Fig. 8
The GSK3β inactivation by DNMT1 knockdown antagonizes the insulin feedback resulting from PI3K inhibition. A Experimental schematic of blood glucose and serum insulin detection in tumor-bearing mice. n = 4 mice for each group. B Line chart of blood glucose within 3 h after administration. C and D Blood glucose of mice at 2 h (C) and 3 h (D) after administration respectively. e Serum insulin levels of the mice at 5 h after administration. F–H Representative PAS/IHC images (f) and analysis (g, h) of glycogen/p-GSK3β in mouse livers 5 h after administration. Scale bars, 50 μm. I As shown in the schematic, a PI3K inhibitor activates GSK3β through dephosphorylation, hindering glycogen synthesis and causing detrimental hyperglycemic effects. Elevated blood glucose levels can induce insulin feedback, culminating in hepatic glycogen accumulation. DNMT1 silencing can block this process by promoting GSK3β phosphorylation. *P < 0.05, **P < 0.01, and ***P < 0.001 by a one-way ANOVA with Tukey’s multiple comparison test
Fig. 9
Fig. 9
The DNMT1-mediated signaling synergy pattern and schematic in oral carcinogenesis and anticancer efficacy. A Pseudotime trajectory of epithelial cells, with each color coded for pseudotime (left), groups (middle), and copykat.pred (right) B Pseudotime trajectory analysis of the AUCell score of PI3K-AKT, mTOR, CDK-Rb-E2F and glycolysis signaling pathways. C Pseudotime trajectory analysis of the expression of DNMT1, PTEN, AKT1, CDK2 and GSK3B. D Representative mIHC staining images of DAPI, p-AKT, p-Rb and p-GSK3β in xenografted OSCC tumors. Scale bars, 20 μm. E Schematic indicating that the DNMT1- dependent global DNA methylation pattern functions in oral carcinogenesis and treatment of OSCC, as well as the collaborative signal transduction involved. Red arrows represent the effects of sh-DNMT1; black arrows represent natural biological processes. This schematic image was created by BioRender

Similar articles

Cited by

References

    1. Mody MD, Rocco JW, Yom SS, Haddad RI, Saba NF. Head and neck cancer. Lancet. 2021;398:2289–2299. doi: 10.1016/S0140-6736(21)01550-6. - DOI - PubMed
    1. Luo JJ, Young CD, Zhou HM, Wang XJ. Mouse models for studying oral cancer: impact in the era of cancer immunotherapy. J Dent Res. 2018;97:683–690. doi: 10.1177/0022034518767635. - DOI - PMC - PubMed
    1. Chang MS, Azin M, Demehri S. Cutaneous squamous cell carcinoma: the frontier of cancer immunoprevention. Annu Rev Pathol. 2022;17:101–119. doi: 10.1146/annurev-pathol-042320-120056. - DOI - PubMed
    1. Kaidar-Person O, Gil Z, Billan S. Precision medicine in head and neck cancer. Drug Resist Updat. 2018;40:13–16. doi: 10.1016/j.drup.2018.09.001. - DOI - PubMed
    1. Qi Z, Qiu Y, Wang Z, Zhang H, Lu L, Liu Y, Mathes D, Pomfret EA, Gao D, Lu SL, Wang Z. A novel diphtheria toxin-based bivalent human EGF fusion toxin for treatment of head and neck squamous cell carcinoma. Mol Oncol. 2021;15:1054–1068. doi: 10.1002/1878-0261.12919. - DOI - PMC - PubMed

MeSH terms

Substances