. 2024 May 16;23(1):105.
doi: 10.1186/s12943-024-02010-1.

RICTOR/mTORC2 downregulation in BRAFV600E melanoma cells promotes resistance to BRAF/MEK inhibition

Affiliations

RICTOR/mTORC2 downregulation in BRAFV600E melanoma cells promotes resistance to BRAF/MEK inhibition

Luca Ponzone et al. Mol Cancer. .

Abstract

Background: The main drawback of BRAF/MEK inhibitors (BRAF/MEKi)-based targeted therapy in the management of BRAF-mutated cutaneous metastatic melanoma (MM) is the development of therapeutic resistance. We aimed to assess in this context the role of mTORC2, a signaling complex defined by the presence of the essential RICTOR subunit, regarded as an oncogenic driver in several tumor types, including MM.

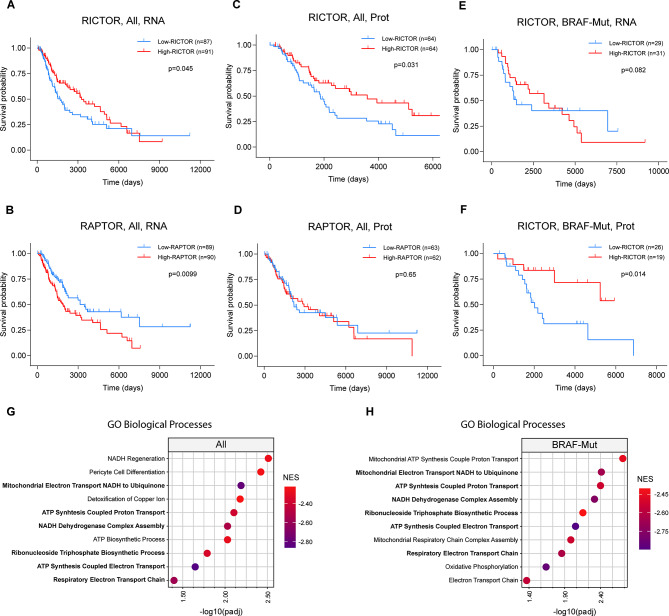
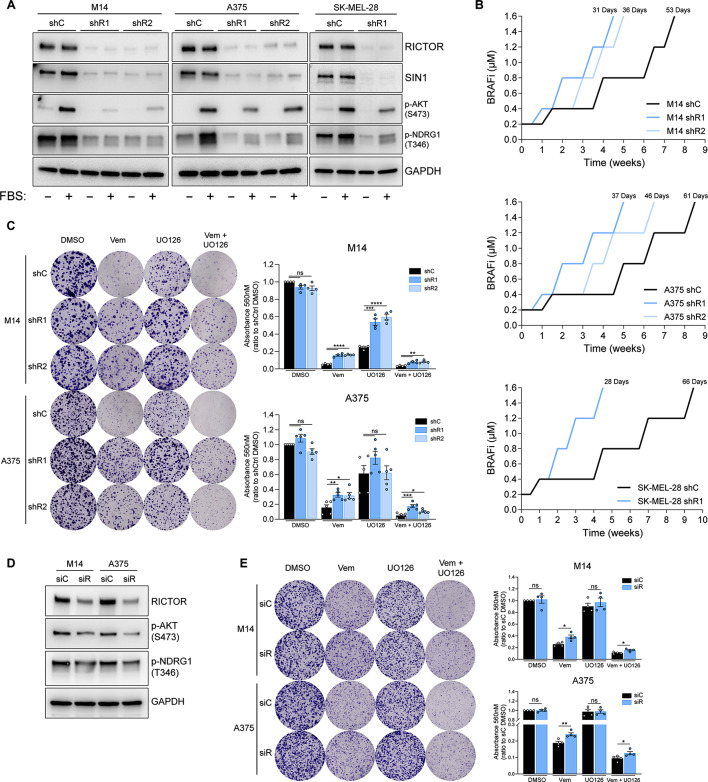
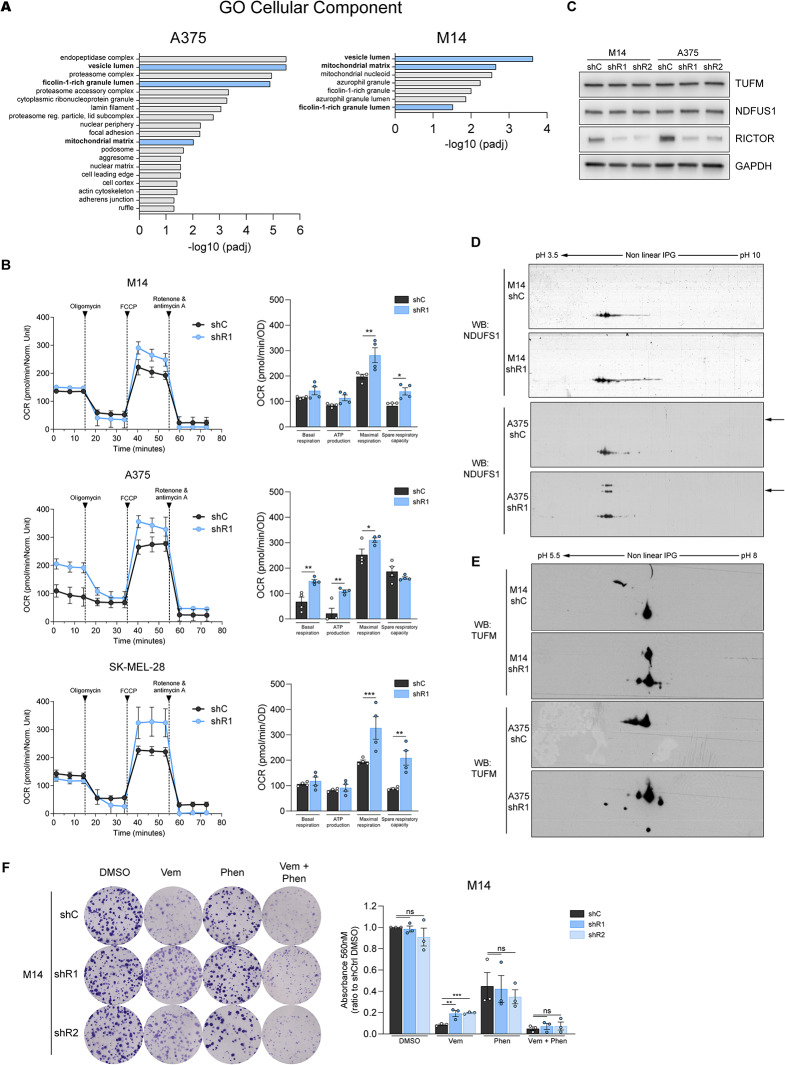
Methods: After analyzing The Cancer Genome Atlas MM patients' database to explore both overall survival and molecular signatures as a function of intra-tumor RICTOR levels, we investigated the effects of RICTOR downregulation in BRAFV600E MM cell lines on their response to BRAF/MEKi. We performed proteomic screening to identify proteins modulated by changes in RICTOR expression, and Seahorse analysis to evaluate the effects of RICTOR depletion on mitochondrial respiration. The combination of BRAFi with drugs targeting proteins and processes emerged in the proteomic screening was carried out on RICTOR-deficient cells in vitro and in a xenograft setting in vivo.

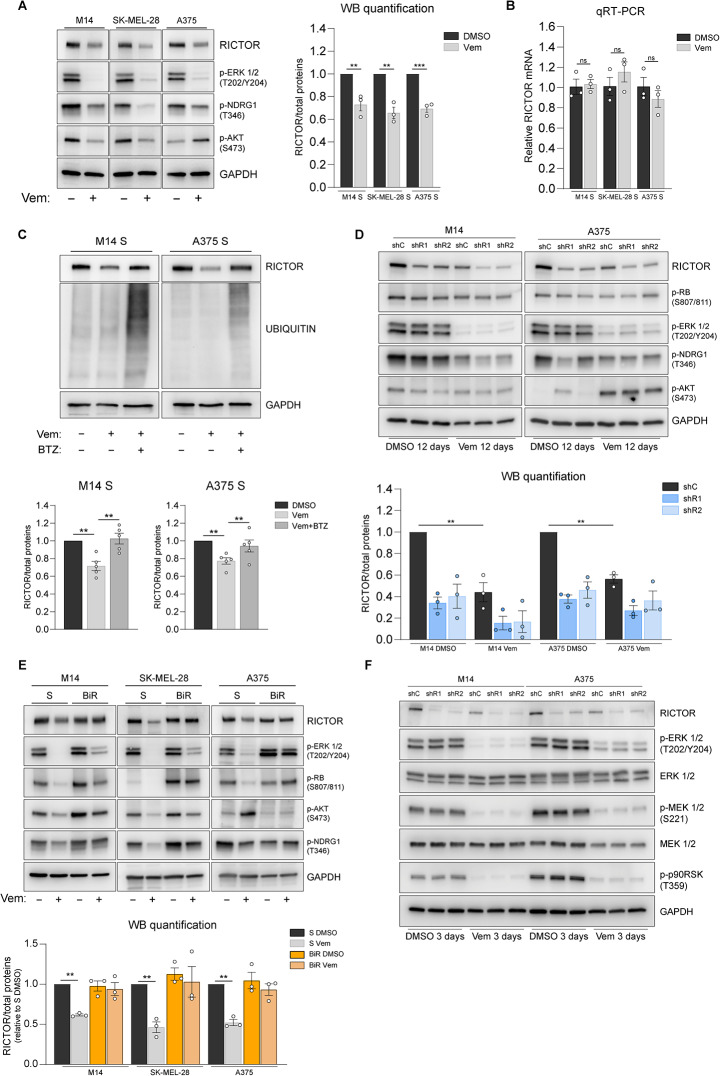
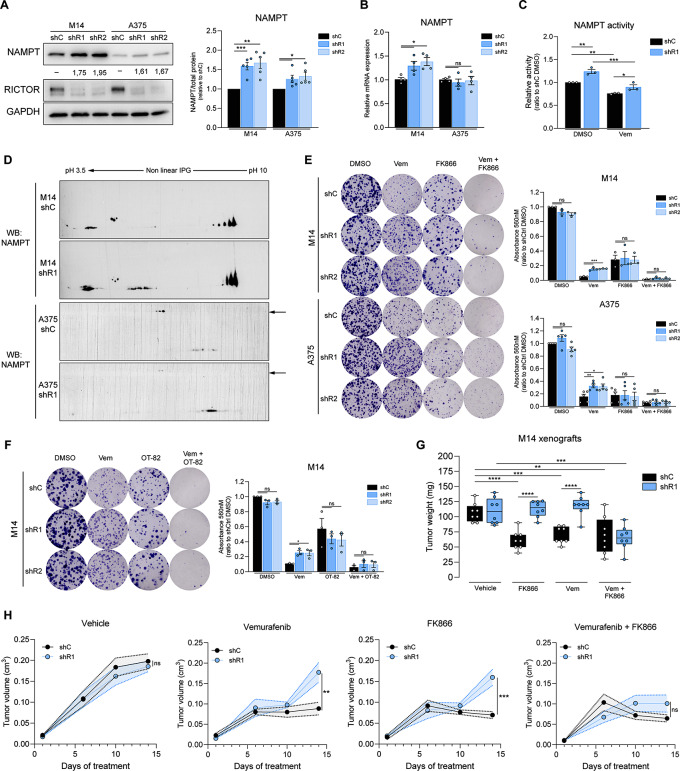
Results: Low RICTOR levels in BRAF-mutated MM correlate with a worse clinical outcome. Gene Set Enrichment Analysis of low-RICTOR tumors display gene signatures suggestive of activation of the mitochondrial Electron Transport Chain (ETC) energy production. RICTOR-deficient BRAFV600E cells are intrinsically tolerant to BRAF/MEKi and anticipate the onset of resistance to BRAFi upon prolonged drug exposure. Moreover, in drug-naïve cells we observed a decline in RICTOR expression shortly after BRAFi exposure. In RICTOR-depleted cells, both mitochondrial respiration and expression of nicotinamide phosphoribosyltransferase (NAMPT) are enhanced, and their pharmacological inhibition restores sensitivity to BRAFi.

Conclusions: Our work unveils an unforeseen tumor-suppressing role for mTORC2 in the early adaptation phase of BRAFV600E melanoma cells to targeted therapy and identifies the NAMPT-ETC axis as a potential therapeutic vulnerability of low RICTOR tumors. Importantly, our findings indicate that the evaluation of intra-tumor RICTOR levels has a prognostic value in metastatic melanoma and may help to guide therapeutic strategies in a personalized manner.

Keywords: BRAFV600E melanoma; Drug resistance; Mitochondrial metabolism; NAMPT; RICTOR; Targeted therapy; mTORC2.


Conflict of interest statement

The authors declare that they have no conflict of interest.

Figures

Fig. 1
Fig. 1
Analysis of Melanoma patients’ data from the TCGA database. (A-F) Kaplan-Meier survival analysis of the metastatic Skin Cutaneous Melanoma (SKCM) dataset obtained from TCGA patients’ database. A-D curves were obtained from analysis of the whole TCGA database irrespective of BRAF mutational status (All); E-F curves include only patients with reported BRAF Hotspot Mutations (BRAF-Mut); A, B, E curves were obtained from gene expression database (RNA); C, D, F were obtained from Reverse Phase Protein Array (RPPA) data. Patients were stratified into High and Low RICTOR-expressing groups based on average RNA/Protein expression levels. High-RICTOR/RAPTOR = fourth quartile; Low-RICTOR/RAPTOR = first quartile. Number of patients for each group and p-value calculated by Log-rank test are indicated in individual graphs. (G-H) Dotplots indicate the top 10 most significantly enriched Gene Ontology (GO) categories anticorrelated with RICTOR expression, in the (G) whole dataset (All; n = 367) or (H) after filtering for BRAF Hotspot Mutations (BRAF-Mut; n = 118). NES = Normalized Enrichment Score
Fig. 2
Fig. 2
Downregulation of RICTOR in BRAFV600E melanoma cell lines promotes resistance to BRAF/MEKi. (A) Western blot analysis of indicated cell lines transduced with RICTOR-targeting shRNAs (shR1, shR2) or scramble control (shC) lentiviruses. Cells were analyzed after 24 h of serum starvation (-) or 24 h of serum starvation followed by 15 min of refeeding (+). (B) Resistance acquisition kinetics analysis of RICTOR-silenced (shR1, shR2) or control (shC) M14/A375/SK-MEL-28 cells exposed to increasing doses of BRAFi (Vemurafenib, from 0.2 to 1.6 µM). The number of days required to reach resistance to 1.6 µM Vemurafenib is indicated on top of each curve. (C) Colony Formation Efficiency (CFE) assay of indicated cell lines cultured for 12 days in presence of vehicle control (DMSO), 0.5 µM Vemurafenib (Vem), 0.5 µM UO126 (UO126) or the combination of 0.5 µM Vemurafenib + 0.5 µM UO126 (Vem + UO126). Bar graphs represent the mean values of independent experiments ± SEM (n = 4 for M14 cells; n = 5 for A375 cells). ns = not significant, *p < 0.05, **p < 0.01, ***p < 0.001, ****p < 0.0001, one-way ANOVA followed by Dunnett’s multiple comparisons test. (D) Western blot analysis of indicated cell lines transfected with a RICTOR-targeting (siR) or Non-targeting control (siC) siRNAs at 72 h after transfection. (E) CFE assay of indicated cell lines cultured for 7 days in presence of DMSO, Vem, UO126 or the combination of Vem + UO126 as in (C). Bar graphs represent the mean values of 4 independent experiments ± SEM. ns = not significant, *p < 0.05, **p < 0.01, unpaired t test
Fig. 3
Fig. 3
RICTOR protein downregulation occurs in drug-naïve BRAFV600E melanoma cells as a consequence of MAPK pathway inhibition. (A) Western blot analysis of indicated cell lines treated with (-) DMSO or (+) with 1.6 µM Vemurafenib (Vem) for 72 h. Images are representative of 3 independent experiments. See right panel for quantification. (B) Quantitative reverse transcription PCR (qRT-PCR) analysis of RICTOR gene expression in the indicated cell lines treated for 72 h either with DMSO or 1.6 µM Vemurafenib (Vem). Bar graphs represent the mean values of 3 independent experiments ± SEM. ns = not significant, one-way ANOVA followed by Dunnett’s multiple comparisons test. (C) Upper panel: western blot analysis of indicated cell lines treated for 48 h with 1.6 µM Vem ± 10 nM Bortezomib (BTZ). Lower panel: bar graphs show the mean values of densitometric analysis of RICTOR from 5 independent experiments ± SEM. **p < 0.01, one-way ANOVA followed by Dunnett’s multiple comparisons test. (D) Western blot analysis of indicated cell lines. Cells were cultured for 12 days in presence of either DMSO or 0.5 µM Vem. (E) Western blot analysis of Vemurafenib-sensitive (S) and -resistant (BiR) BRAFV600E melanoma cell lines treated for 72 h with (-) DMSO vehicle or (+) 1.6 µM Vemurafenib (Vem) (F) Western blot analysis of indicated cell lines treated for 72 h either with DMSO or 0.5 µM Vem
Fig. 4
Fig. 4
RICTOR depletion in BRAFV600E melanoma cells induces alterations in mitochondrial functions and protein profiles. (A) Significantly enriched gene ontology (GO) categories of differentially expressed protein species identified by MALDI-ToF MS in shR1 M14 and A375 cells. Blue bars indicate GO terms in common between the two lineages. Redundant enriched terms relative to identical subsets of proteins have been omitted. (B) Oxygen consumption rate (OCR) measurement performed on indicated cell lines using Seahorse XFp analyzer. Bar graphs represent indicated functional parameters calculated from the same measurements (n = 4). *p < 0.05, **p < 0.01, ***p < 0.001 one-way ANOVA followed by Sidak’s multiple comparisons test (C) Western blot analysis performed on indicated cell lines under basal conditions. (D, E) Western blot analysis of NDUFS1 (D) and TUFM (E) proteins in the indicated cell lines performed after 2D-Gel electrophoresis (2D-GE) under basal conditions. Arrows indicate NDFUS1 proteoforms with different molecular weights. See Fig S4B-D for quantification of western blots shown in C-E. (F) CFE assay of indicated cell lines cultured for 12 days in presence of DMSO, 0.5 µM Vemurafenib (Vem), 200 µM Phenformin (Phen) or the combination of 0.5 µM Vemurafenib + 200 µM Phenformin (Vem + Phen). Bar graphs represent the mean values of 3 independent experiments ± SEM. **p < 0.01, ***p < 0.001, one-way ANOVA followed by Dunnett’s multiple comparisons test
Fig. 5
Fig. 5
RICTOR silencing in BRAFV600E melanoma cell lines leads to increased NAMPT activity which can be pharmacologically inhibited to restore sensitivity to BRAFi. (A) WB analysis performed on indicated cell lines under basal conditions. Densitometric quantification of NAMPT band intensity is indicated below each band. Right panel: densitometric quantification of WB, each value was normalized on shC cells of the same lineage. Bar graphs represent the mean values of 5 independent experiments ± SEM. *p < 0.05, **p < 0.01, ***p < 0.001, one-way ANOVA followed by Dunnett’s multiple comparisons test. (B) qRT-PCR analysis of NAMPT gene expression in the indicated cell lines under basal conditions. Bar graphs represent mean values of 4 independent experiments ± SEM. *p < 0.05, one-way ANOVA followed by Dunnett’s multiple comparisons test. (C) NAMPT enzymatic activity of M14 cells treated for 24 h with 5 µM Vemurafenib (Vem) or vehicle control (DMSO), normalized on untreated shC cells. Bar graphs represent mean values of 3 independent experiments ± SEM. *p < 0.05, **p < 0.01, ***p < 0.001, two-way ANOVA followed by Tukey’s multiple comparisons test. (D) WB analysis of NAMPT protein in the indicated cell lines performed after 2D-GE under basal conditions. Arrows indicate NDFUS1 proteoforms with different molecular weights. See Fig S5B for quantification. (E) CFE assay of indicated cell lines cultured for 12 days in presence of DMSO, 0.5 µM Vem, 2.5 nM FK866 or the combination of 0.5 µM Vem + 2.5 nM FK866 (Vem + FK866). Bar graphs represent the mean values of independent experiments ± SEM (n = 3 for M14 cells; n = 4 for A375 cells). *p < 0.05, **p < 0.01, ***p < 0.001, ****p < 0.0001, one-way ANOVA followed by Dunnett’s multiple comparisons test. (F) CFE assay of M14 cells cultured for 12 days in presence of DMSO, 0.5 µM Vem, 1.2 nM OT-82 or the combination of 0.5 µM Vem + 1.2 nM OT-82 (Vem + OT-82). Bar graphs represent the mean values of 3 independent experiments ± SEM. *p < 0.05, one-way ANOVA followed by Dunnett’s multiple comparisons test. (G) Tumor weights of tumor xenografts of shC or shR1 M14 cells in NSG mice (n = 8 mice/group), treated for 14 days with the indicated drugs. **p < 0.01, ***p < 0.001, ****p < 0.0001, two-way ANOVA followed by Tukey’s multiple comparisons test. (H) Growth curves of M14 shC or shR1 xenografts used for tumor weight measurement, each graph refers to the treatment indicated at the top. *p < 0.05, **p < 0.01, two-way ANOVA followed by Tukey’s multiple comparisons test performed at the experimental endpoint

References

    1. Jenkins RW, Fisher DE. Treatment of Advanced Melanoma in 2020 and Beyond. Journal of Investigative Dermatology. Volume 141. Elsevier B.V.; 2021. pp. 23–31. - PMC - PubMed
    1. Moriceau G, Hugo W, Hong A, Shi H, Kong X, Yu CC, et al. Tunable-combinatorial mechanisms of Acquired Resistance Limit the Efficacy of BRAF/MEK cotargeting but result in Melanoma Drug Addiction. Cancer Cell. 2015;27(2):240–56. doi: 10.1016/j.ccell.2014.11.018. - DOI - PMC - PubMed
    1. Tangella LP, Clark ME, Gray ES. Resistance mechanisms to targeted therapy in BRAF-mutant melanoma - A mini review. Biochimica et Biophysica Acta - General Subjects. Volume 1865. Elsevier B.V.; 2021. - PubMed
    1. Indini A, Fiorilla I, Ponzone L, Calautti E, Audrito V. NAD/NAMPT and mTOR pathways in Melanoma: drivers of Drug Resistance and prospective therapeutic targets. International Journal of Molecular Sciences. Volume 23. MDPI; 2022. - PMC - PubMed
    1. Luebker SA, Koepsell SA. Diverse mechanisms of BRAF inhibitor resistance in melanoma identified in clinical and preclinical studies. Frontiers in Oncology. Volume 9. Frontiers Media S.A.; 2019. - PMC - PubMed

MeSH terms

Substances