. 2024 May 16;22(1):255.
doi: 10.1186/s12951-024-02509-1.

Extracellular vesicles from senescent mesenchymal stromal cells are defective and cannot prevent osteoarthritis

Affiliations

Extracellular vesicles from senescent mesenchymal stromal cells are defective and cannot prevent osteoarthritis

Jérémy Boulestreau et al. J Nanobiotechnology. .

Erratum in

Abstract

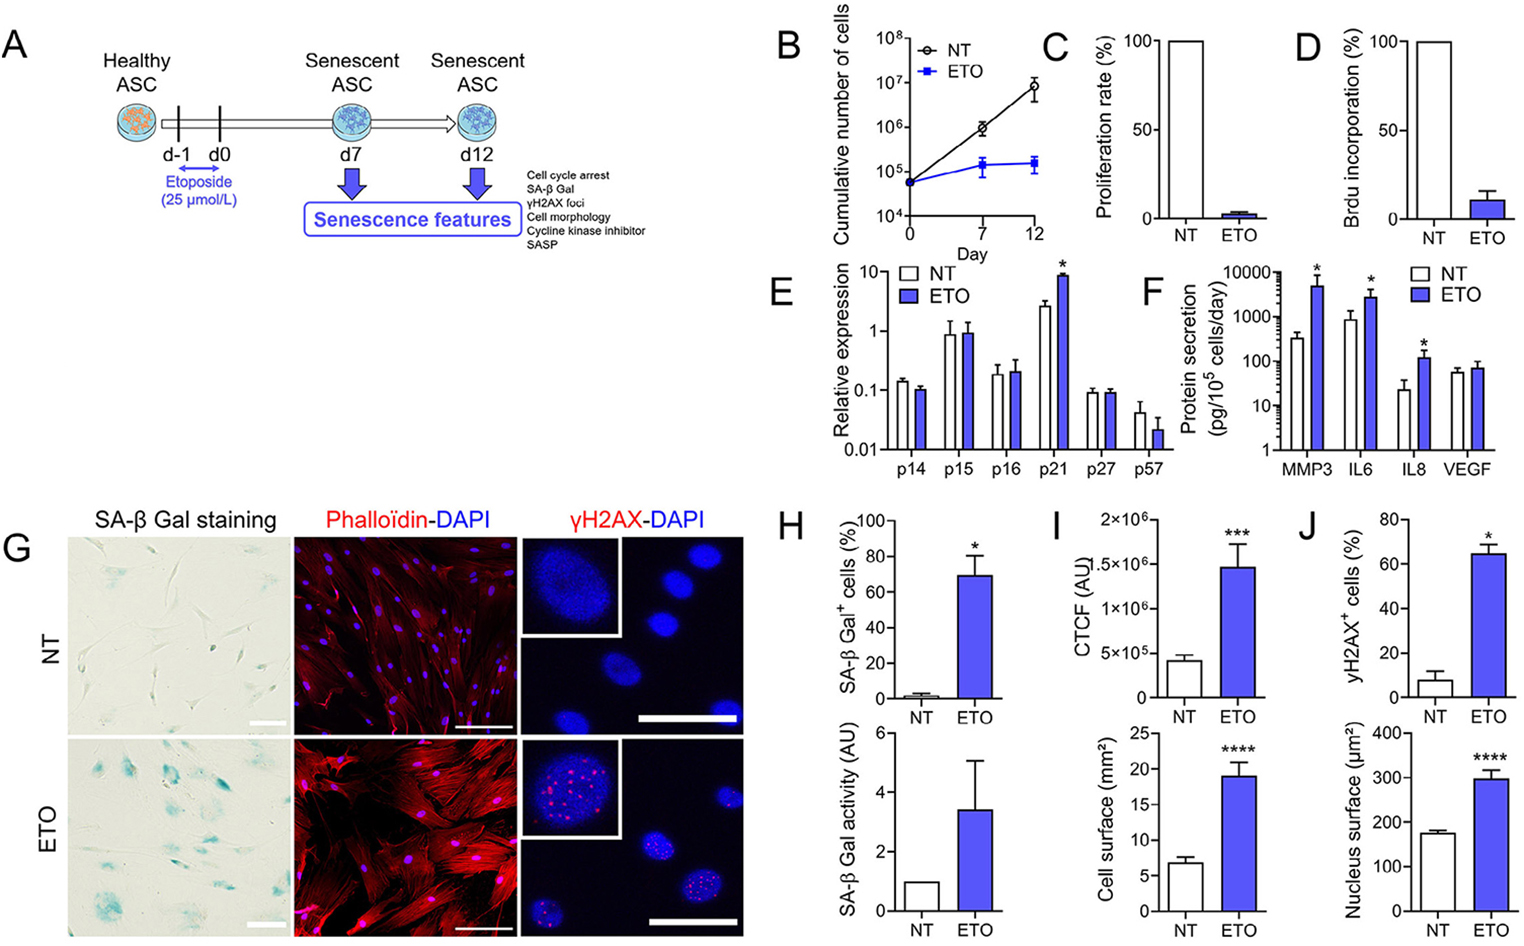
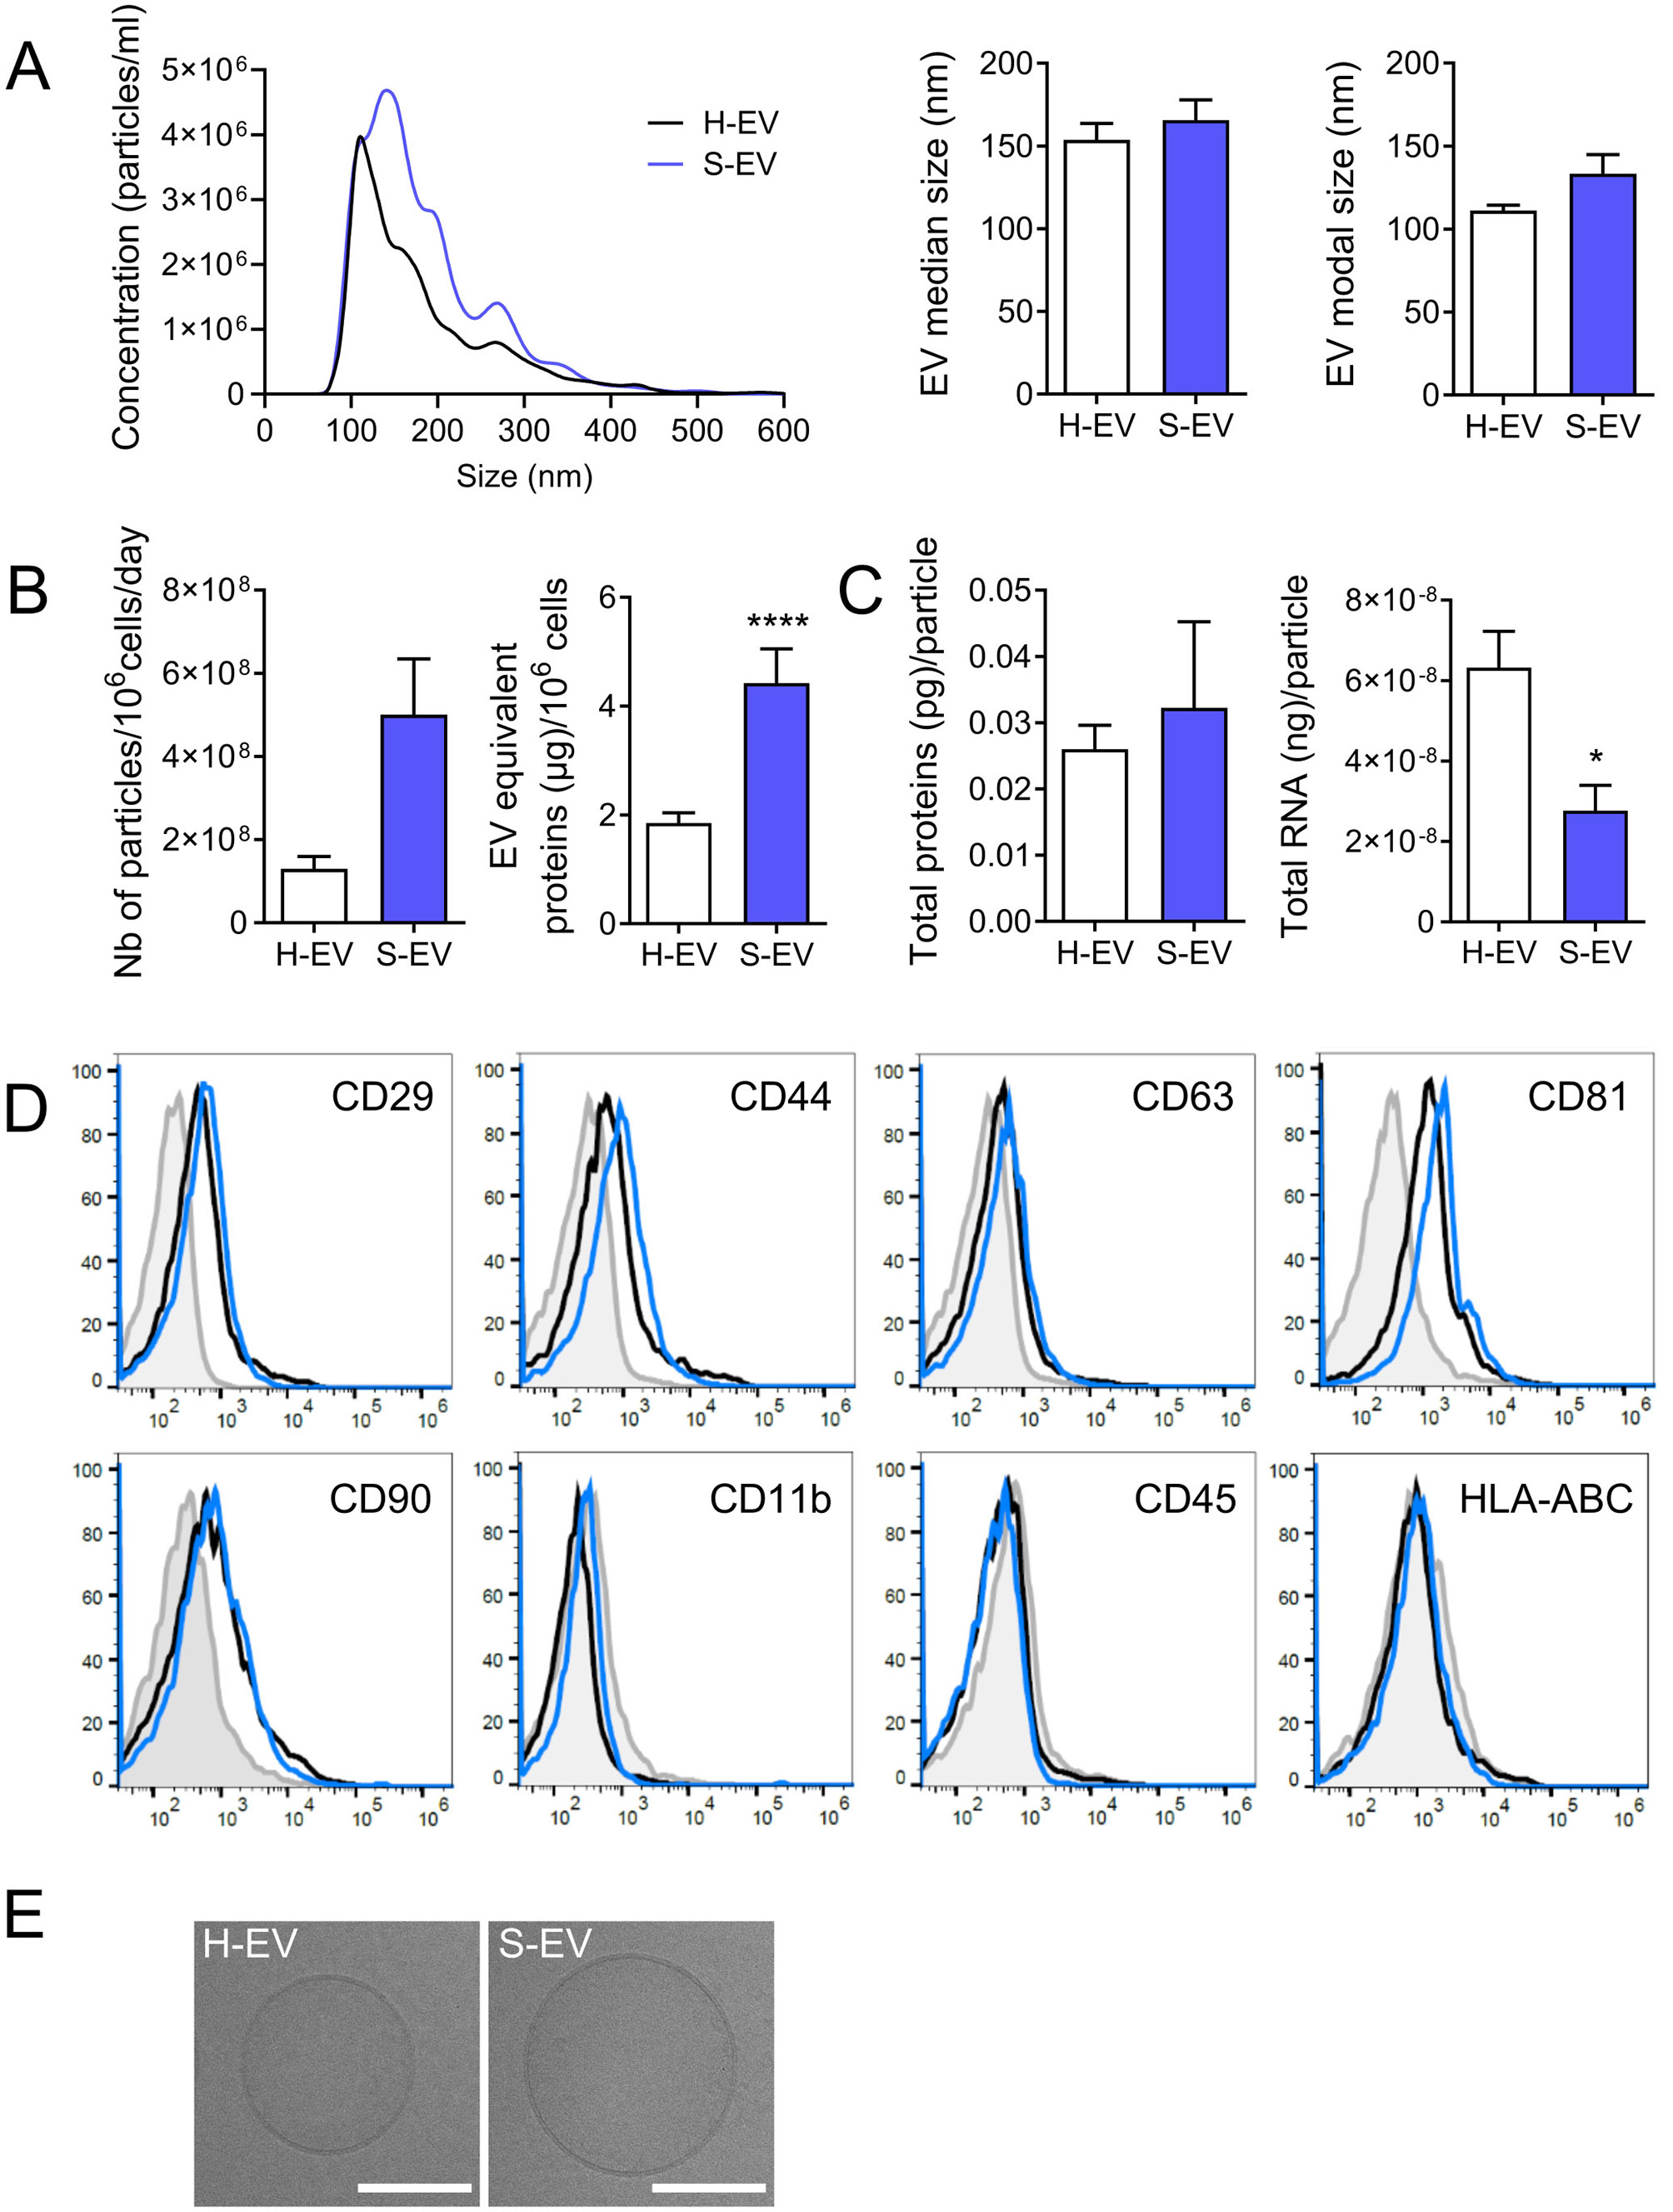
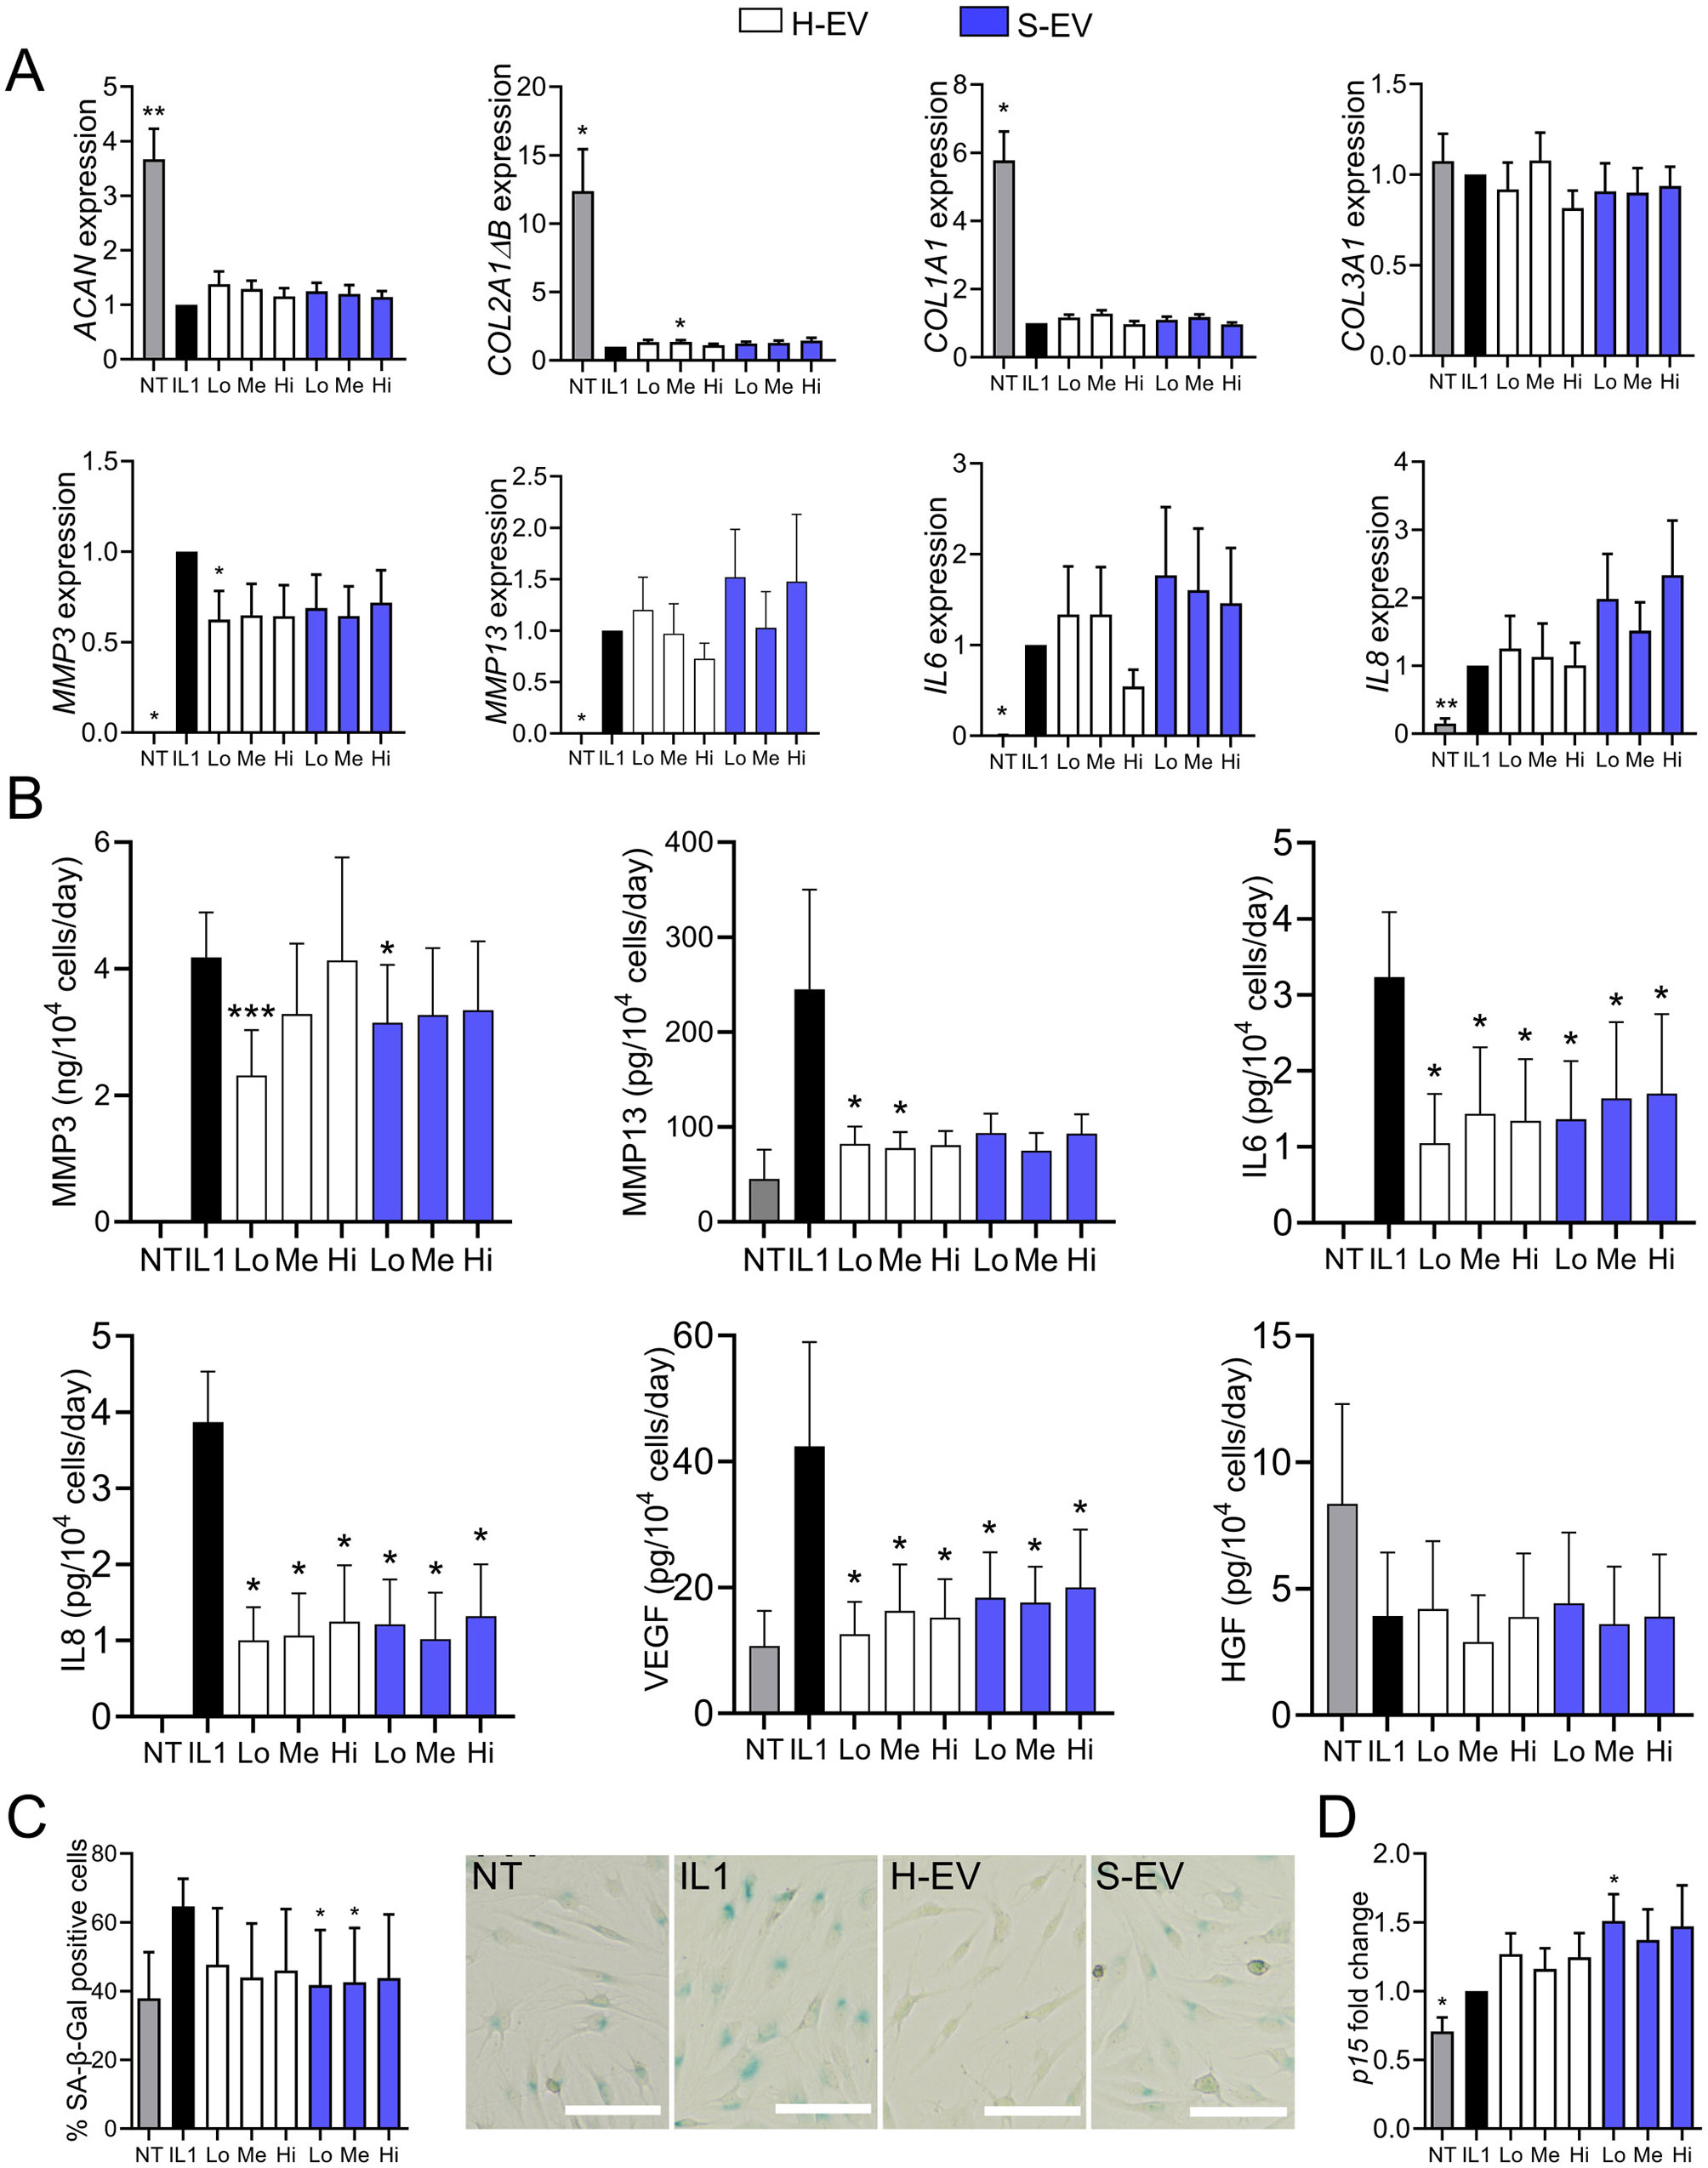
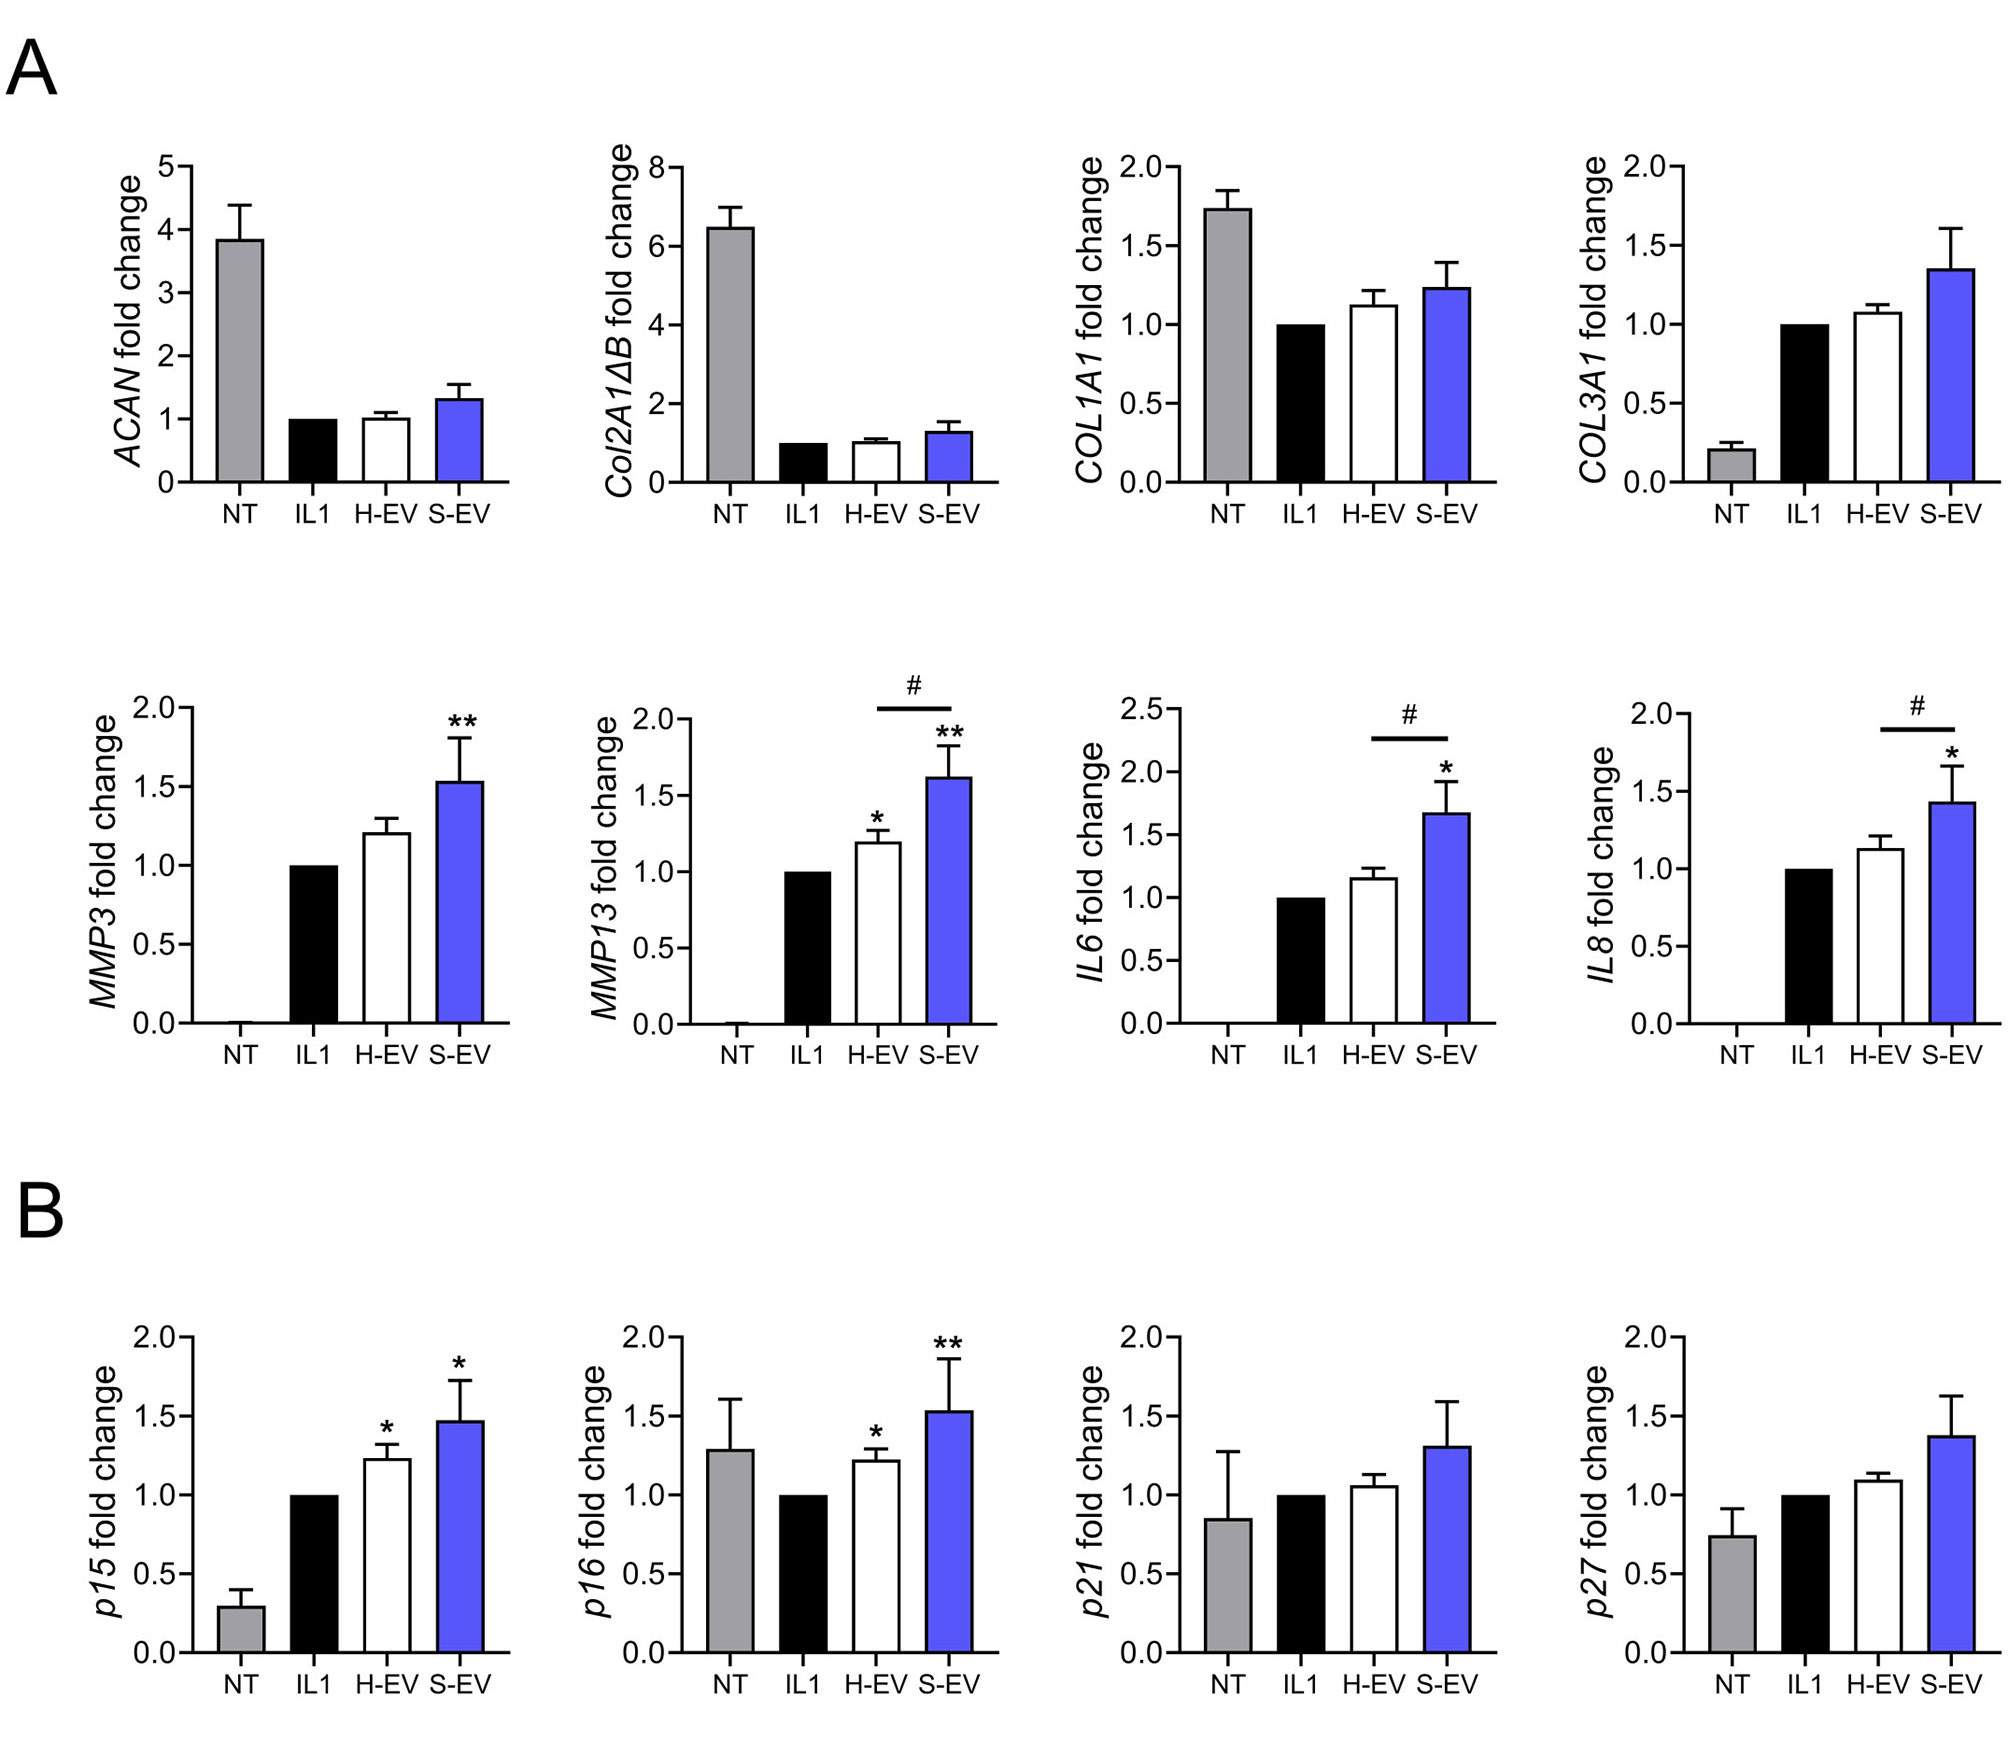
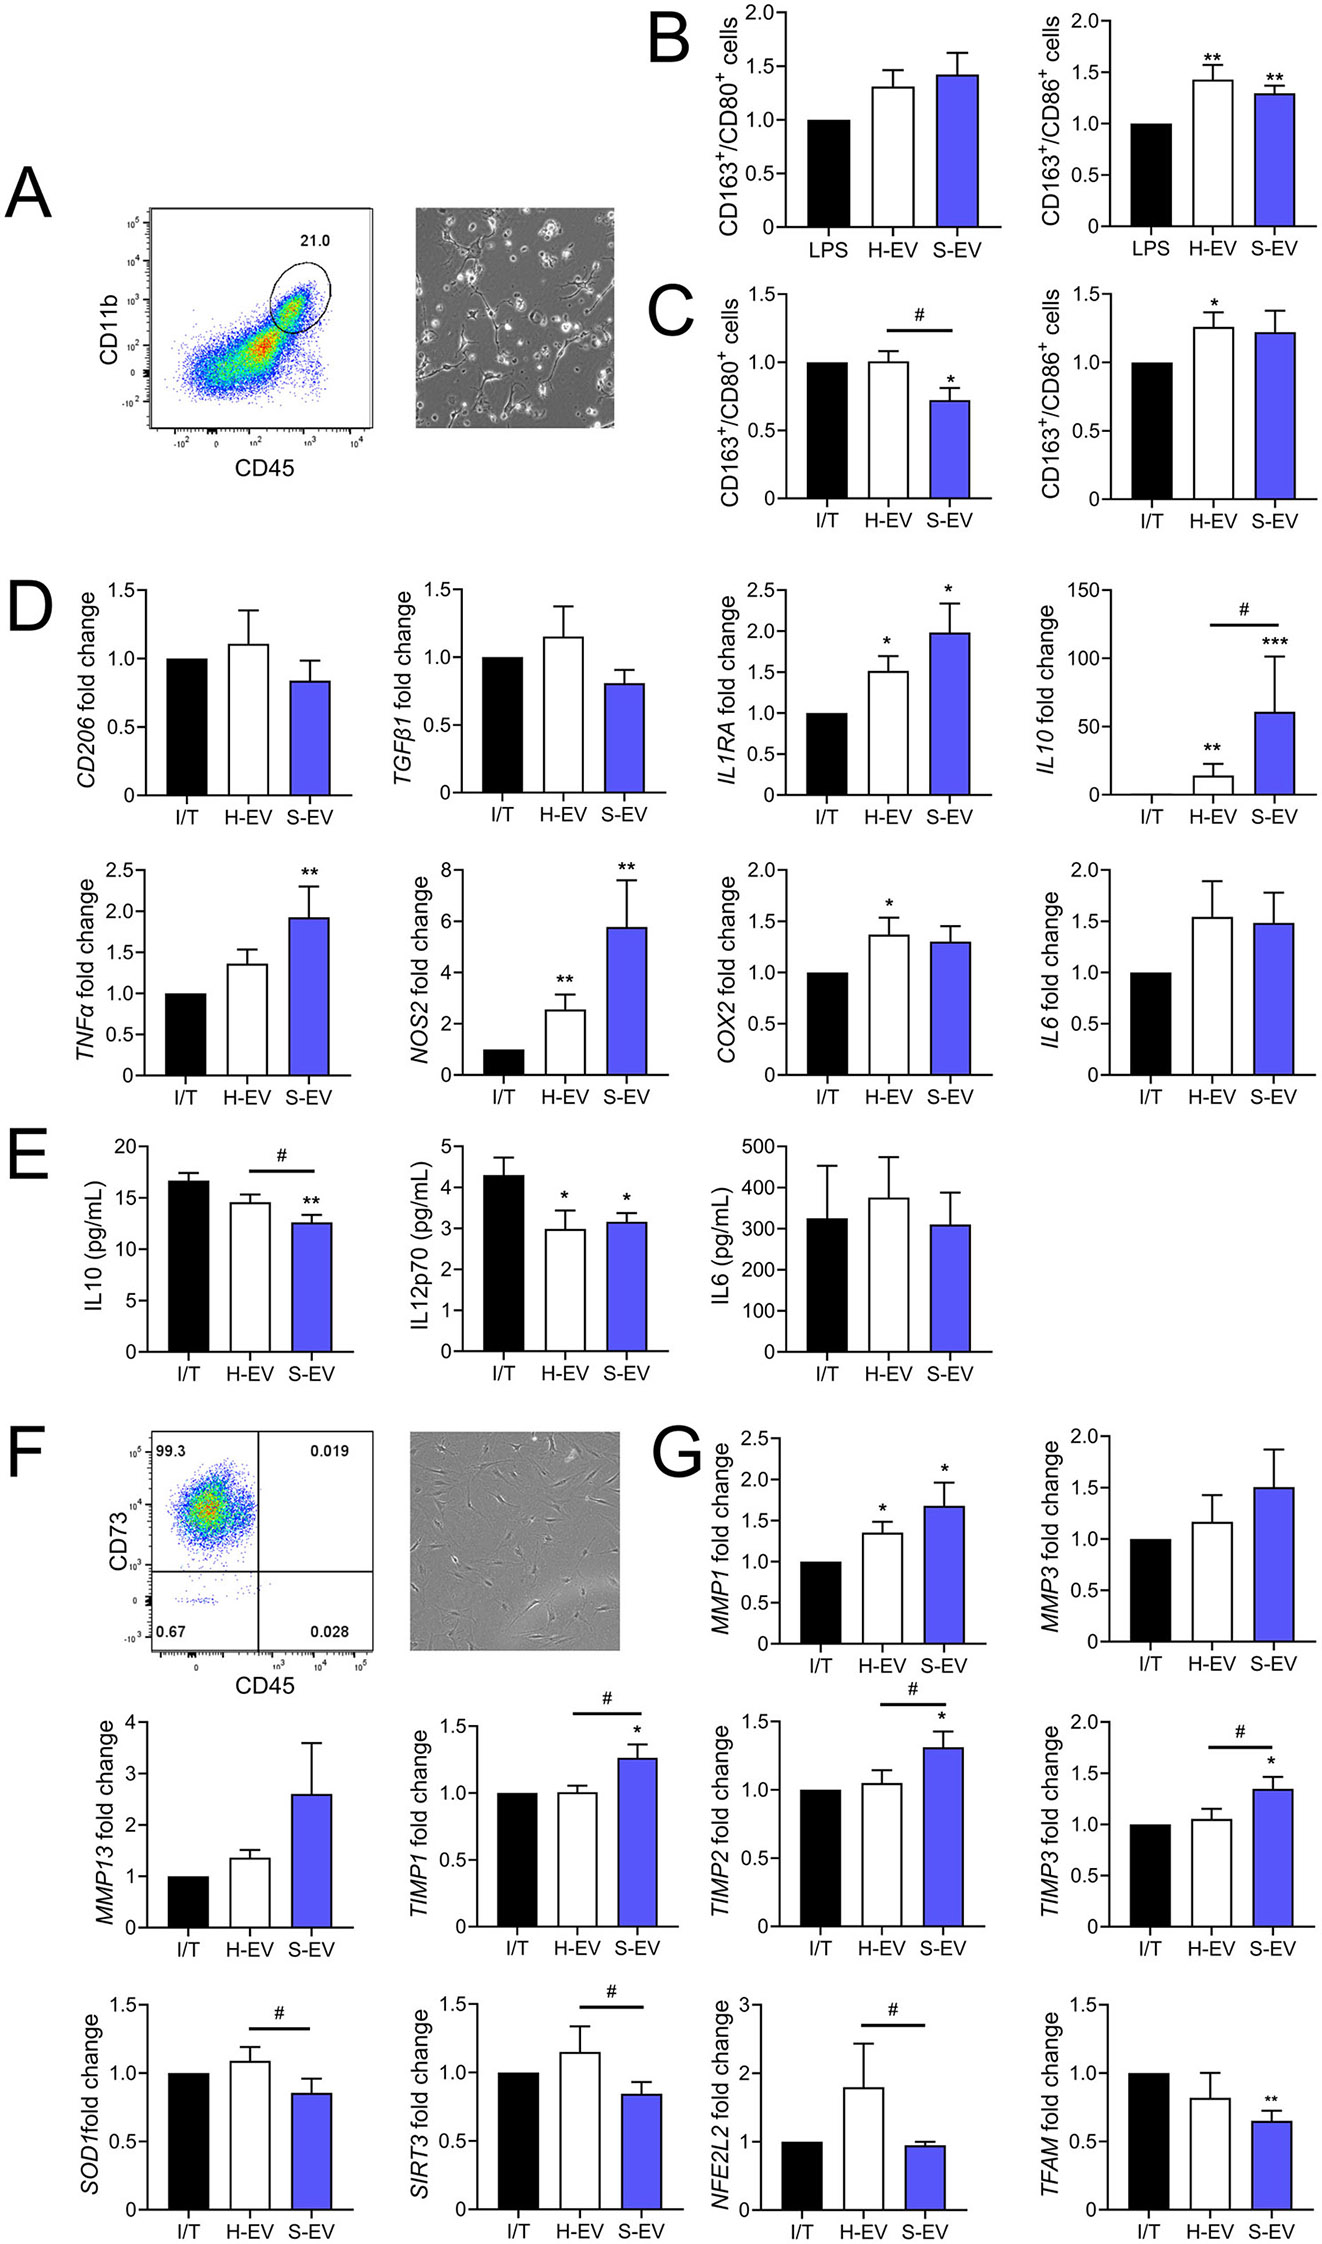
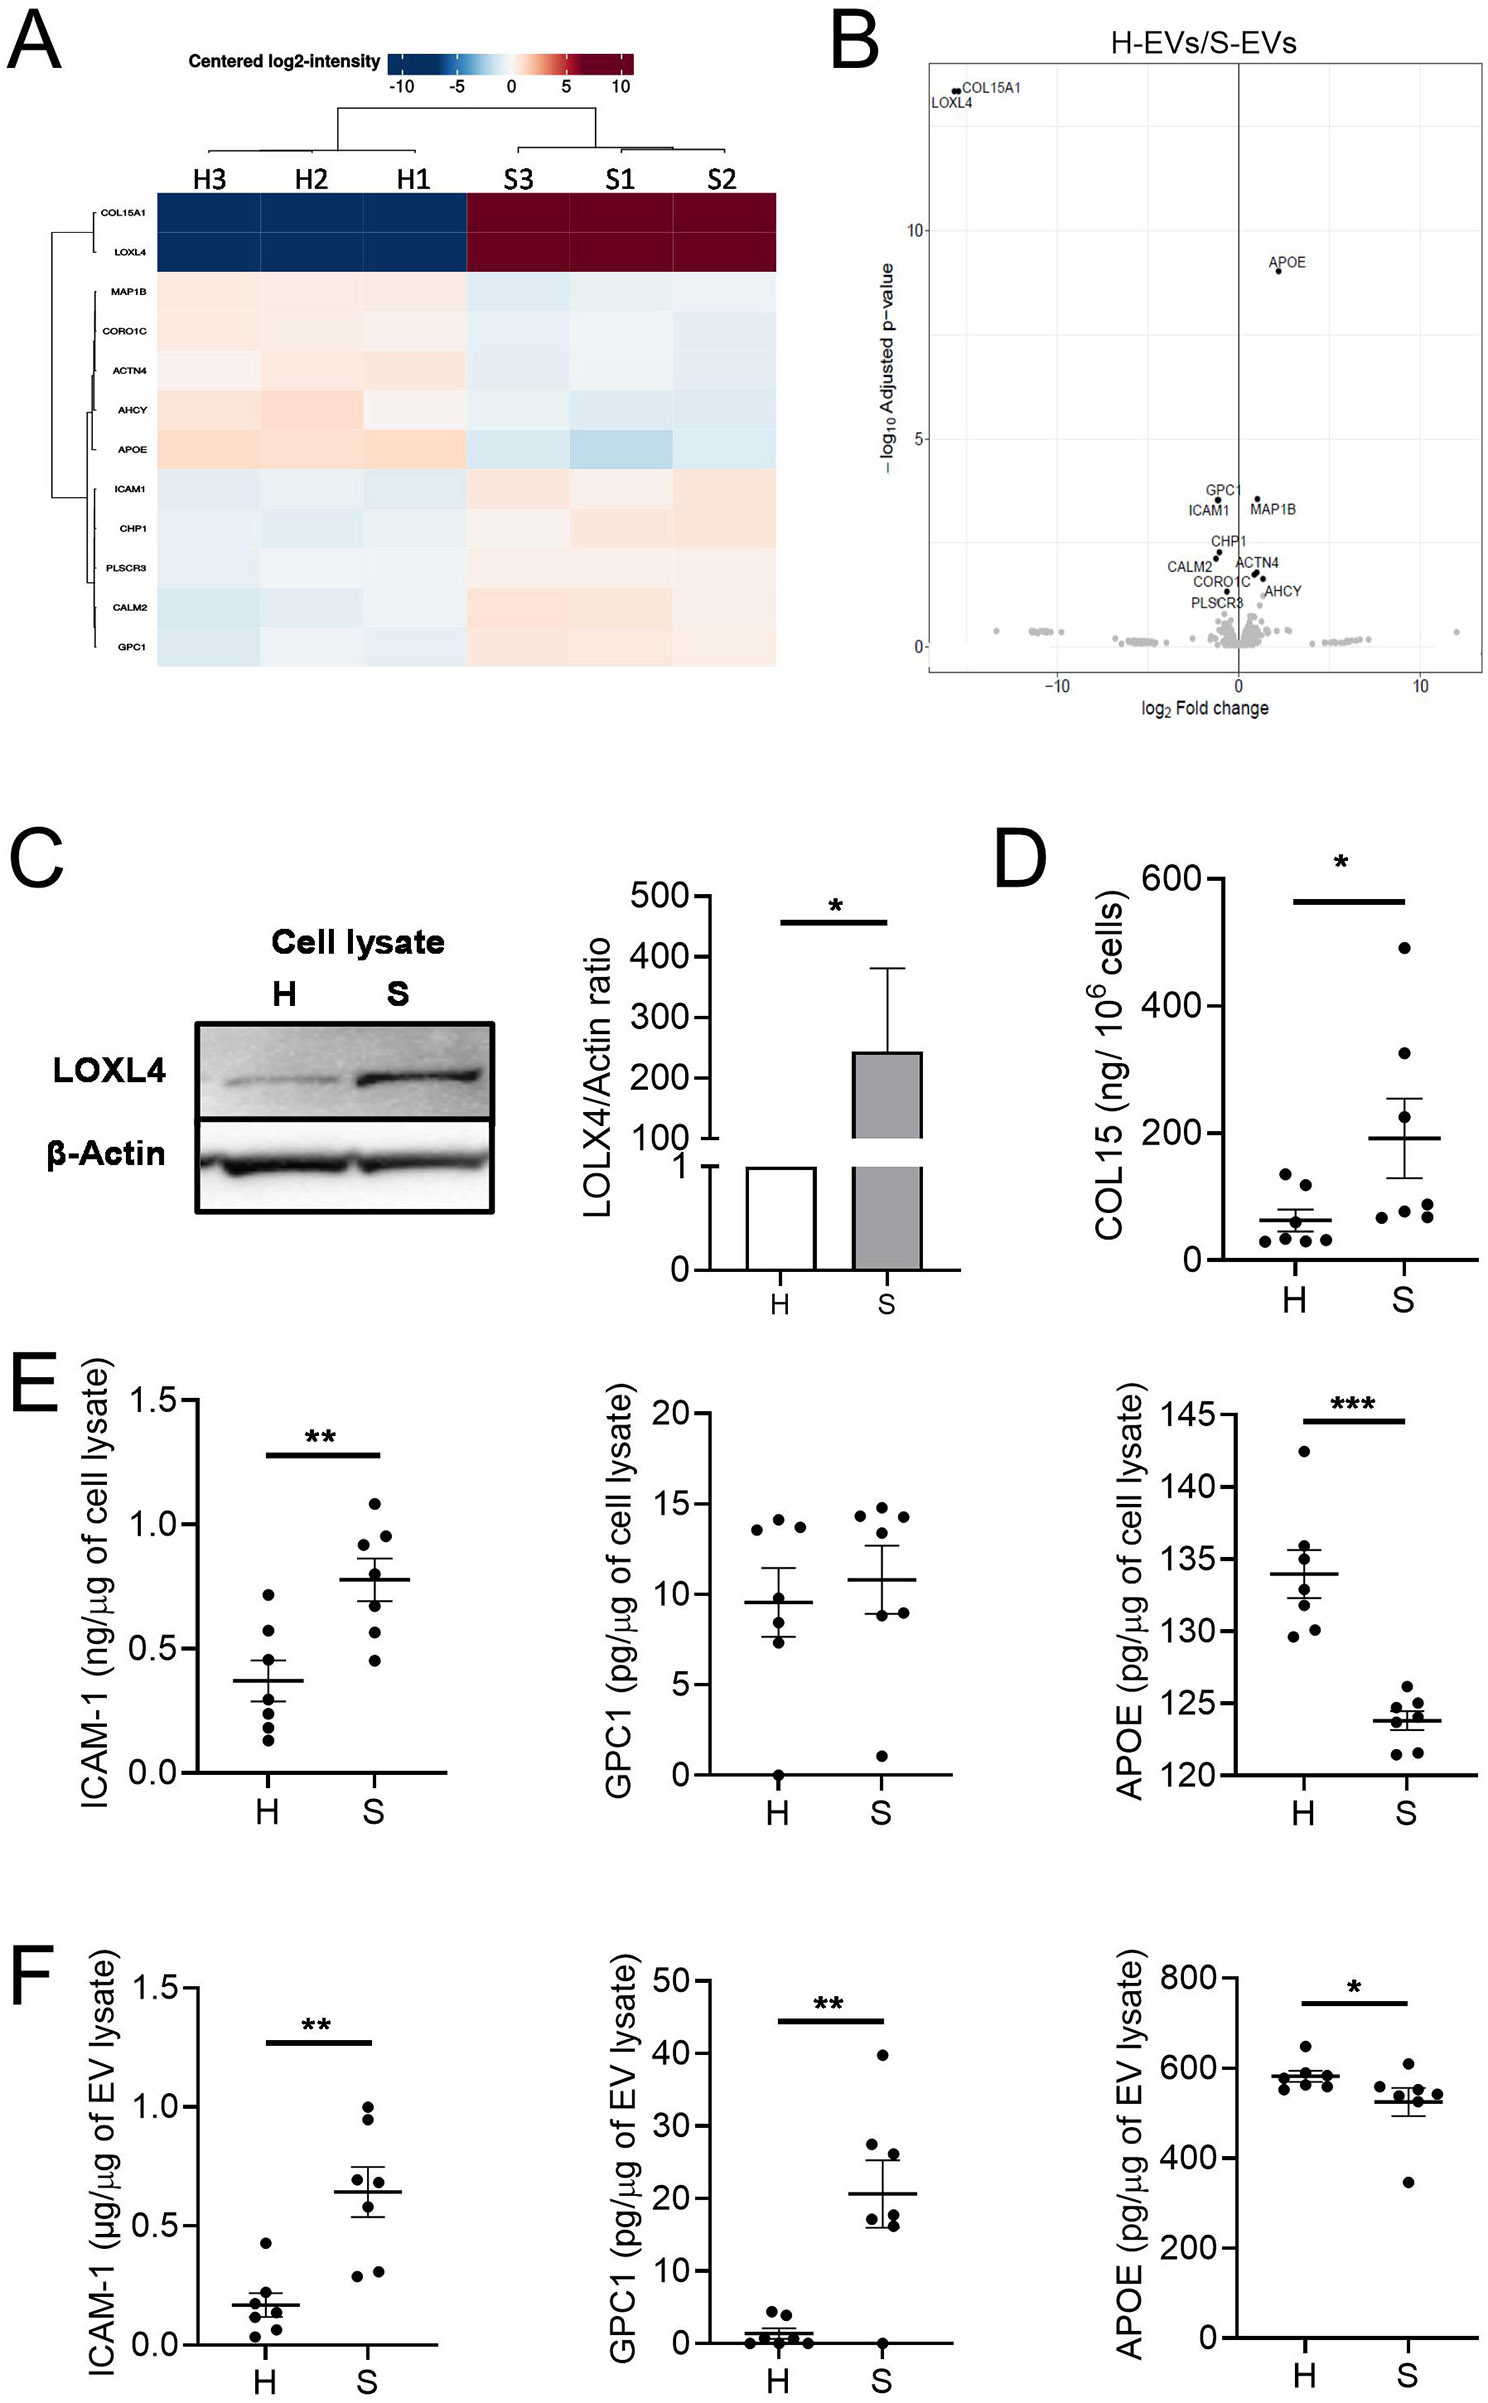
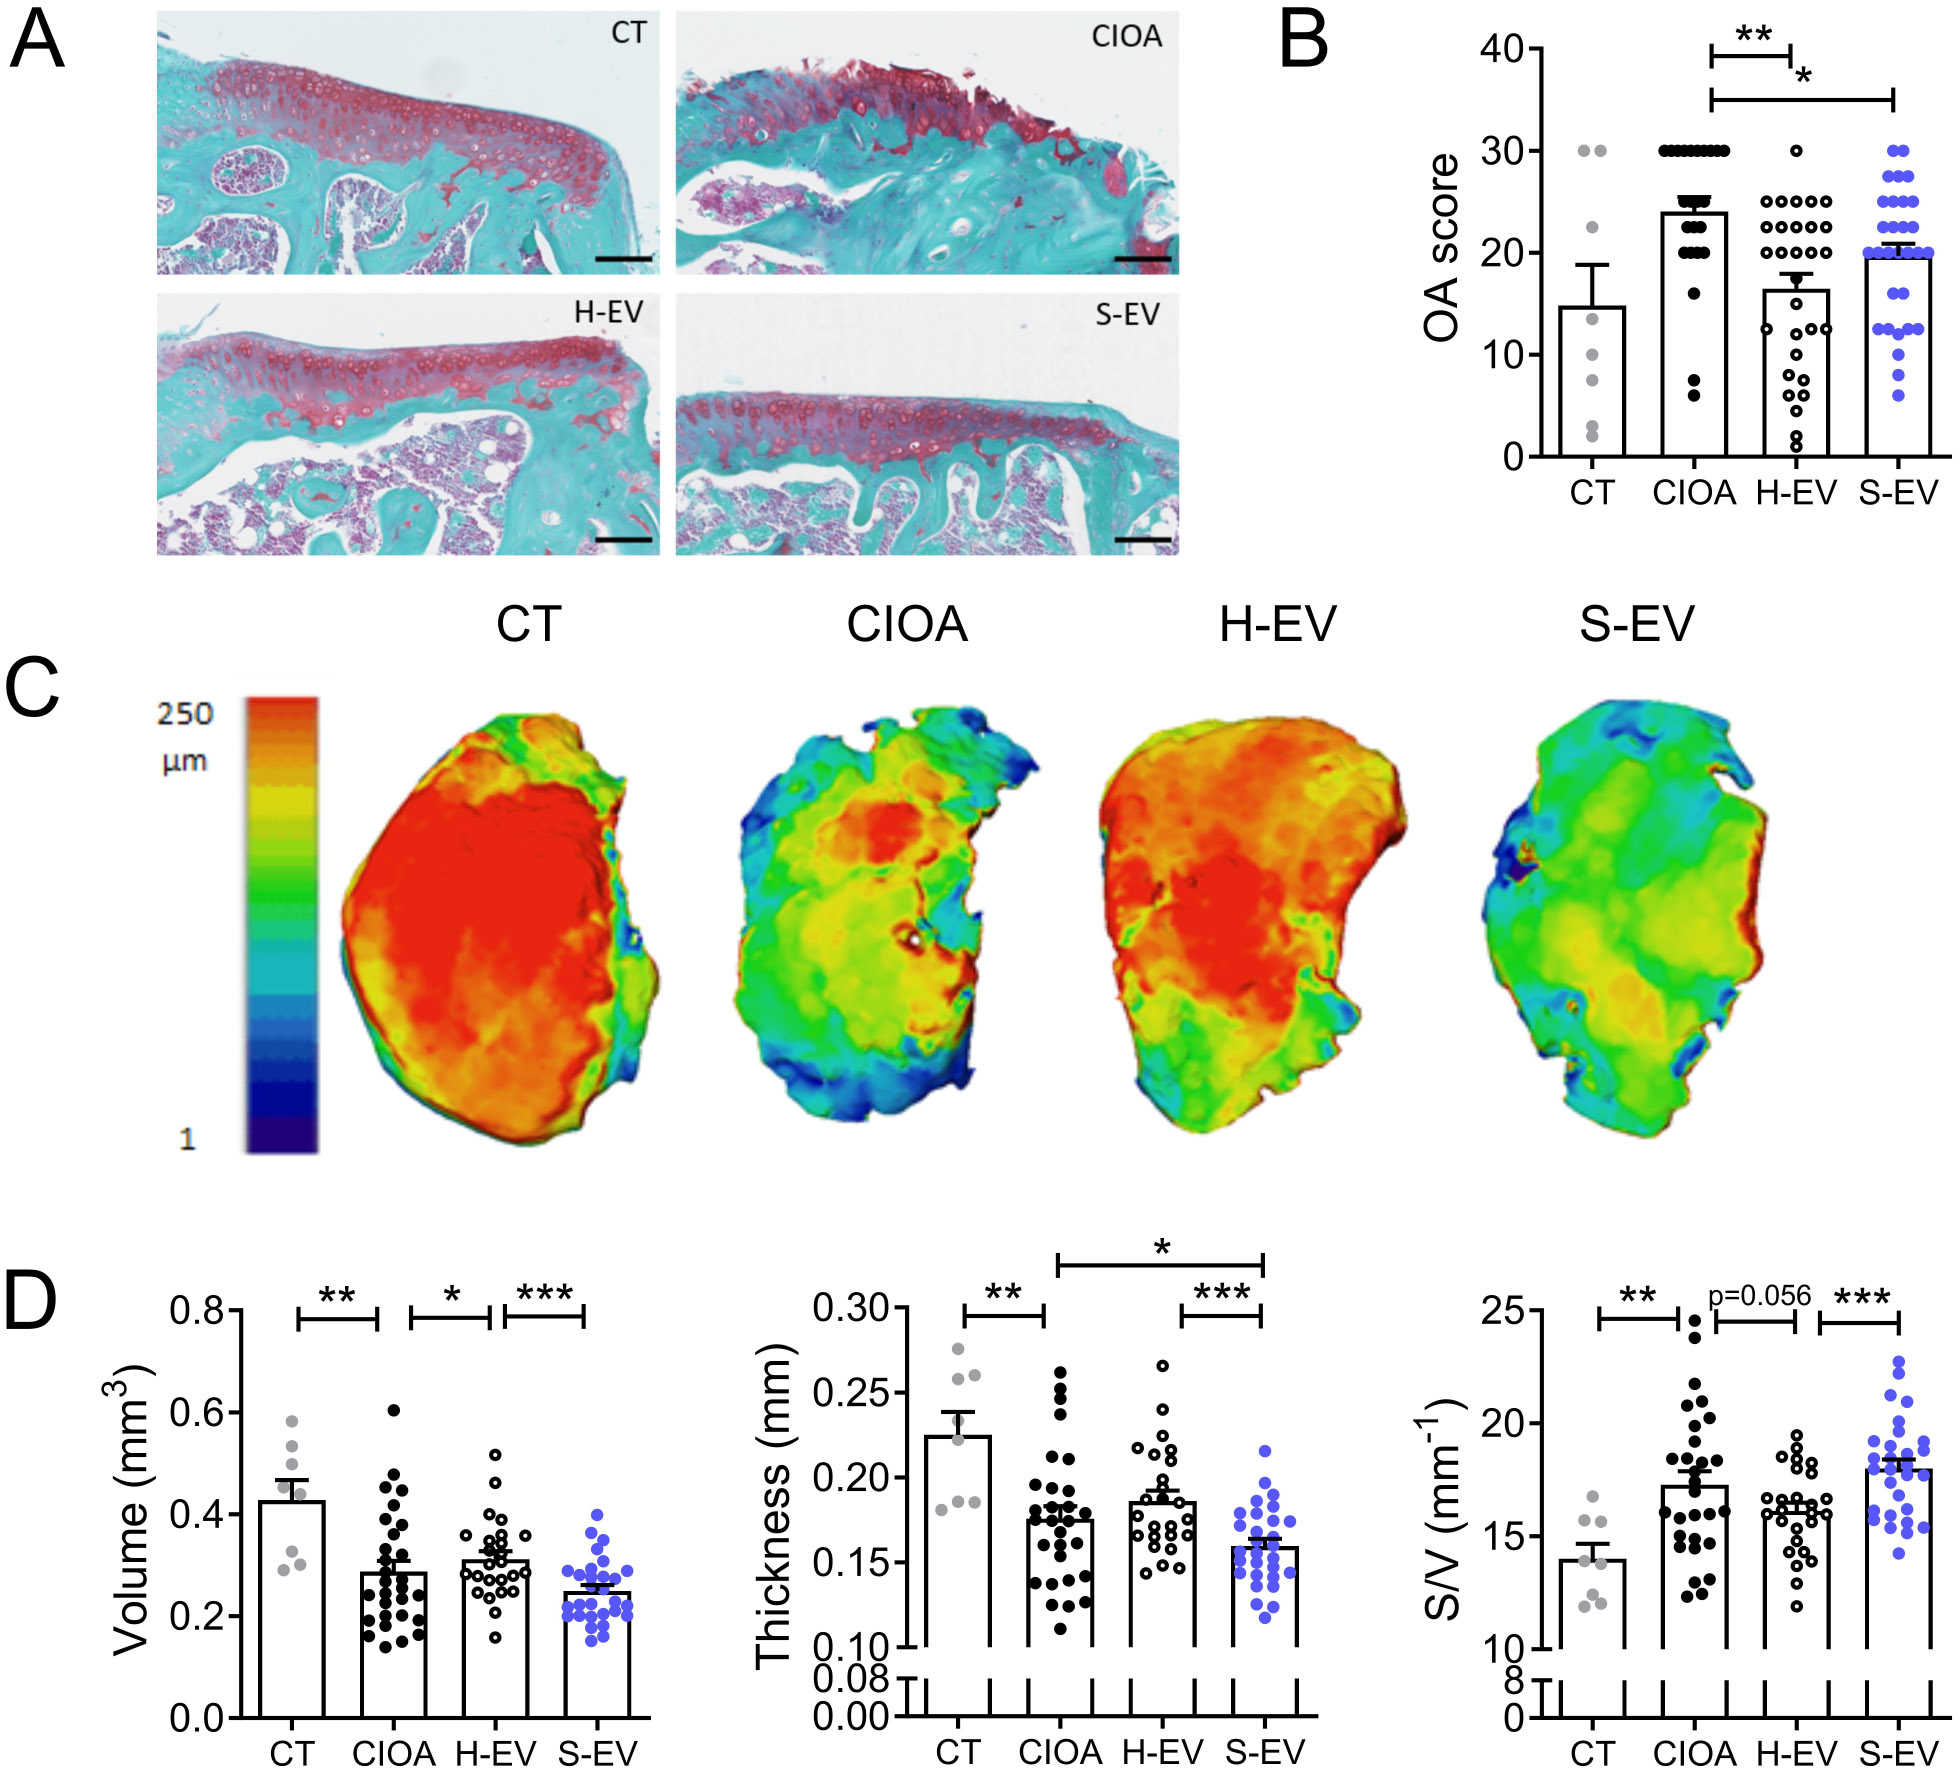
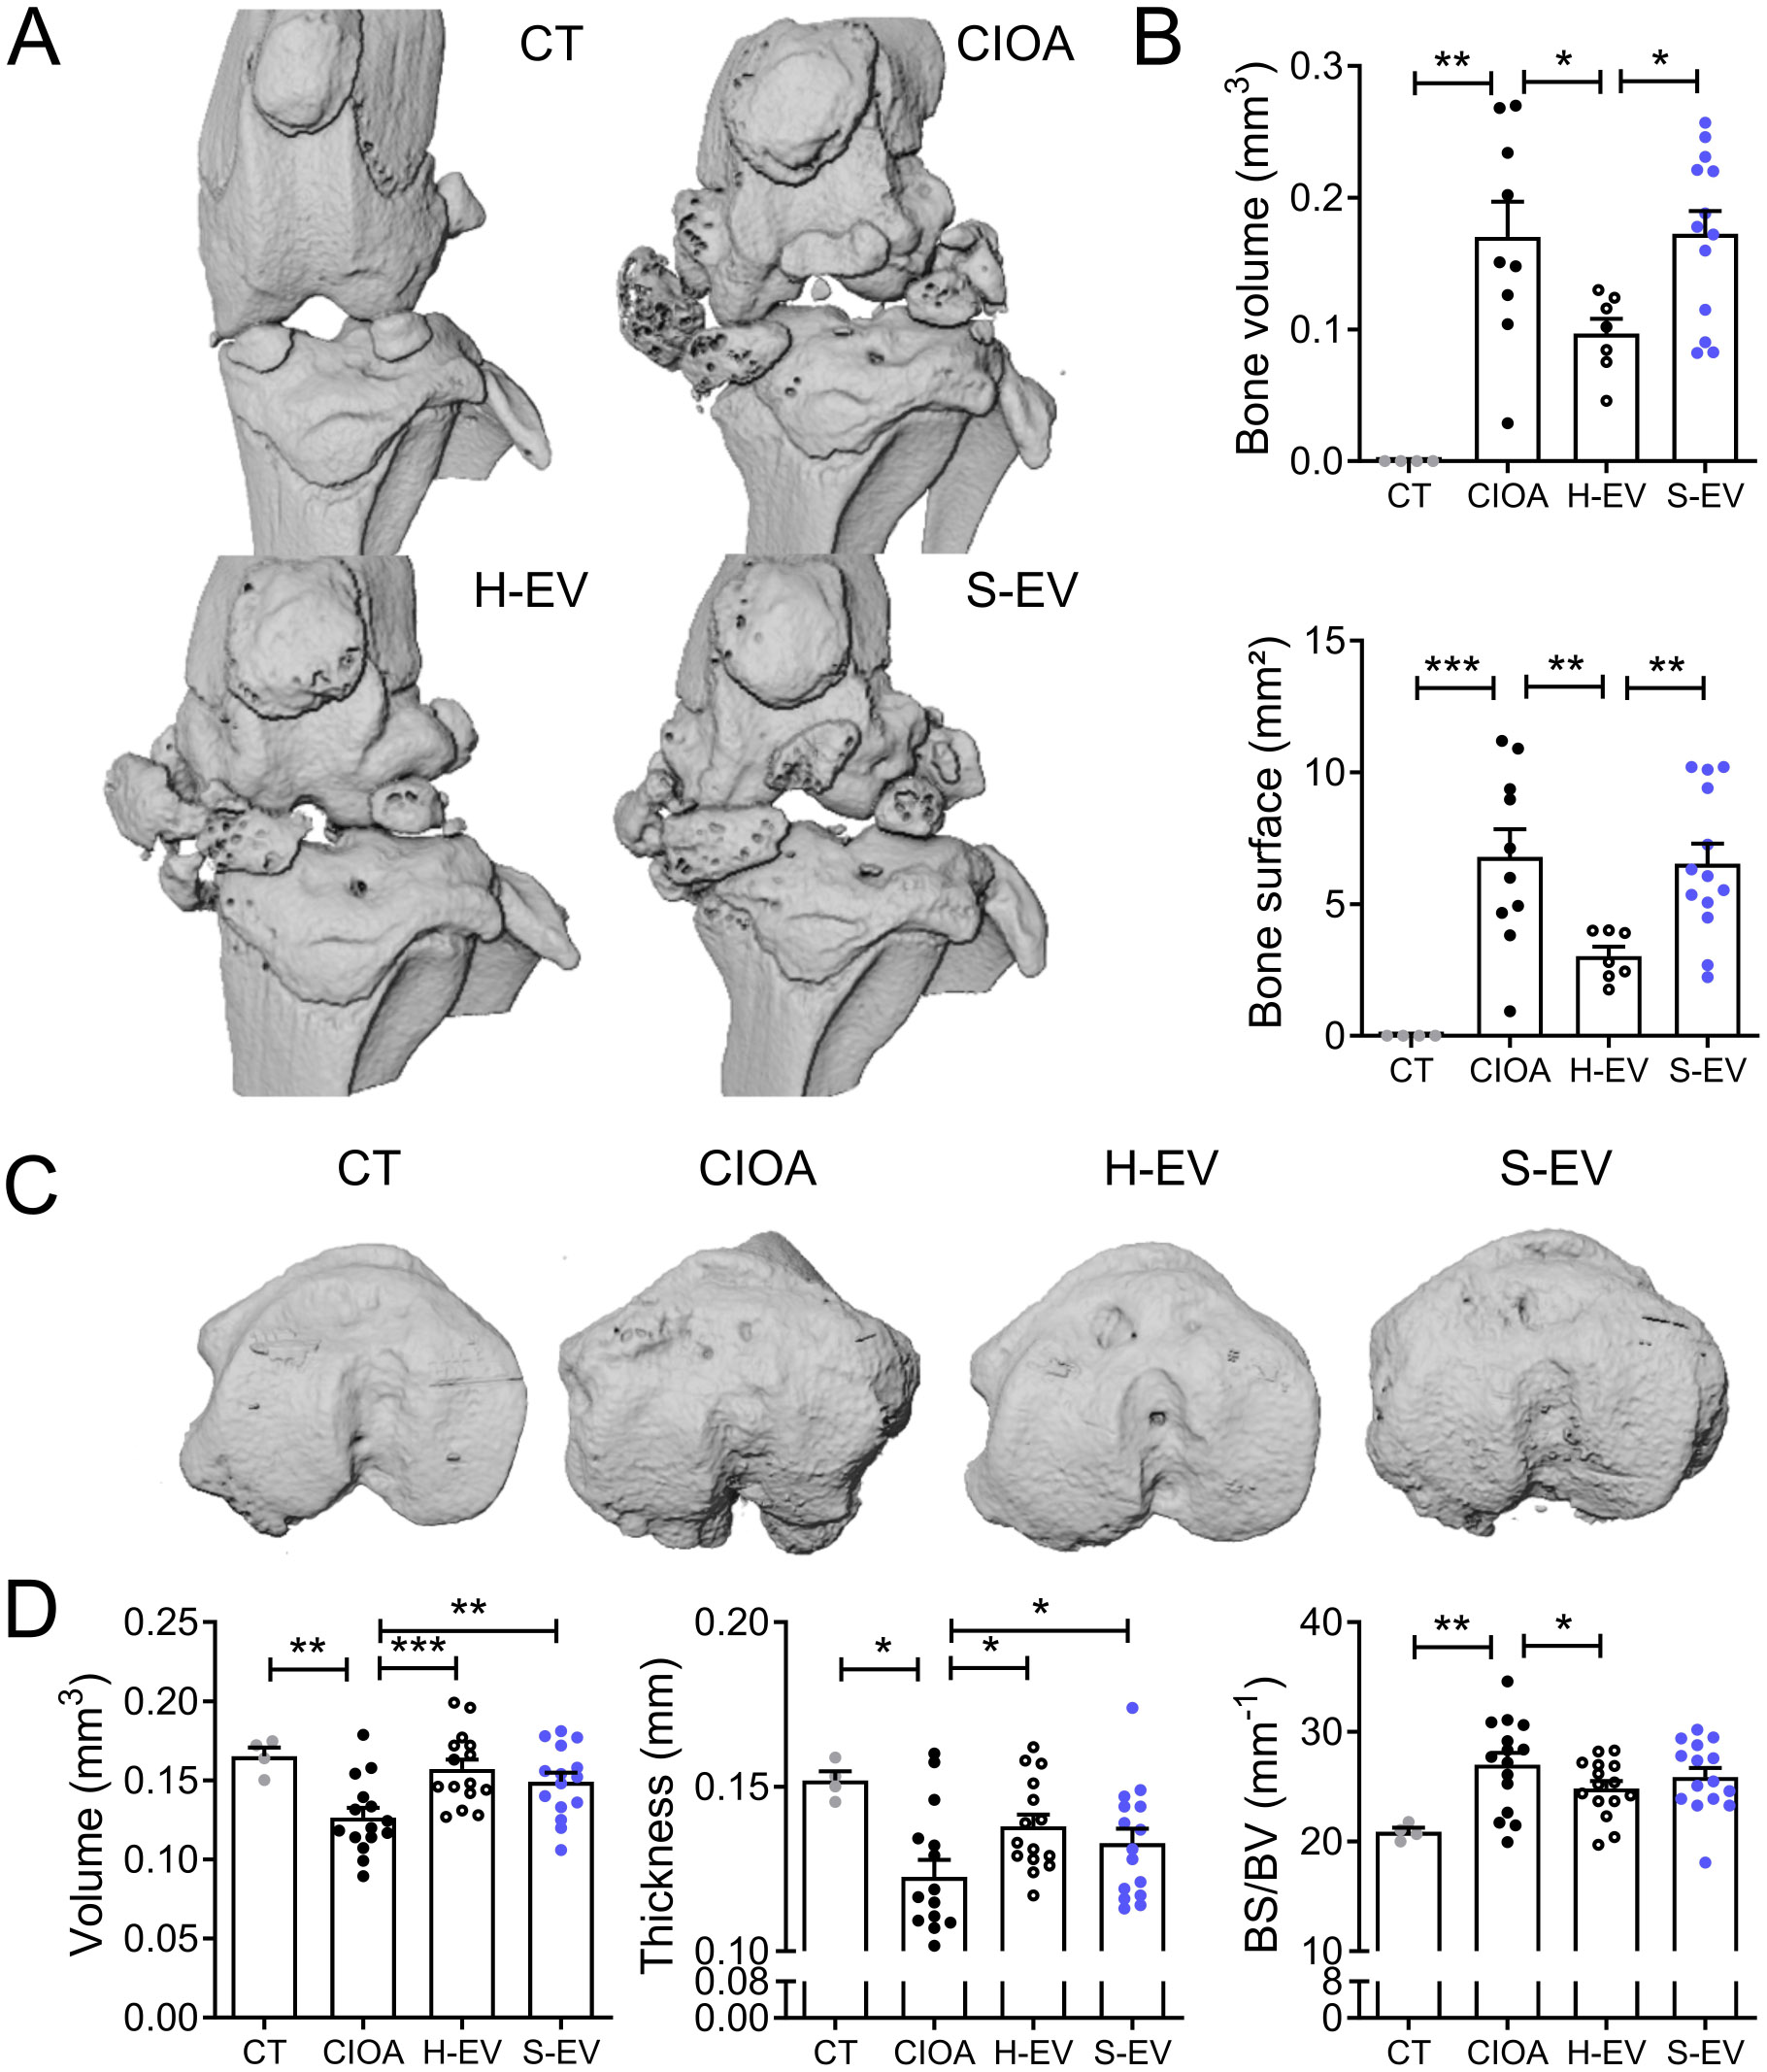
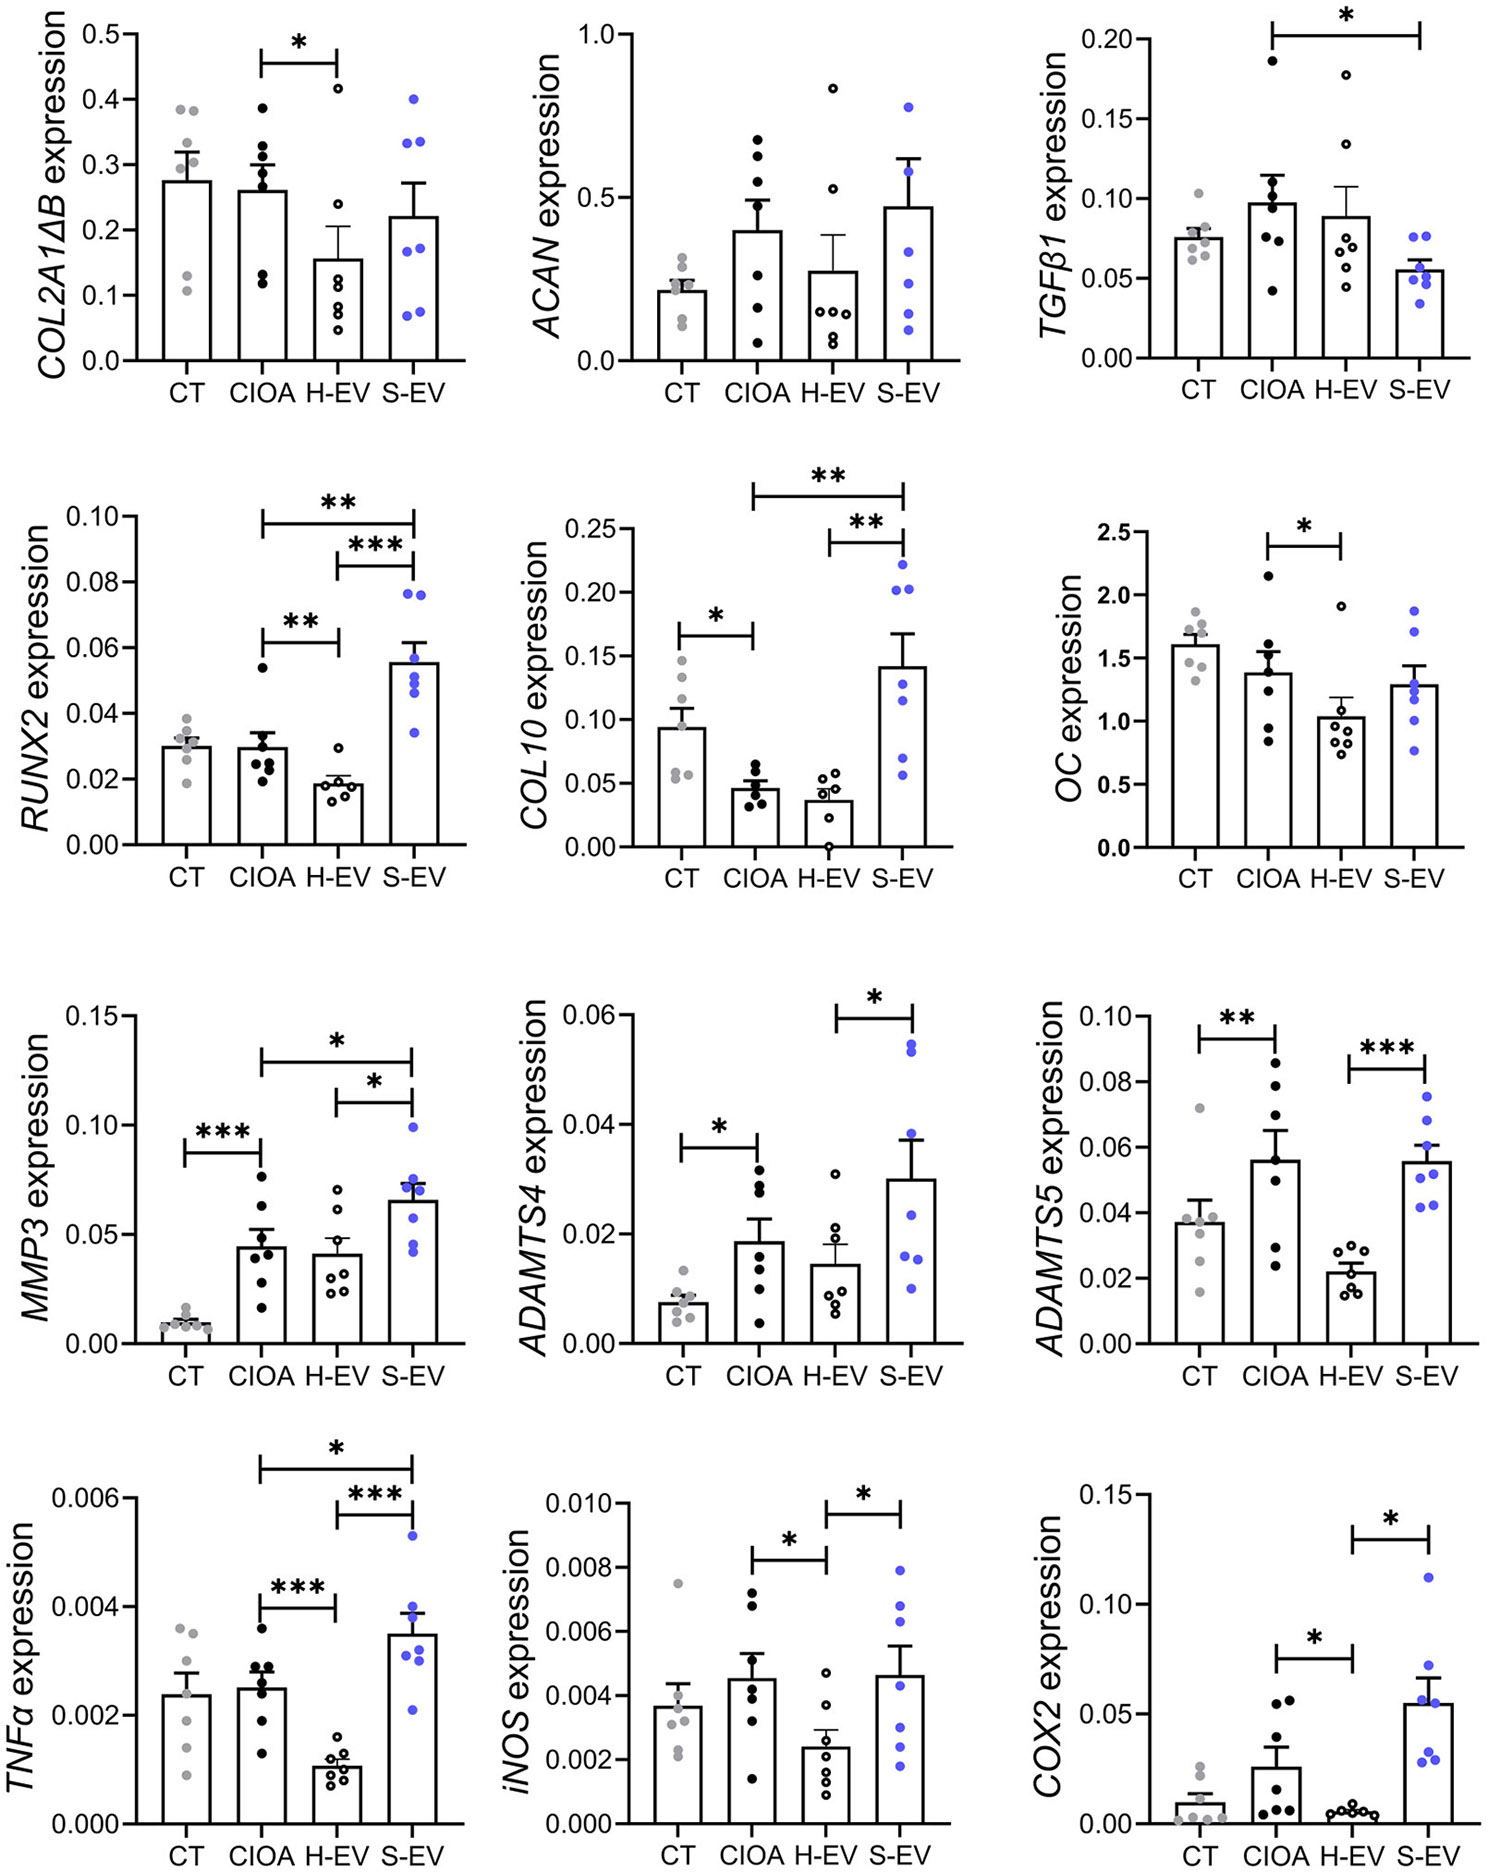
Age is the most important risk factor in degenerative diseases such as osteoarthritis (OA), which is associated with the accumulation of senescent cells in the joints. Here, we aimed to assess the impact of senescence on the therapeutic properties of extracellular vesicles (EVs) from human fat mesenchymal stromal cells (ASCs) in OA. We generated a model of DNA damage-induced senescence in ASCs using etoposide and characterized EVs isolated from their conditioned medium (CM). Senescent ASCs (S-ASCs) produced 3-fold more EVs (S-EVs) with a slightly bigger size and that contain 2-fold less total RNA. Coculture experiments showed that S-ASCs were as efficient as healthy ASCs (H-ASCs) in improving the phenotype of OA chondrocytes cultured in resting conditions but were defective when chondrocytes were proliferating. S-EVs were also impaired in their capacity to polarize synovial macrophages towards an anti-inflammatory phenotype. A differential protein cargo mainly related to inflammation and senescence was detected in S-EVs and H-EVs. Using the collagenase-induced OA model, we found that contrary to H-EVs, S-EVs could not protect mice from cartilage damage and joint calcifications, and were less efficient in protecting subchondral bone degradation. In addition, S-EVs induced a pro-catabolic and pro-inflammatory gene signature in the joints of mice shortly after injection, while H-EVs decreased hypertrophic, catabolic and inflammatory pathways. In conclusion, S-EVs are functionally impaired and cannot protect mice from developing OA.

Keywords: Aging; Extracellular vesicle; Mesenchymal stromal cell; Osteoarthritis; Regenerative medicine; Senescence.


Conflict of interest statement

The authors declare no conflict of interest.

Figures

Fig. 1
Fig. 1
Etoposide-induced senescence in human ASCs. (A) Schematic protocol for etoposide-induced senescence in ASCs. (B) Cumulative number of ASCs in non-treated (NT) and etoposide (ETO)-treated ASCs (n = 3). (C) Proliferation rate of NT and ETO ASCs at day 12 (n = 3). (D) Percentage of BrdU incorporation in NT and ETO ASCs at day 12 (n = 3). (E) Relative expression of Cyclin-Dependent Kinase Inhibitors (p14ARF, p15INK4b, p16INK4a, p27KIP1 and p57KIP2) in NT or ETO ASCs at day 12 (n = 3). (F) Amounts of proteins secreted by NT and ETO ASCs quantified by ELISA (n = 6). (G) Representative pictures of SA-β-Galactosidase (SA-β-Gal in blue, bars: 100 μm) staining, phalloidin/DAPI (actin stress fibers in red and nuclei in blue; bars: 100 μm) and γH2AX/DAPI (γH2AX foci in red and nuclei in blue; bars: 50 μm) staining in NT and ETO ASCs. (H) Percentage of SA-β-Gal positive ASCs (upper panel) and SA-β-Gal activity quantified by fluorometry (lower panel) (n = 4). (I) Quantification of Corrected Total Cell Fluorescence (CTCF; upper panel) and cell surface (lower panel) stained with fluorescent Phalloidin (n = 9–14). (J) Percentage of ASCs with γH2AX positive foci in the nucleus (upper panel) and quantification of the nucleus surface stained with DAPI (n = 4–12). Data are shown as mean ± SEM. Statistical analysis used the Mann-Whitney test (B, E, F, H: upper panel, I, J) or the one-sample Wilcoxon test (C, D, H: lower panel). *p < 0.05, ***p < 0.001, ****p < 0.0001
Fig. 2
Fig. 2
Characterization of extracellular vesicles isolated from human ASCs. (A) Size distribution of EVs isolated from healthy ASCs (H) or ETO-induced senescent ASCs (S) by Nano Tracking Analysis. The median and modal sizes of EVs are shown in the middle and right panels, respectively (n = 3). (B) EV numbers produced by 1 million ASCs per day (left panel) (n = 3) or EV equivalent in µg of proteins produced by 1 million ASCs (right panel) (n = 20–23). (C) Quantity of total proteins (left panel) and total RNA (right panel) produced per particle (n = 3). (D) Expression profile of membrane markers on the surface of H-EVs (black line), S-EVs (Blue line) or isotypic control (grey histogram) by FACS. (E) Representative pictures of H-EVs and S-EVs by cryo-transmission electron microscopy (scale bar: 100 nm). Data are shown as mean ± SEM. Statistical analysis used the Mann-Whitney test. *p < 0.05, ****p < 0.0001
Fig. 3
Fig. 3
Senescent ASC-EVs exert a chondroprotective effect on OA chondrocytes cultured in resting conditions. Primary human chondrocytes were pretreated with 10 ng/mL IL1β (IL1) or not (NT) for 48 h. Different amounts (Low (Lo): 100 ng; Medium (Me): 500 ng; High (Hi): 2.5 µg) of EVs from healthy or senescent ASCs (H-EV or S-EV) were added for 7 days. (A) Expression of chondrocyte markers as expressed as fold change (n = 7). (B) Quantification of several factors in the culture supernatants by ELISA (n = 7). (C) Percentage of SA-β-Gal positive chondrocytes (left panel) and representative pictures of each group (right panel; H-EV and S-EV stand for medium EV dose for each type of EV) (n = 7). (D) Expression of the CDKI as expressed as fold change (n = 7). Data are shown as mean ± SEM. Statistical analysis used the one-sample Wilcoxon test (A, D) the t-test (B) or the Mann-Whitney test (C) comparing the treated sample to the IL1β control. *p < 0.05
Fig. 4
Fig. 4
Senescent ASC-EVs lose their chondroprotective effect on OA chondrocytes when cultured in proliferating conditions. Primary human chondrocytes were pretreated with 10 ng/mL IL1β (IL1) or not (NT) for 24 h and EVs (Medium dose: 500 ng) from healthy or senescent ASCs (H-EV or S-EV) were added for 48 days. (A) Expression of chondrocyte markers as expressed as fold change (n = 10). (B) Expression of CDKIs as expressed as fold change (n = 10). Data are shown as mean ± SEM. Statistical analysis used the one-sample Wilcoxon test comparing the treated sample to the IL1β control (*p < 0.05, **p < 0.01) or the Mann-Whitney test for comparing H-EV and S-EV samples (# p < 0.05)
Fig. 5
Fig. 5
Senescent ASC-EVs induce a pro-inflammatory phenotype in synovial macrophages and alter the phenotype of synovial fibroblasts. Primary human synoviocytes were pretreated with LPS or IFNγ and TNFα (I/T; 20 ng/mL and 10 ng/mL, respectively) for 24 h and EVs (Medium dose: 500 ng) from healthy or senescent ASCs (H-EV or S-EV) were added for 48 days. (A) Representative gating strategy of macrophages (CD11b+ cells in the CD45+ cells) in the synovial cell population and picture of the synovial cells at P0. (B) The average ratio of CD163+/CD80+ and CD163+/CD86+ macrophages after LPS stimulation (n = 12). (C) The average ratio of CD163+/CD80+ and CD163+/CD86+ macrophages after I/T stimulation (n = 10). (D) Expression of macrophage markers as expressed as fold change (n = 10). (E) Quantification of cytokines in the supernatants of I/T-stimulated macrophages by ELISA (n = 8). (F) Representative gating strategy of synovial fibroblasts (CD73+ and CD45 cells) in the synovial cell population and picture of the synovial cells at P4. (G) Expression of markers in fibroblasts as expressed as fold change (n = 9). Data are shown as mean ± SEM. Statistical analysis used the one-sample Wilcoxon test comparing the treated sample to the IL1β control (*p < 0.05, **p < 0.01) or the Mann-Whitney test for comparing H-EV and S-EV samples and in panel F (# p < 0.05)
Fig. 6
Fig. 6
Comparative proteomic analysis reveals differential cargo composition in S-EVs and H-EVs. (A) Heatmap plot and (B) volcano plot of the differential protein contents obtained by mass spectrometry analysis of H-EVs and S-EVs. (C) Detection of LOXL4 on cell lysates by western blot (plot representative of three biological replicates). The graph represents the quantification of the LOXL4 band normalised by the β-actin band, which was used as loading control (n = 3). (D) Detection of COL15 in cell supernatants by ELISA (n = 7). (E) Detection of ICAM-1, GPC1 and APOE in cell lysates by ELISA (n = 7). (F) Detection of ICAM-1, GPC1 and APOE in EV lysates (n = 7). Data are shown as mean ± SEM. Statistical analysis used the Mann-Whitney test for comparing samples pairwise with *p < 0.05, **p < 0.01, ***p < 0.001
Fig. 7
Fig. 7
Senescent EVs fail to inhibit cartilage degradation in the collagenase-induced OA model. (A) Representative histological sections of tibias from control mice (CT), collagenase-treated mice (CIOA) and CIOA mice that received 250 ng EVs from healthy or senescent ASCs (H-EV or S-EV). Safranin O-Fast green staining. (B) Average OA score from histological sections of the different groups of mice. (C) Representative 3D reconstructed images of articular cartilage after confocal laser scanning microscopy analysis. (D) Histomorphometric parameters (volume, thickness, surface/volume) of 3D images of articular cartilage shown in (C). Data are shown as mean ± SEM (n = 8–30). Statistical analysis used the Mann-Whitney test for comparing samples pairwise with *p < 0.05, **p < 0.01, ***p < 0.001
Fig. 8
Fig. 8
Senescent EVs partly fail to inhibit bone alterations in the collagenase-induced OA model. (A) Representative 3D reconstructed images of knee joints from control mice (CT), collagenase-treated mice (CIOA) and CIOA mice that received 250 ng EVs from healthy or senescent ASCs (H-EV or S-EV) after µCT analysis. (B) Histomorphometric parameters of calcifications (bone volume and surface) in knee joints of mice are shown in (A). (C) Representative 3D reconstructed images of sub-chondral bone surface in tibias of the different groups of mice after µCT analysis. (D) Histomorphometric parameters (volume, thickness, surface/volume) of subchondral bone in mice shown in (C). Data are shown as mean ± SEM (n = 4–15). Statistical analysis used the Mann-Whitney test for comparing samples pairwise with *p < 0.05, **p < 0.01, ***p < 0.001
Fig. 9
Fig. 9
Senescent EVs induce a pro-inflammatory and pro-catabolic phenotype in the joints of collagenase-induced OA mice. Relative expression of several markers related to anabolism, catabolism, and inflammation (n = 7/group). Data are shown as mean ± SEM. Statistical analysis used the Mann-Whitney test for comparing samples pairwise with *p < 0.05, **p < 0.01, ***p < 0.001

References

    1. Cisternas MG, Murphy L, Sacks JJ, Solomon DH, Pasta DJ, Helmick CG. Alternative methods for defining Osteoarthritis and the impact on estimating prevalence in a US Population-based survey. Arthritis Care Res (Hoboken). 2016;68:574–80. 10.1002/acr.22721 - DOI - PMC - PubMed
    1. Hootman JM, Helmick CG. Projections of US prevalence of arthritis and associated activity limitations. Arthritis Rheum. 2006;54:226–9. 10.1002/art.21562 - DOI - PubMed
    1. Coryell PR, Diekman BO, Loeser RF. Mechanisms and therapeutic implications of cellular senescence in osteoarthritis. Nat Rev Rheumatol. 2021;17:47–57. 10.1038/s41584-020-00533-7 - DOI - PMC - PubMed
    1. Dolgin E. Send in the senolytics. Nat Biotechnol. 2020;38:1371–7. 10.1038/s41587-020-00750-1 - DOI - PubMed
    1. Desando G, Cavallo C, Sartoni F, Martini L, Parrilli A, Veronesi F, Fini M, Giardino R, Facchini A, Grigolo B. Intra-articular delivery of adipose derived stromal cells attenuates osteoarthritis progression in an experimental rabbit model. Arthritis Res Ther. 2013;15:R22. 10.1186/ar4156 - DOI - PMC - PubMed