. 2024 May 16;12(1):76.
doi: 10.1186/s40478-024-01793-0.

Hyperoside mitigates photoreceptor degeneration in part by targeting cGAS and suppressing DNA-induced microglial activation

Affiliations

Hyperoside mitigates photoreceptor degeneration in part by targeting cGAS and suppressing DNA-induced microglial activation

Daijin Li et al. Acta Neuropathol Commun. .

Abstract

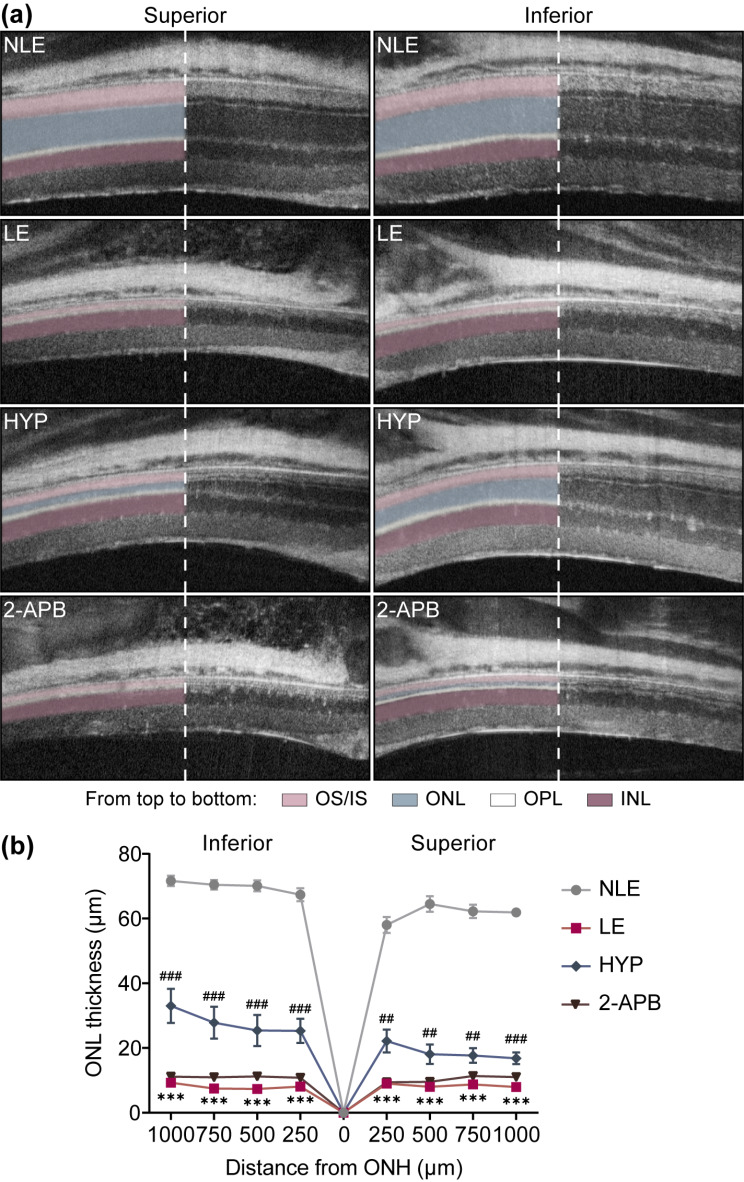
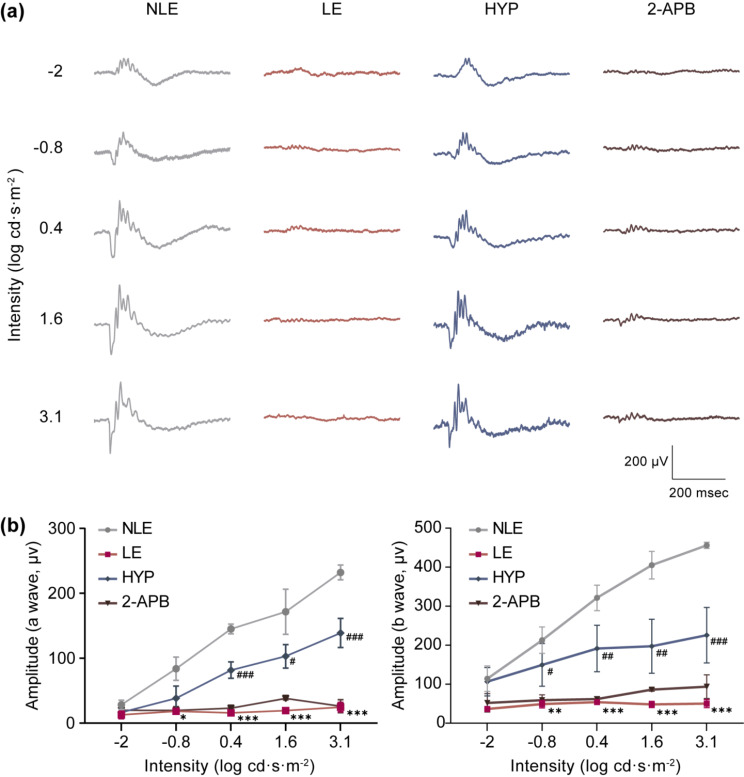
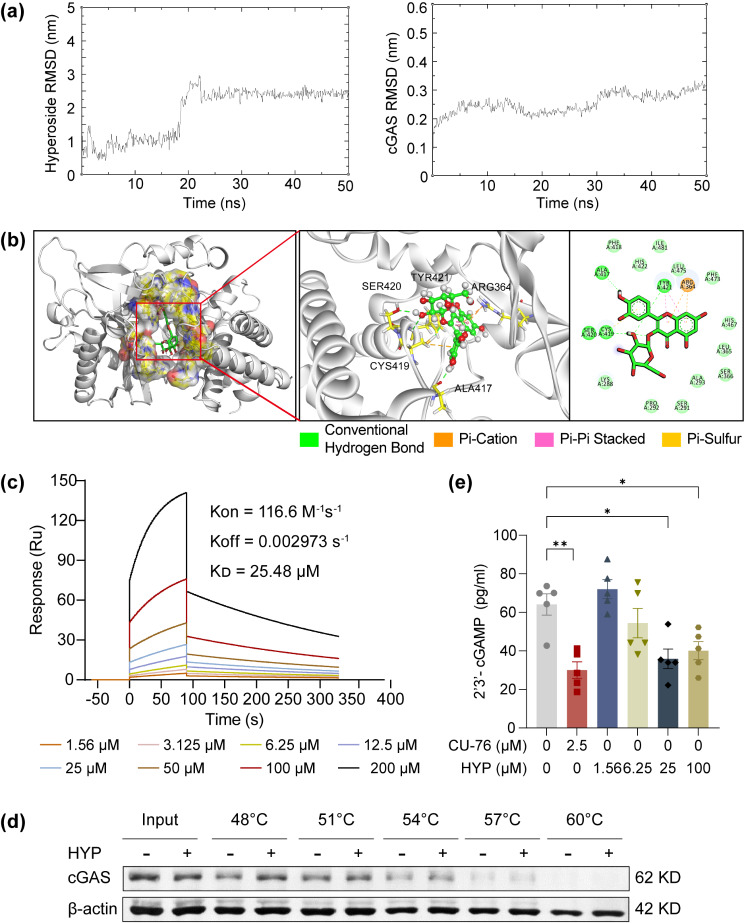
Activated microglia play an important role in driving photoreceptor degeneration-associated neuroinflammation in the retina. Controlling pro-inflammatory activation of microglia holds promise for mitigating the progression of photoreceptor degeneration. Our previous study has demonstrated that pre-light damage treatment of hyperoside, a naturally occurring flavonol glycoside with antioxidant and anti-inflammatory activities, prevents photooxidative stress-induced photoreceptor degeneration and neuroinflammatory responses in the retina. However, the direct impact of hyperoside on microglia-mediated neuroinflammation during photoreceptor degeneration remains unknown. Upon verifying the anti-inflammatory effects of hyperoside in LPS-stimulated BV-2 cells, our results here further demonstrated that post-light damage hyperoside treatment mitigated the loss of photoreceptors and attenuated the functional decline of the retina. Meanwhile, post-light damage hyperoside treatment lowered neuroinflammatory responses and dampened microglial activation in the illuminated retinas. With respect to microglial activation, hyperoside mitigated the pro-inflammatory responses in DNA-stimulated BV-2 cells and lowered DNA-stimulated production of 2'3'-cGAMP in BV-2 cells. Moreover, hyperoside was shown to directly interact with cGAS and suppress the enzymatic activity of cGAS in a cell-free system. In conclusion, the current study suggests for the first time that the DNA sensor cGAS is a direct target of hyperoside. Hyperoside is effective at mitigating DNA-stimulated cGAS-mediated pro-inflammatory activation of microglia, which likely contributes to the therapeutic effects of hyperoside at curtailing neuroinflammation and alleviating neuroinflammation-instigated photoreceptor degeneration.

Keywords: Hyperoside; Microglia activation; Neuroinflammation; Photoreceptor degeneration; cGAS.


Conflict of interest statement

The authors declare no conflict of interest.

Figures

Fig. 1
Fig. 1
Hyperoside suppresses LPS-induced pro-inflammatory responses in BV-2 cells. (a) The cell culture supernatants were collected 12 h after LPS stimulation, followed by ELISA to quantify the amount of TNF, IL6 and CCL2. (b) The scratch-wound healing assay was performed by measuring the wound closure in BV-2 cells up to 24 h at the 1-h interval. Representative micrographs from the indicated treatments were shown in the top panel. Relative wound density was plotted and presented in the bottom panel. Scale bar, 400 μm. Data were expressed as mean ± SEM (n = 4–6 per group). **Compared to VC, P < 0.01; ***compared to VC, P < 0.001; # compared to LPS, P < 0.05; ## compared to LPS, P < 0.01; ### compared to LPS, P < 0.001. ns, not significant. VC, vehicle-treated cells without LPS stimulation; LPS, vehicle-treated LPS-stimulated cells; HYP, LPS-stimulated cells treated with hyperoside at the indicated doses
Fig. 2
Fig. 2
Post-light damage treatment of hyperoside alleviates photoreceptor structural impairment. Hyperoside (100 mg/kg) or 2-APB (10 mg/kg) was administered starting from 3 h post illumination and carried out twice a day for 7 d. (a) Representative OCT scans of the superior and inferior retinas taken from day 7 post light exposure. (b) The ONL thickness measured at 250, 500, 750, and 1000 μm away from the ONH. Data were expressed as mean ± SEM (n = 6 per group). ***Compared to NLE, P < 0.001; ##compared to LE, P < 0.01, ###compared to LE, P < 0.001. NLE, the vehicle-treated mice without light exposure; LE, the light-exposed mice treated with vehicle; HYP, the hyperoside-treated light-exposed mice; 2-APB, the 2-APB-treated light-exposed mice; INL, inner nuclear layer; IS, inner segment; ONH, optic nerve head; ONL, outer nuclear layer; OPL, outer plexiform layer; OS, outer segment
Fig. 3
Fig. 3
Post-light damage treatment of hyperoside improves the retinal function. Hyperoside (100 mg/kg) or 2-APB (10 mg/kg) was administered starting from 3 h post illumination and carried out twice a day for 7 d. ERG was recorded after the indicated treatments. (a) Representative scotopic ERG waves. (b) Amplitudes of a wave and b wave were plotted. Data were presented as mean ± SEM (n = 6 per group). *Compared to NLE, P < 0.05; **compared to NLE, P < 0.01; ***compared to NLE, P < 0.001; #compared to LE, P < 0.05; ##compared to LE, P < 0.01; ###compared to LE, P < 0.001. NLE, the vehicle-treated mice without the experimental light exposure; LE, the vehicle-treated light-exposed mice; HYP, the vehicle-treated light-exposed mice; 2-APB, the 2-APB-treated light-exposed mice
Fig. 4
Fig. 4
Post-light damage treatment of hyperoside mitigates the inflammatory responses and microglial activation in the retina. Hyperoside was administered at 100 mg/kg starting from 3 h post illumination and carried out twice a day for 1 d or 3 d. (a) Real-time qPCR was performed to analyze the expression of Ccl5, Ccl6, Cd68, Cxcl10, Il6 and Tnf in the retinas collected 1 d or 3 d after the indicated treatments. Relative fold change was plotted against that NLE (y-axis, log10 scale). (b) IHC was performed to assess the immunopositivity of Iba-1 (in red) and CD68 (in red) in the retina. Nuclei were counterstained by DAPI (in blue). White asterisks indicate nonspecific background. Scale bar, 50 μm. Data were presented as mean ± SEM (n = 6 per group). **Compared to NLE, P < 0.01; ***compared to NLE, P < 0.001; #compared to LE 1d, P < 0.05; ##compared to LE 1d, P < 0.01; ###compared to LE 1d, P < 0.001. ^compared to LE 3d, P < 0.05; ^^compared to LE 3d, P < 0.01; ^^^compared to LE 3d, P < 0.001; ns, not significant. NLE, the vehicle-treated mice without the experimental light exposure; LE, the vehicle-treated light-exposed mice; HYP, the vehicle-treated light-exposed mice; INL, inner nuclear layer; ONL, outer nuclear layer
Fig. 5
Fig. 5
Post-light damage treatment of hyperoside lowers the retinal expression of genes involved in cytosolic DNA-sensing pathway. (a) Gene set enrichment analysis was derived from our previously published RNA-sequencing data [10]. (b) Heatmap visualization of the representative genes identified in cytosolic DNA-sensing pathway [10]. (c) Hyperoside was administered to the light-exposed mice 3 h after illumination and the retinas were isolated 24 h later. The retinal expression of the indicated genes was analyzed by real-time qPCR. Relative fold change was normalized against NLE (y-axis, log10 scale). Data were expressed as mean ± SEM (n = 6 per group). **Compared to NLE, P < 0.01; ***compared to NLE, P < 0.001; #compared to LE, P < 0.05; ##compared to LE, P < 0.01; ###compared to LE, P < 0.001; ns, not significant. NLE, the vehicle-treated mice without the experimental light exposure; LE, the vehicle-treated light-exposed mice; HYP, the hyperoside-treated light-exposed mice; ES, enrichment score; NES, normalized enrichment score; FDR, false discovery rate
Fig. 6
Fig. 6
Degenerating photoreceptors are marked with diminished dsDNA in the nuclei. (a) Representative microscopic images of dsDNA immunopositivity (in red) and DAPI-counterstained nuclei (in blue) (n = 4 per group). The boxed areas within the images were magnified and displayed in the right panels. Scale bar, 50 μm. (b) The positivity of dsDNA in the ONL was quantified by ImageJ. Relative fold change in the positivity of dsDNA in the ONL was plotted against NLE. Data were expressed as mean ± SEM (n = 6 per group). ***Compared to NLE, P < 0.001. NLE, the mice without the experimental light exposure; LE, the light-exposed mice; INL, inner nuclear layer; ONL, outer nuclear layer
Fig. 7
Fig. 7
The light-exposed retinas are marked with extracellular presence of the exposed DNA. (a) Evans blue dye uptake assay was conducted 1 h, 3 h and 6 h after the experimental light exposure (n = 4 per group). Representative micrographs of DAPI fluorescence (in blue) and Evans blue autofluorescence (in red) were presented. Scale bar, 50 μm. (b) The area of Evans blue autofluorescence in the ONL was quantified by ImageJ. Relative fold change in the area of Evans blue autofluorescence in the ONL was plotted against NLE. Data were expressed as mean ± SEM (n = 6 per group). *Compared to NLE, P < 0.05; ***compared to NLE, P < 0.001. EBD, Evans blue dye; NLE, the mice without the experimental light exposure; LE, the light-exposed mice; INL, inner nuclear layer; ONL, outer nuclear layer
Fig. 8
Fig. 8
Hyperoside inhibits DNA-stimulated pro-inflammatory responses in BV-2 cells. (a) ELISA was performed to quantify ctDNA-stimulated production of TNF, IL6, and INFB 3 h after the indicated treatments. (b) Real-time qPCR analyses of the expression of Ccl5, Cxcl10, Ifnb, Il6 and Tnf in BV-2 cells collected 3 h after the indicated treatments. Relative fold change was normalized against the vehicle-treated BV-2 cells. (c) Western blotting analyses of the level of p-TBK1 and TBK1 in BV-2 cells collected 3 h after the indicated treatments. β-actin was probed as the internal control. Relative fold change was normalized against vehicle-treated BV-2 cells. (d) ELISA was performed to quantify ctDNA-stimulated production of TNF 3 h after the indicated treatments. Data were expressed as mean ± SEM (n = 6 per group). *P < 0.05; **P < 0.01; ***P < 0.001; ns, not significant
Fig. 9
Fig. 9
Hyperoside inhibits DNA-stimulated cGAS activation in microglia. A and B. BV-2 cells were subjected to the indicated treatments for 3 h (a) and 6 h (b), followed by Western blotting analysis of the protein level of cGAS. β-actin served as the internal control. Relative fold change was normalized against the vehicle-treated BV-2 cells. (c) Three hours after the indicated treatments, BV-2 cells were collected and the level of 2′3′-cGAMP was determined by a competitive ELISA. Data were expressed as mean ± SEM (n = 6 per group). **P < 0.01; ***P < 0.001; ns, no significant
Fig. 10
Fig. 10
Hyperoside directly interacts with and inhibits cGAS. (a) MD simulations of hyperoside-mouse cGAS complex. (b) Binding mode of hyperoside to cGAS. (c) SPR analyses of the hyperoside-human cGAS interaction. (d) CETSA assessment of the binding of hyperoside and cGAS protein in BV-2 cells. β-actin was the internal reference. The data were representative of three independently repeated experiments. (e) Measurement of cGAS activity in a cell-free assay by competitive ELISA. cGAS inhibitor CU-76 was included as the positive control. Data were expressed as mean ± SEM (n = 6 per group). *P < 0.05; **P < 0.01. RMSD, root mean square deviation; ns, nanosecond
Fig. 11
Fig. 11
A schematic drawing: Hyperoside may target DNA sensor cGAS and break the vicious cycle of microglial activation-instigated photoreceptor loss. Hyperoside directly interacts with cGAS, suppresses cGAS activation and lowers DNA-stimulated pro-inflammatory responses in microglia, which likely contribute to its effects at mitigating microglial activation-mediated neuroinflammation and photoreceptor degeneration. Dashed line box and dashed arrow indicate findings were derived from in vitro assays

Similar articles

References

    1. Molday RS, Moritz OL. Photoreceptors at a glance. J Cell Sci. 2015;128:4039–4045. doi: 10.1242/jcs.175687. - DOI - PMC - PubMed
    1. Mysore N, Koenekoop J, Li S, Ren H, Keser V, Lopez-Solache I, Koenekoop RK. A review of secondary photoreceptor degenerations in systemic disease. Cold Spring Harb Perspect Med. 2014;5:a025825. doi: 10.1101/cshperspect.a025825. - DOI - PMC - PubMed
    1. Wong WL, Su X, Li X, Cheung CM, Klein R, Cheng CY, Wong TY. Global prevalence of age-related macular degeneration and disease burden projection for 2020 and 2040: a systematic review and meta-analysis. Lancet Glob Health. 2014;2:e106–e116. doi: 10.1016/j.jalz.2014.04.003. - DOI - PubMed
    1. Farrar GJ, Carrigan M, Dockery A, Millington-Ward S, Palfi A, Chadderton N, Humphries M, Kiang AS, Kenna PF, Humphries P. Toward an elucidation of the molecular genetics of inherited retinal degenerations. Hum Mol Genet. 2017;26:R2–R11. doi: 10.1093/hmg/ddx185. - DOI - PMC - PubMed
    1. Karlstetter M, Scholz R, Rutar M, Wong WT, Provis JM, Langmann T. Retinal microglia: just bystander or target for therapy? Prog Retin Eye Res. 2015;45:30–57. doi: 10.1016/j.preteyeres.2014.11.004. - DOI - PubMed

Publication types

MeSH terms

LinkOut - more resources