Faces under continuous flash suppression capture attention faster than objects, but without a face-evoked steady-state visual potential: Is curvilinearity responsible for the behavioral effect?
- PMID: 38755795
- PMCID: PMC7416886
- DOI: 10.1167/jov.20.6.14
Faces under continuous flash suppression capture attention faster than objects, but without a face-evoked steady-state visual potential: Is curvilinearity responsible for the behavioral effect?
Abstract
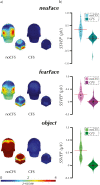
Face perception is a vital part of human social interactions. The social value of faces makes their efficient detection evolutionarily advantageous. It has been suggested that this might occur nonconsciously, but experimental results are equivocal thus far. Here, we probe nonconscious face perception using a novel combination of binocular rivalry with continuous flash suppression and steady-state visually evoked potentials. In the first two experiments, participants viewed either non-face objects, neutral faces (Study 1), or fearful faces (Study 2). Consistent with the hypothesis that faces are processed nonconsciously, we found that faces broke through suppression faster than objects. We did not, however, observe a concomitant face-selective steady-state visually evoked potential. Study 3 was run to reconcile this paradox. We hypothesized that the faster breakthrough time was due to a mid-level visual feature, curvilinearity, rather than high-level category membership, which would explain the behavioral difference without neural evidence of face-selective processing. We tested this hypothesis by presenting participants with four different groups of stimuli outside of conscious awareness: rectilinear objects (e.g., chessboard), curvilinear objects (e.g., dartboard), faces, and objects that were not dominantly curvilinear or rectilinear. We found that faces and curvilinear objects broke through suppression faster than objects and rectilinear objects. Moreover, there was no difference between faces and curvilinear objects. These results support our hypothesis that the observed behavioral advantage for faces is due to their curvilinearity, rather than category membership.
Figures


Similar articles
-
Setting the tone: crossmodal emotional face-voice combinations in continuous flash suppression.Front Psychol. 2025 Jan 16;15:1472489. doi: 10.3389/fpsyg.2024.1472489. eCollection 2024. Front Psychol. 2025. PMID: 39886372 Free PMC article.
-
Objects that induce face pareidolia are prioritized by the visual system.Br J Psychol. 2022 May;113(2):496-507. doi: 10.1111/bjop.12546. Epub 2021 Dec 18. Br J Psychol. 2022. PMID: 34923634
-
Faces in commonly experienced configurations enter awareness faster due to their curvature relative to fixation.PeerJ. 2016 Jan 14;4:e1565. doi: 10.7717/peerj.1565. eCollection 2016. PeerJ. 2016. PMID: 26839746 Free PMC article.
-
Not just another face in the crowd: detecting emotional schematic faces during continuous flash suppression.Emotion. 2012 Oct;12(5):988-96. doi: 10.1037/a0026944. Epub 2012 Feb 6. Emotion. 2012. PMID: 22309728
-
Distributed and interactive brain mechanisms during emotion face perception: evidence from functional neuroimaging.Neuropsychologia. 2007 Jan 7;45(1):174-94. doi: 10.1016/j.neuropsychologia.2006.06.003. Epub 2006 Jul 18. Neuropsychologia. 2007. PMID: 16854439 Review.
Cited by
-
Implicit bias training can remove bias from subliminal stimuli, restoring choice divergence: A proof-of-concept study.PLoS One. 2023 Jul 28;18(7):e0289313. doi: 10.1371/journal.pone.0289313. eCollection 2023. PLoS One. 2023. PMID: 37506067 Free PMC article.
-
Surprising Threats Accelerate Conscious Perception.Front Behav Neurosci. 2022 May 13;16:797119. doi: 10.3389/fnbeh.2022.797119. eCollection 2022. Front Behav Neurosci. 2022. PMID: 35645748 Free PMC article.
References
LinkOut - more resources
Full Text Sources

