. 2020 Jun 3;20(6):12.
doi: 10.1167/jov.20.6.12.

Enhanced luminance sensitivity on color and luminance pedestals: Threshold measurements and a model of parvocellular luminance processing

Affiliations

Enhanced luminance sensitivity on color and luminance pedestals: Threshold measurements and a model of parvocellular luminance processing

Christopher Shooner et al. J Vis. .

Abstract

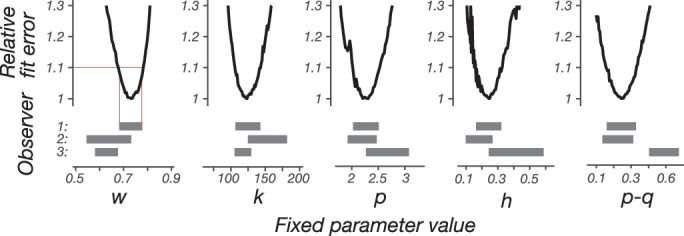
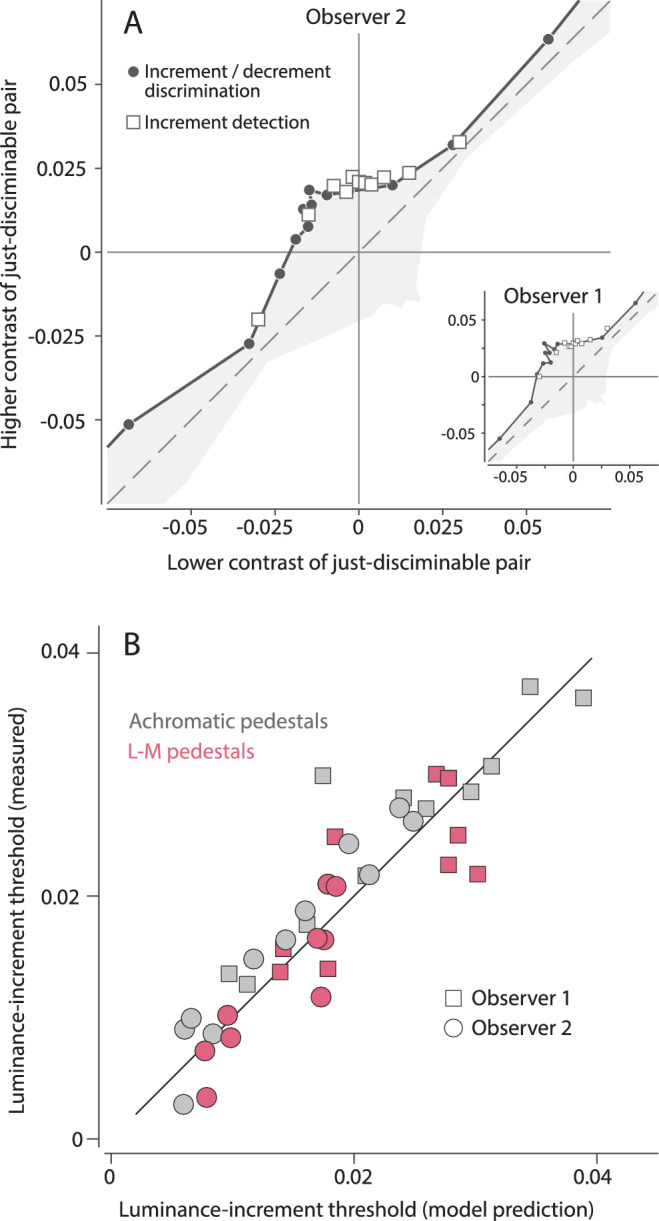
Psychophysical interactions between chromatic and achromatic stimuli may inform our understanding of the cortical processing of signals of parvocellular origin, which carry both luminance and color information. We measured observers' sensitivity in discriminating the luminance of circular patch stimuli with a range of baseline ("pedestal") luminance and chromaticity. Pedestal stimuli were defined along vectors in cone-contrast space in a plane spanned by the red-green cone-opponent (L-M) and achromatic (L + M + S) axes. For a range of pedestal directions and intensities within this plane, we measured thresholds for discriminating increments from decrements along the achromatic axis. Low-contrast pedestals lowered luminance thresholds for every pedestal type. Thresholds began to increase with higher pedestal contrasts, forming a "dipper"-shaped function. Dipper functions varied systematically with pedestal chromaticity: Compared to the achromatic case, chromatic pedestals were effective at lower contrast. We suggest that the enhancement of luminance sensitivity caused by both achromatic and chromatic pedestals stems from a single mechanism, which is maximally sensitive to chromatic stimuli. We fit our data with a computational model of such a mechanism, in which luminance is computed from the rectified output of cone-opponent mechanisms similar to parvocellular neurons.


Figures

Figure 1.
Figure 1.
(A) Stimuli were defined in cone-contrast space, in the plane spanned by the L-M (red-green) and L + M + S (achromatic) axes. (B) Pedestals were defined along eight axes in the red-green/achromatic plane, with a range of contrasts. For each pedestal, we measured thresholds for discriminating an increment from a decrement added to the pedestal, along the achromatic axis. (C) Increment/decrement pairs were presented together in a two-interval trial. The observer reported which interval appeared brighter or more white. Stimulus onset was smooth with a raised-cosine envelope; each stimulus was followed by a broadband noise stimulus to mask its offset.
Figure 2.
Figure 2.
Luminance discrimination thresholds are plotted with respect to pedestal contrast, both in units of absolute cone contrast. The horizontal line in each plot represents the luminance threshold obtained with no pedestal. Observer-averaged results are shown for three example pedestal directions in cone-contrast space: (A) achromatic white (L + M + S), (B) the intermediate axes angled 45 degrees in the red-green/achromatic plane, and (C) red (L-M). The short vertical bars above each curve represent thresholds for detecting the pedestal stimuli. Chromatic pedestals influenced luminance sensitivity at lower absolute pedestal contrast compared to achromatic pedestals. Solid curves show model fits, described in the text.
Figure 3.
Figure 3.
Threshold-versus-contrast functions for luminance discrimination are plotted as in Figure 2, separately for three observers (in columns) and for the eight axes in cone-contrast space along which pedestals were tested (rows). Pedestal axes are referred to by their angle in the red-green/achromatic plane, with L-M defined as 0 degrees and L + M + S as 90 degrees. Opposite-polarity pedestals on the same cone-contrast axis are plotted together. Horizontal bars represent luminance-discrimination thresholds obtained with no pedestal. Vertical ticks above each curve represent thresholds for detection of pedestal stimuli. Solid curves show model fits, described in the text.
Figure 4.
Figure 4.
Model luminance mechanism: The rectified outputs of partially cone-opponent units, similar to parvocellular neurons, are combined to create luminance-increment and decrement channels. Each luminance channel is separately processed by a second-stage nonlinearity consisting of an expansive transducer coupled with divisive gain control. A measure of total stimulus energy for purposes of gain control is computed by pooling over parvo channels, each raised to an exponent. See the main text for mathematical details.
Figure 5.
Figure 5.
We refit the data with one parameter fixed at a single value and other varying freely. A range of fixed values was tested for each parameter, and the resulting model errors were compared to the best-fit error as a ratio. The top row shows this error ratio for Observer 1, for each parameter. The gray bars in the second row represent the range of fixed parameter values yielding fit errors within 10% of the best fit. This range is shown for Observers 2 and 3 as well.
Figure 6.
Figure 6.
We used model fits to compute the minimum pedestal intensity needed to reduce luminance thresholds by 20%, separately for each pedestal. This “threshold for facilitation” is plotted with respect to pedestal angle, along with thresholds for detecting pedestal stimuli.
Figure 7.
Figure 7.
A control experiment measured thresholds for detecting positive luminance increments on fixed pedestals. The results are compared to increment/decrement discrimination thresholds from the main experiment. (A) Data from achromatic pedestals in both experiments are plotted for one observer with a second observer's data in the inset. Axes represent the contrasts (in cone-contrast units) of just-discriminable pairs, the two stimuli presented at threshold. The shaded region represents pairs of contrast expected to be indistinguishable. (B) Model fits to data from the main experiment were used to predict thresholds in the control experiment (not used in fits). Results from achromatic and red-green (L-M) pedestals are plotted for two observers. Prediction error did not show a strong dependence on pedestal type or contrast.

References

    1. Billock V. A. (1995). Cortical simple cells can extract achromatic information from the multiplexed chromatic and achromatic signals in the parvocellular pathway. Vision Research, 35, 2359–2369. - PubMed
    1. Boycott B. B., Hopkins J. M., & Sperling H. G. (1987). Cone connections of the horizontal cells of the rhesus monkey's retina. Proceedings of the Royal Society of London, Series B, Biological Sciences, 229, 345–379. - PubMed
    1. Brainard D. H. (1997). The psychophysics toolbox. Spatial Vision, 10, 433–436. - PubMed
    1. Calkins D. J., Schein S. J., Tsukamoto Y., & Sterling P. (1994). M and L cones in macaque fovea connect to midget ganglion cells by different numbers of excitatory synapses. Nature, 371, 70. - PubMed
    1. Chaparro A., Stromeyer C. F., Kronauer R. E., & Eskew R. T. (1994). Separable red-green and luminance detectors for small flashes. Vision Research, 34, 751–762. - PubMed