. 2024 Apr 11;15(19):7092-7103.
doi: 10.1039/d4sc01288g. eCollection 2024 May 15.

Constitutional adaptation to p Ka modulation by remote ester hydrolysis

Affiliations

Constitutional adaptation to p Ka modulation by remote ester hydrolysis

Ferran Esteve et al. Chem Sci. .

Abstract

The mechanisms through which environmental conditions affect the expression of interconnected species is a key step to comprehending the principles underlying complex chemical processes. In Nature, chemical modifications triggered by the environment have a major impact on the structure and function of biomolecules and regulate different reaction pathways. Yet, minimalistic artificial systems implementing related adaptation behaviours remain barely explored. The hydrolysis of amino acid methyl esters to their corresponding amino acids leads to a drastic change in pKa (ca. 7 and 9, respectively) that protonates the free amino group at physiological conditions. Dynamic covalent libraries (DCvLs) based on amino acid methyl esters and aldehydes respond to such hydrolysis and lead to constitutional adaptation. Each of the libraries studied experiences a DCvL conversion allowing for constituent selection due to the silencing of the zwitterionic amino acids towards imine formation. The selective action of different enzymes on the DCvLs results in states with simplified constitutional distributions and transient chirality. When additional components (i.e., scavengers) that are not affected by hydrolysis are introduced into the dynamic libraries, the amino acid methyl ester hydrolysis induces the up-regulation of the constituents made of these scavenging components. In these systems, the constituent distribution is resolved from a scrambled mixture of imines to a state characterized by the predominance of a single aldimine. Remarkably, although the final libraries display higher "simplexity", the different transient states present an increased complexity that allows for the emergence of organized structures [micelle formation] and distributions [up-regulation of two antagonistic constituents]. This reactive site inhibition by a remote chemical modification resembles the scenario found in some enzymes for the regulation of their activity through proximal post-translational modifications.


Conflict of interest statement

There are no conflicts to declare.

Figures

Fig. 1
Fig. 1. (A) Representation of a decrease in activity at the catalytic site of a protein by a PTM (serine phosphorylation) accompanied by a change in the pKa of a nearby residue (histidine protonation). (B) Hydrolysis of AAOMe (terminal –NH2 site reactive in imination) to yield +AA (terminal –N+H3 site silent in imination) and a molecule of CH3OH. (C) Representation of the proposed remote modification leading to the inhibition of the components of DCvLs (colour code has been maintained for comparison).
Fig. 2
Fig. 2. (A) Aldehyde screening using ArgOMe as the model amine. (B) Amine screening using best-performing A1 as aldehyde. Left: Chemical structures of the different reagents employed. Right: Component abundances obtained after equilibration (1 h at room temperature). The hydrate detected was included in the aldehyde composition. Amine pKa values (calculated using MarvinSketch) have been included in brackets. All abundances were calculated using 1H NMR spectroscopy (500 MHz, D2O, pD = 7.0, PBS buffer 50 mM, 293 K). Initial concentration of reagents 5 mM each in all cases. Error in abundance: 5%.
Fig. 3
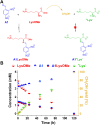
Fig. 3. (A) Chemical representation of the LysOMe reaction with A1 influenced by the hydrolysis of LysOMe to produce +Lys. (B) Concentration profile for the different species detected in solution over 120 h of reaction. The right Y-axis corresponds to the yield of methanol (dark yellow stars) calculated. Concentration and yields determined by 1H NMR spectroscopy (500 MHz, D2O, pD = 7.0, PBS buffer 50 mM, 293 K). The hydrate detected was included in the aldehyde concentration (mM). Initial concentration of reagents: 5 mM. Error bars correspond to 5% of the measurement.
Fig. 4
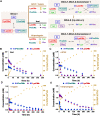
Fig. 4. (A) Reaction between A1, LysOMe, and PheOMe in the absence (black path) and presence of AChE, trypsin and chymotrypsin (brown paths, below). The DCvL1-DCvL2-Conversion 1/2 (5 components, 4 constituents) from DCvL1 (3 components, 2 constituents) to DCvL2 (3 components, 2 constituents) have also been introduced. Predominant compounds (>0.7 mM) are marked with a coloured rectangle. Grey lines correspond to antagonistic relationships; the brown and black arrows represent the time evolution of DCvL1 to reach DCvL2, in the presence and absence of enzymes, respectively. Concentration profile for the different constituents detected in solution over 264 h of reaction in the absence (B) and presence of (C) AChE, (D) trypsin, and (E) chymotrypsin. Concentration and yields determined by 1H NMR spectroscopy (500 MHz, D2O, pD = 7.0, PBS buffer 50 mM, 293 K). Initial concentration of reagents: 5 mM.
Fig. 5
Fig. 5. (A) Reaction between (D)LysOMe, (L)LysOMe and A1 in the presence of AChE (0.01 mol%). DCvL3-DCvL4-Conversion (5 components, 4 constituents) from DCvL3 (3 components, 2 constituents) to DCvL4 (3 components, 2 constituents) has also been introduced. Predominant compounds (>1.5 mM) are marked with a coloured rectangle. Grey lines correspond to antagonistic relationships; the brown arrows represent the time evolution of DCvL3 to reach DCvL4. (B) Concentration profile for the different constituents detected in solution over 140 h. Concentration and yields determined by 1H NMR spectroscopy (500 MHz, D2O, pD = 7.0, PBS buffer 50 mM, 293 K). Initial concentration of reagents: 5 mM. (C) Time evolution of the s factors calculated for A1(D)LysOMe, +(L)Lys, and (D)LysOMe over 126 h.
Fig. 6
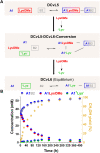
Fig. 6. (A) Reaction between A1, LysOMe, and B2. DCvL5-DCvL6-Conversion (5 components, 4 constituents) from DCvL5 (3 components, 2 constituents) to DCvL6 (3 components, 2 constituents) has also been represented. Predominant compounds (>35 mM) are marked with a coloured rectangle. Grey lines correspond to antagonistic relationships; the black arrows represent the time evolution of DCvL5 to reach DCvL6. (B) Concentration profile for the different constituents detected in solution over 400 h of reaction. Concentration and yields determined by 1H NMR spectroscopy (500 MHz, D2O, pD = 7.0, PBS buffer 500 mM, 293 K). Initial concentration of reagents: 80 mM.
Scheme 1
Scheme 1. Two-step synthesis of amphiphilic pseudopeptidic compounds AlaNHCX. (i) DCM, r.t., 16 h. (ii) TFA, DCM, r.t., 3 h.
Fig. 7
Fig. 7. (A) Reaction between A1, LysOMe, ArgOMe, and AlaNHC7. DCvL7-DCvL8-Conversion (6 components, 5 constituents) from DCvL7 (4 components, 3 constituents) to DCvL8 (4 components, 3 constituents) has also been represented. Predominant compounds (>5 mM) are marked with a coloured rectangle. Grey lines correspond to antagonistic relationships; the black arrows represent the time evolution of DCvL7 to reach DCvL8. (B) Concentration profile for the different constituents detected in solution over 290 h of reaction. Concentrations determined by 1H NMR spectroscopy (500 MHz, D2O, pD = 7.0, PBS buffer 500 mM, 293 K). Initial concentration of reagents: 35 mM. CMC determined by fluorescence spectroscopy.
Fig. 8
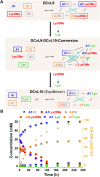
Fig. 8. (A) Reaction between A1, A3, LysOMe, and B2. DCvL9-DCvL10-Conversion (5 components, 6 constituents) from DCvL9 (4 components, 4 constituents) to DCvL10 (4 components, 4 constituents) has also been represented. Predominant compounds (>15 mM) are marked with a coloured rectangle. Grey and cyan lines correspond to antagonistic and agonistic relationships, respectively; the black arrows represent the time evolution of DCvL9 to reach DCvL10. (B) Concentration profile for the different constituents detected in solution over 264 h of reaction. Concentration and yields determined by 1H NMR spectroscopy (500 MHz, D2O, pD = 7.0, PBS buffer 500 mM, 293 K). Initial concentration of reagents: 80 mM.

Similar articles

Cited by

References

    1. Jencks W. P., Catalysis in Chemistry and Enzymology, McGraw-Hill, New York, 1969
    1. Csizmok V. Forman-Kay J. D. Complex regulatory mechanisms mediated by the interplay of multiple post-translational modifications. Curr. Opin. Struct. Biol. 2018;48:58–67. doi: 10.1016/j.sbi.2017.10.013. - DOI - PubMed
    1. Wang Z. A. Cole P. A. The Chemical Biology of Reversible Lysine Post-translational Modifications. Cell Chem. Biol. 2020;27:953–969. doi: 10.1016/j.chembiol.2020.07.002. - DOI - PMC - PubMed
    1. Probst A. V. Dunleavy E. Almouzni G. Epigenetic inheritance during the cell cycle. Nat. Rev. Mol. Cell Biol. 2009;10:192–206. doi: 10.1038/nrm2640. - DOI - PubMed
    1. Isom D. G. Castañeda C. A. Cannon B. R. García-Moreno B. Large shifts in pKa values of lysine residues buried inside a protein. Proc. Natl. Acad. Sci. U. S. A. 2011;108:5260–5265. doi: 10.1073/pnas.1010750108. - DOI - PMC - PubMed