

American clusters: using machine learning to understand health and health care disparities in the United States
- PMID: 38756919
- PMCID: PMC10986293
- DOI: 10.1093/haschl/qxae017
American clusters: using machine learning to understand health and health care disparities in the United States
Erratum in
-
Correction to: American clusters: using machine learning to understand health and health care disparities in the United States.Health Aff Sch. 2024 Dec 9;2(12):qxae146. doi: 10.1093/haschl/qxae146. eCollection 2024 Dec. Health Aff Sch. 2024. PMID: 39664474 Free PMC article.
Abstract
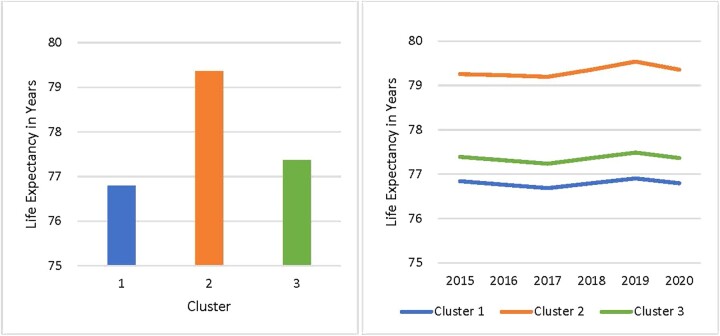
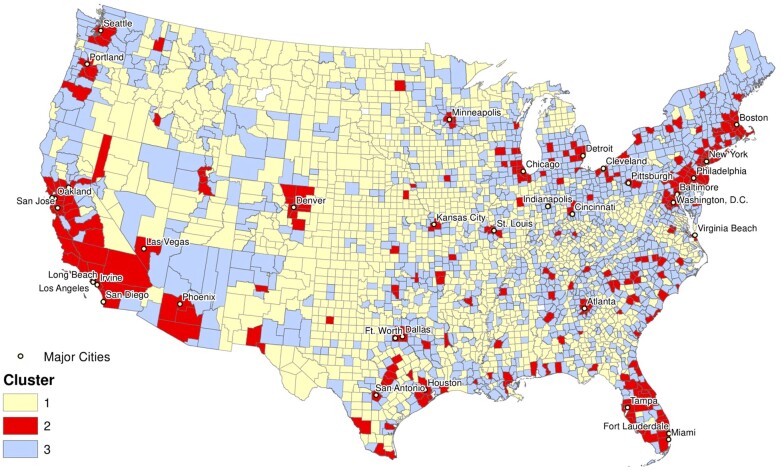
Health and health care access in the United States are plagued by high inequality. While machine learning (ML) is increasingly used in clinical settings to inform health care delivery decisions and predict health care utilization, using ML as a research tool to understand health care disparities in the United States and how these are connected to health outcomes, access to health care, and health system organization is less common. We utilized over 650 variables from 24 different databases aggregated by the Agency for Healthcare Research and Quality in their Social Determinants of Health (SDOH) database. We used k-means-a non-hierarchical ML clustering method-to cluster county-level data. Principal factor analysis created county-level index values for each SDOH domain and 2 health care domains: health care infrastructure and health care access. Logistic regression classification was used to identify the primary drivers of cluster classification. The most efficient cluster classification consists of 3 distinct clusters in the United States; the cluster having the highest life expectancy comprised only 10% of counties. The most efficient ML clusters do not identify the clusters with the widest health care disparities. ML clustering, using county-level data, shows that health care infrastructure and access are the primary drivers of cluster composition.
Keywords: American clusters; health disparities; machine learning; social determinants of health.
© The Author(s) 2024. Published by Oxford University Press on behalf of Project HOPE - The People-To-People Health Foundation, Inc.
Conflict of interest statement
Conflicts of interest Please see ICMJE form(s) for author conflicts of interest. These have been provided as Supplementary materials.
Figures
Similar articles
-
Assessment of Structural Barriers and Racial Group Disparities of COVID-19 Mortality With Spatial Analysis.JAMA Netw Open. 2022 Mar 1;5(3):e220984. doi: 10.1001/jamanetworkopen.2022.0984. JAMA Netw Open. 2022. PMID: 35244703 Free PMC article.
-
Inequalities in Life Expectancy Among US Counties, 1980 to 2014: Temporal Trends and Key Drivers.JAMA Intern Med. 2017 Jul 1;177(7):1003-1011. doi: 10.1001/jamainternmed.2017.0918. JAMA Intern Med. 2017. PMID: 28492829 Free PMC article.
-
Development and Validation of a County-Level Social Determinants of Health Risk Assessment Tool for Cardiovascular Disease.Ann Fam Med. 2020 Jul;18(4):318-325. doi: 10.1370/afm.2534. Ann Fam Med. 2020. PMID: 32661032 Free PMC article.
-
Social Determinants of Health and Cardiovascular Disease: Current State and Future Directions Towards Healthcare Equity.Curr Atheroscler Rep. 2021 Jul 26;23(9):55. doi: 10.1007/s11883-021-00949-w. Curr Atheroscler Rep. 2021. PMID: 34308497 Review.
-
Emergency department-based interventions affecting social determinants of health in the United States: A scoping review.Acad Emerg Med. 2021 Jun;28(6):666-674. doi: 10.1111/acem.14201. Epub 2021 Feb 2. Acad Emerg Med. 2021. PMID: 33368833 Free PMC article.
Cited by
-
The power of artificial intelligence for managing pandemics: A primer for public health professionals.Int J Health Plann Manage. 2025 Jan;40(1):257-270. doi: 10.1002/hpm.3864. Epub 2024 Oct 27. Int J Health Plann Manage. 2025. PMID: 39462894 Free PMC article. Review.
-
Social determinant of health patterns and mortality outcomes in US adults.BMC Public Health. 2025 Aug 14;25(1):2761. doi: 10.1186/s12889-025-24126-9. BMC Public Health. 2025. PMID: 40814044 Free PMC article.
-
Social Media Influences on Dietary Awareness in Children.Healthcare (Basel). 2024 Oct 2;12(19):1966. doi: 10.3390/healthcare12191966. Healthcare (Basel). 2024. PMID: 39408146 Free PMC article. Review.
References
-
- Tolbert J, Drake P, Damico A. Key facts about the uninsured population. KFF. Published 2022. Accessed July 24, 2023. https://www.kff.org/uninsured/issue-brief/key-facts-about-the-uninsured-...
LinkOut - more resources
Full Text Sources