

Lytic/Lysogenic Transition as a Life-History Switch
- PMID: 38756985
- PMCID: PMC11097211
- DOI: 10.1093/ve/veae028
Lytic/Lysogenic Transition as a Life-History Switch
Abstract
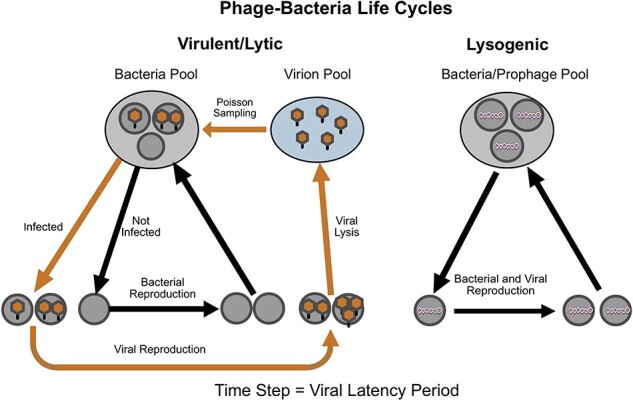
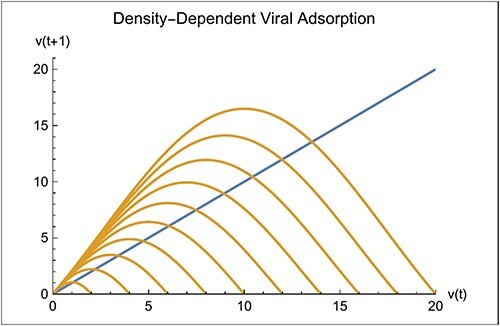
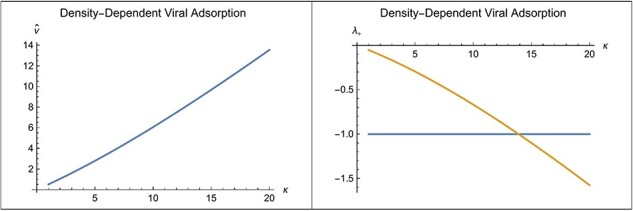
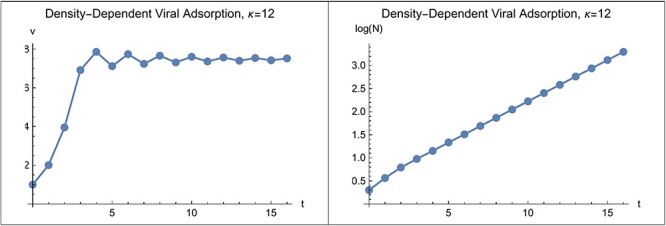
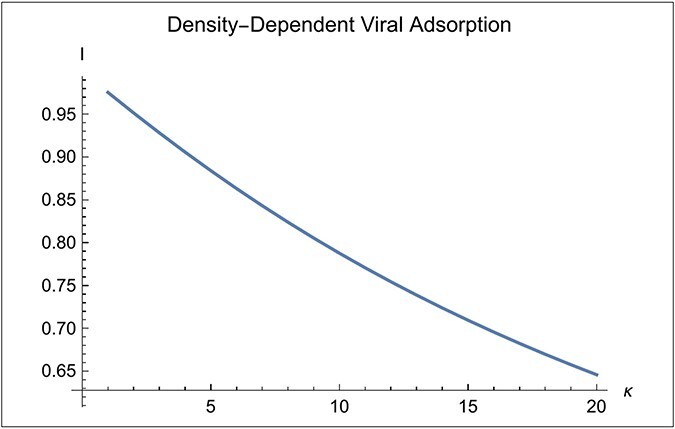
The transition between lytic and lysogenic life cycles is the most important feature of the life-history of temperate viruses. To explain this transition, an optimal life-history model is offered based a discrete-time formulation of phage/bacteria population dynamics that features infection of bacteria by Poisson sampling of virions from the environment. The time step is the viral latency period. In this model, density-dependent viral absorption onto the bacterial surface produces virus/bacteria coexistence and density dependence in bacterial growth is not needed. The formula for the transition between lytic and lysogenic phases is termed the 'fitness switch'. According to the model, the virus switches from lytic to lysogenic when its population grows faster as prophage than as virions produced by lysis of the infected cells, and conversely for the switch from lysogenic to lytic. A prophage that benefits the bacterium it infects automatically incurs lower fitness upon exiting the bacterial genome, resulting in its becoming locked into the bacterial genome in what is termed here as a 'prophage lock'. The fitness switch qualitatively predicts the ecogeographic rule that environmental enrichment leads to microbialization with a concomitant increase in lysogeny, fluctuating environmental conditions promote virus-mediated horizontal gene transfer, and prophage-containing bacteria can integrate into the microbiome of a eukaryotic host forming a functionally integrated tripartite holobiont. These predictions accord more with the 'Piggyback-the-Winner' hypothesis than with the 'Kill-the-Winner' hypothesis in virus ecology.
Keywords: bacteriophage; ecogeographic rules; fitness switch; holobiont; hologenome; horizontal gene transfer; kill-the-winner; life-history; lysogenic; lytic; mathematical model; microbialization; phage; piggyback-the-winner; population dynamics; prophage lock; tripartite holobiont; viral biogeography.
© The Author(s) 2024. Published by Oxford University Press.
Conflict of interest statement
None declared.
Figures
References
-
- Anthenelli M. et al. (2020) ‘Phage and Bacteria Diversification through a Prophage Acquisition Ratchet’, bioRxiv2020.04.08.028340.
-
- Aurell E. et al. (2002) ‘Stability Puzzles in Phage’, Physical Review E, 65: 05191. - PubMed
-
- Azam A. H., and Tanji Y. (2019) ‘Bacteriophage-host Arm Race: An Update on the Mechanism of Phage Resistance in Bacteria and Revenge of the Phage with the Perspective for Phage Therapy’, Applied Microbiology and Biotechnology, 103: 2121–31. - PubMed
LinkOut - more resources
Full Text Sources
