

Identification of key genes related to heart failure by analysis of expression profiles
- PMID: 38757035
- PMCID: PMC11094840
- DOI: 10.5114/aoms/114896
Identification of key genes related to heart failure by analysis of expression profiles
Abstract
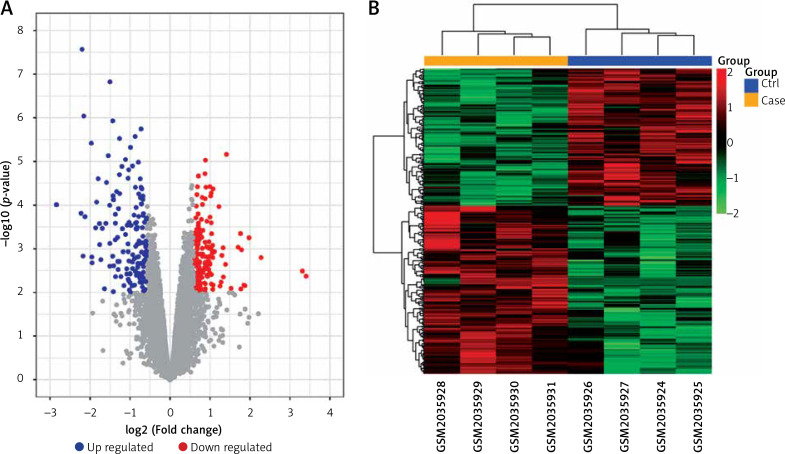
Introduction: To elucidate the candidate biomarkers involved in the pathogenesis process of heart failure (HF) via analysis of differentially expressed genes (DEGs) of the dataset from the Gene Expression Omnibus (GEO).
Material and methods: The GSE76701 gene expression profiles regarding the HF and control subjects were respectively analysed. Briefly, DEGs were firstly identified and subjected to Cytoscape plug-in ClueGO + CluePedia and Kyoto Encyclopedia of Genes and Genomes (KEGG) enrichment analyses. A protein-protein interaction (PPI) network was then built to analyse the interaction between DEGs, followed by the construction of an interaction network by combining with hub genes with the targeted miRNA genes of DEGs to identify the key molecules of HF. In addition, potential drugs targeting key DEGs were sought using the drug-gene interaction database (DGIdb), and a drug-mRNA-miRNA interaction network was also constructed.
Results: A total of 489 DEGs were verified between HF and control, which mainly enriched in type I interferon and leukocyte migration according to molecular function. Significantly increased levels of GAPDH, GALM1, MMP9, CCL5, and GNAL2 were found in the HF setting and were identified as the hub genes based on the PPI network. Furthermore, according to the drug-mRNA-miRNA network, FCGR2B, CCND1, and NF-κb, as well as corresponding miRNA-605-5p, miRNA-147a, and miRNA-671-5p were identified as the drug targets of HF.
Conclusions: The hub genes GAPDH, GALM1, MMP9, CCL5, and GNAL2 were significantly increased in HF. miRNA-605-5p, miRNA-147a, and miRNA-671-5p were predicted as the drug target-interacted gene-miRNA of HF.
Keywords: PPI network; differentially expressed gene; drug-mRNA-miRNA network; enrichment analysis; heart failure.
Copyright: © 2021 Termedia & Banach.
Conflict of interest statement
The authors declare no conflict of interest.
Figures


Similar articles
-
Key Genes Associated with Pyroptosis in Gout and Construction of a miRNA-mRNA Regulatory Network.Cells. 2022 Oct 17;11(20):3269. doi: 10.3390/cells11203269. Cells. 2022. PMID: 36291136 Free PMC article.
-
Identification of vital modules and genes associated with heart failure based on weighted gene coexpression network analysis.ESC Heart Fail. 2022 Apr;9(2):1370-1379. doi: 10.1002/ehf2.13827. Epub 2022 Feb 6. ESC Heart Fail. 2022. PMID: 35128826 Free PMC article.
-
Identification of Differentially Expressed Genes and miRNAs for Ulcerative Colitis Using Bioinformatics Analysis.Front Genet. 2022 Jun 2;13:914384. doi: 10.3389/fgene.2022.914384. eCollection 2022. Front Genet. 2022. PMID: 35719390 Free PMC article.
-
Identification of candidate biomarkers and therapeutic agents for heart failure by bioinformatics analysis.BMC Cardiovasc Disord. 2021 Jul 4;21(1):329. doi: 10.1186/s12872-021-02146-8. BMC Cardiovasc Disord. 2021. PMID: 34218797 Free PMC article.
-
Integrated miRNA-mRNA network revealing the key molecular characteristics of ossification of the posterior longitudinal ligament.Medicine (Baltimore). 2020 May 22;99(21):e20268. doi: 10.1097/MD.0000000000020268. Medicine (Baltimore). 2020. PMID: 32481304 Free PMC article.
Cited by
-
Comparative Analysis of Non-Coding RNA Transcriptomics in Heart Failure.Biomedicines. 2022 Nov 30;10(12):3076. doi: 10.3390/biomedicines10123076. Biomedicines. 2022. PMID: 36551832 Free PMC article. Review.
References
-
- Centre NCG. Chronic Heart Failure: National Clinical Guideline for Diagnosis and Management in Primary and Secondary Care: Partial Update. 2010. - PubMed
-
- Ponikowski P, Voors AA, Anker SD, et al. . 2016 ESC Guidelines for the diagnosis and treatment of acute and chronic heart failure: the task force for the diagnosis and treatment of acute and chronic heart failure of the European Society of Cardiology (ESC). Developed with the special contribution of the Heart Failure Association (HFA) of the ESC. Eur Heart J 2016; 18: 891-975. - PubMed
-
- Vos T, Barber RM, Bell B, et al. . Global, regional, and national incidence, prevalence, and years lived with disability for 301 acute and chronic diseases and injuries in 188 countries, 1990–2013: a systematic analysis for the Global Burden of Disease Study 2013. Lancet 2015; 386: 743-800. - PMC - PubMed
-
- Bielecka-Dabrowa A, von Haehling S, Rysz J, Banach M. Novel drugs for heart rate control in heart failure. Heart Fail Rev 2018; 23: 517-25. - PubMed
LinkOut - more resources
Full Text Sources
Research Materials
Miscellaneous